Quantcast
Channel: Databricks
Viewing all 1999 articles
Browse latest View live

Introducing Databricks Runtime 5.4 with Conda (Beta)

$
0
0

We are excited to introduce a new runtime: Databricks Runtime 5.4 with Conda (Beta). This runtime uses Conda to manage Python libraries and environments. Many of our Python users prefer to manage their Python environments and libraries with Conda, which quickly is emerging as a standard. Conda takes a holistic approach to package management by enabling:

  • The creation and management of environments
  • Installation of Python packages
  • Easily reproducible environments
  • Compatibility with pip

We are therefore happy to announce that you can now get a runtime that is fully based on Conda. It is being released with the “Beta” label, as it is intended for experimental usage only, not yet for production workloads. This designation provides an opportunity for us to collect customer feedback. As Databricks Runtime with Conda matures, we intend to make Conda the default package manager for all Python users.

To get started, select the Databricks Runtime 5.4 with Conda (Beta) from the drop-down list when creating a new cluster in Databricks. Follow the instructions displayed when you hover over the question mark to select one of the two pre-configured environments: Standard (default) or Minimal.

Why Databricks Runtime with Conda

Conda is an open source package & environment management system. Due to its extensive support and flexibility, Conda is becoming the standard among developers for managing Python packages. As an environment manager, it enables users to easily create, save, load, and switch between Python environments. We have been using Conda to manage Python libraries in Databricks Runtime for Machine Learning, and have received positive feedback. With Databricks Runtime with Conda (Beta), we extend Conda to serve more use cases.

For Python developers, creating an environment with desired libraries installed is the first step. In particular, the field of machine learning is evolving rapidly, and new tools and libraries in Python are emerging and are being updated frequently. Setting up a reliable environment poses challenges, such as version conflicts, dependency issues, and environment reproducibility. Conda was created to solve this very problem.  By combining environments and installation into a single framework, developers can easily and reliably set up libraries in an isolated environment. Building-in first-class Conda support in Databricks Runtime significantly improves the productivity of developers and data scientists on your team.

Our Unified Analytics Platform serves a wide variety of users and experience levels. We enable users migrating from SAS or R to Python but are still new to Python to Python experts. Our intention is to make managing your Python environment as easy as possible. In service of this, we offer:

  • Multiple robust pre-configured environments, each serving a different use case
  • A simple way to customize environments
  • The ease and flexibility to manage, share, and recreate environments at different levels of the Databricks product (Workspace, cluster, and notebook)

Not only do we want to make it very easy for you to get started in Databricks, but also very easy for you to migrate Python code developed somewhere else to Databricks. In Databricks Runtime 5.4 with Conda (Beta), you can take code, along with the requirements file (requirement.txt)  from GitHub, Jupyter notebooks, or other data science IDE to Databricks. Everything should just work out of the box. As a developer, you can spend little time worrying about managing libraries, and focus your time on developing applications.

What Databricks Runtime Conda 5.4 (Beta) Offers

Databricks Runtime 5.4 with Conda (Beta) improves flexibility in the following ways:

Enhance Pre-configured Environments

  • We are committed to providing pre-configured environments with popular Python libraries installed. In Databricks Runtime 5.4 with Conda (Beta), we introduce two configured environments: Standard and Minimal (Azure | AWS). In both environments, we upgraded Python base libraries, compared to Databricks Runtime (Azure | AWS)
  • Databricks Runtime 5.4 with Conda (Beta) allows you to use Conda to install Python packages. If you want to install libraries, you will benefit from the support Conda provides. Please refer to the User Guide (Azure | AWS) to learn how to use Conda to install packages
  • We are leveraging Anaconda Distribution 5.3.1
  • We upgraded to Python 3.7

Easy Customization of Environment

  • Databricks Runtime 5.4 with Conda (Beta) allows you to easily customize your Python environments. You can define your environment needs in a requirements file (requirements.txt), upload it to DBFS, and then use dbutils.library.install to build the customized environment in a notebook. You no longer need to install libraries one by one.
  • You can find sample requirements files and instructions to customize environments in User Guide (Azure | AWS)

Environment Reproducibility

  • In Databricks Runtime 5.4 with Conda (Beta), each notebook can have an isolated Python environment, mitigating package conflicts across notebooks.
  • You can use requirements.txt to easily reproduce an environment to a notebook.

Which Runtime I Should Pick

In the future, the Databricks Runtime for Conda will be the standard runtime. However, as a Beta offering, Databricks Runtime with Conda is intended for experimental usage, not for production workloads. Here are some guidelines to help you choose a runtime:

Databricks Runtime: We encourage Databricks Runtime users who need stability to continue to use Databricks Runtime.

Databricks Runtime ML: We encourage Databricks Runtime ML users who don’t need to customize environments to continue to use Databricks Runtime ML.

Databricks Runtime with Conda: Databricks Runtime 5.4 with Conda (Beta) offers two Conda-based, preconfigured root environments — Standard and Minimal —  that serve different use cases.

  • Standard Environment: The default environment (Azure | AWS). At cluster creation, you select the Databricks Runtime 5.4 with Conda (Beta) in the Databricks Runtime Version drop-down list. Aimed to serve Databricks Runtime users, the Standard Environment provides a ready-to-use environment by pre-installing popular python packages based on usage. A number of base Python libraries are upgrade in the Standard Environment. We encourage users of Databricks Runtime who need these upgraded Python libraries to try out the Standard environment.
  • Minimal Environment: Includes a minimal set of libraries to run Python notebooks and PySpark in Databricks (Azure | AWS). This light environment is designed for customization. We encourage Python users who need to customize their Python environment but run into dependency conflicts with the standard environment to try out the Minimal environment.

To use the Minimal environment, you select Databricks Runtime 5.4 with Conda in the Databricks Runtime Version drop-down list. Then follow the instructions to copy and paste DATABRICKS_ROOT_CONDA_ENV=databricks-minimal to Advanced Options > Spark > Environment Variables, which can be found at the bottom of the Create Cluster Page (see below). In the upcoming releases, we will simplify this step and let you choose the MInimal environment from a drop-down list.

What to Expect in Upcoming Releases

In the coming releases, we plan to keep improving the three key use cases Databricks Runtime with Conda serves.

Enhance Pre-configured Environments

Our ultimate goal is to unify cluster creation for all three runtimes (Databricks Runtime, Databricks Runtime ML, Databricks Runtime with Conda) in a seamless experience. At full product maturity, we expect to have multiple pre-configured environments serving different use cases, including environments for Machine Learning. In addition, we plan to improve the user experience by allowing you to choose a pre-configured environment in Databricks Runtime with Conda from a drop-down list. Finally, we will continue to update Python packages as well as Anaconda distribution.

Easy Customization of Environments

We plan to add support for using environment.yml (environment file used by conda with Libraries Utilities in notebooks. We also plan to support conda package installation in Library Utilities in notebooks and in cluster-installed libraries. Currently both use PyPI.

Easy Reproducibility of Environments

We plan to make it very easy to view, modify, and share environment parameters across users. You can save an environment file in Workspace, and easily switch between environments so that the same environment can be replicated to a cluster at cluster creation.

Upgraded Python Libraries in Databricks Runtime 5.4 with Conda (Beta)

Please find the list of pre-installed packages in Databricks Runtime with Conda (Beta) in our release notes (Azure | AWS).

Read More

  • Databricks Runtime 5.4 with Conda (Beta) release notes (Azure | AWS)
  • Databricks Runtime 5.4 with Conda (Beta) User Guide (Azure | AWS)


--

Try Databricks for free. Get started today.

The post Introducing Databricks Runtime 5.4 with Conda (Beta) appeared first on Databricks.


Protecting the Securities Market with Predictive Fraud Detection

$
0
0

FINRA (Financial Industry Regulatory Authority), a regulatory body charged with protecting the U.S. securities market, spoke at the Spark + AI Summit on how they use Databricks Unified Analytics Platform to analyze up to a 100 billion stock market events per day for fraud detection and prevention. This is a summary of their story from Summit.

Interested in learning how to detect financial fraud with machine learning and Apache Spark? Watch our webinar on Detecting Financial Fraud at Scale with Machine Learning for a step-by-step walkthrough on how to build a financial fraud model at scale including a live demo.


Every investor in America relies on one thing: fair financial markets. FINRA is a regulatory body charged with protecting investors by ensuring that the U.S. securities industry operates in an honest and fair manner.

FINRA does this by running surveillance on 99% of the equity markets and around 70% of the options markets. For example, they look to curb fraudulent or unfair behavior such as collusion among various parties to manipulate the market in their favor. FINRA accomplishes this by capturing feeds of transaction data from the various securities markets and then running machine learning algorithms against the data to identify behavior that is indicative of something out of the ordinary or identify a known pattern of fraudulent behavior and then flag these anomalies and take action on them. However, prior to adopting Databricks, FINRA ran into numerous challenges.

The Challenge: Massive Data, Fragmented Teams

On the road to providing AI-powered fraud detection, FINRA faced a number of challenges including massive volumes of fragmented data, inadequate tooling, and siloed teams.


Fragmented Data – prior to using Databricks, due to the data being stored in disparate on-premise systems, it was highly complex and costly to build performant and reliable data pipelines that could scale to support the volumes of data they were ingesting— more than 100 billion events per day. It was nearly impossible to explore and visualize the data freely as they were locked down, and getting access involved cumbersome processes.

Inadequate ML Tools – FINRA used a series of tools and systems to develop their fraud models. In production, they used SQL rules which were highly complex requiring hundreds of pages of SQL statements with all sorts of subclauses. These queries were very difficult to develop, debug and had performance issues. Further, the code was not modular and could not be changed or improved very easily.

Siloed Teams –  their disjointed analytics workflows resulted in a number of problems for FINRA including lack of code reuse and limited collaboration across data science and engineering teams. On a given project, the data scientist would first investigate the problem and then build and train their models in R or Python. Once the models were ready for production, the engineering team would then take that output from the data science team and rewrite it in SQL in order to deploy into production. This resulted in very long development cycles, and most importantly, highly inaccurate models that didn’t achieve the ultimate goal of identifying patterns of malicious behavior.

Figure: FINRA’s legacy  architecture created a siloed development process


The Solution: Moving Towards a Unified, ML-driven Environment

FINRA’s data teams knew they were running uphill with the inherent complexities of their legacy workflow. Databricks provides FINRA with a unified analytics platform that democratizes data and brings previously siloed teams together, cutting down the overall time to market, increasing the reusability of feature libraries, and improving operational efficiency.

Figure: The Databricks Unified Analytics Platform has allowed FINRA to move
from basic SQL analytics to AI-driven analytics

With Databricks, we have one cohesive end-to-end process with one single unified team working on protecting the securities markets.” —Vincent Saulys, Senior Director, Advanced Surveillance Development, FINRA

As a fully managed cloud service, FINRA’s data science team is able to focus on higher-level issues related to the domain of machine learning rather than DevOps work. Provisioning compute clusters on-demand with a powerful cluster manager that offers auto-scaling and auto-termination for optimal operational efficiency, so they never have to worry about the various complexities that are under the hood.

The interactive workspace, with robust support for multiple programming languages including SQL, Scala, R, and Python, allows FINRA’s data scientists to overcome silos to iterate faster and collaborate better. The easy to use notebook interface and cluster manager has allowed all users of various disciplines to participate in developing machine learning models.

To build a machine-learning model, FINRA had to develop a Feature Framework. The SQL patterns were split into simple functions that can be used repeatedly on various models. The resulting ML models developed was so modular, features could be changed or modified anytime. This was difficult or almost impossible to do with large complex SQL statements. Further human feedback and additional features were used to improve the models over time.

This has removed the barriers to leverage machine learning in their environment, reducing the overall time-to-market required on ingest and prepare data; and build, train, and deploy models to detect anomalous patterns that can impact traders.


The Impact

Databricks has had a very positive impact on FINRA. For one, the development process for new machine learning models has been streamlined with collaborative workspaces for data ingest, model development and training. This allows developers and data scientists to do more experimentation and iteration, resulting in better and more accurate models deployed much more easily into production.

The biggest gains have been from a direct result of the significant reduction in time and resources spent on DevOps work. This has allowed FINRA’s data teams to focus on their areas of expertise without getting bogged down with low-level tasks to support the infrastructure. As a result, they have been able to shift their investments towards solving business problems and away from the necessities of getting data enabled for machine learning.

What’s Next

At FINRA, data is the business! Data is not just a representation of what may happen in securities markets, but it is what actually happens. Moving forward, Databricks will continue to be the cornerstone of FINRA’s analytics strategy — empowering them to use machine learning and advanced analytic techniques to find better and more accurate ways to identify anomalies in data and curb malicious trading behavior.

Learn More

--

Try Databricks for free. Get started today.

The post Protecting the Securities Market with Predictive Fraud Detection appeared first on Databricks.

Enhanced Hyperparameter Tuning and Optimized AWS Storage with Databricks Runtime 5.4 ML

$
0
0

We are excited to announce the release of Databricks Runtime 5.4 ML (Azure | AWS). This release includes two Public Preview features to improve data science productivity, optimized storage in AWS for developing distributed applications, and a number of Python library upgrades.

To get started, you simply select the Databricks Runtime 5.4 ML from the drop-down list when you create a new cluster in Databricks.

Databricks Runtime for Machine Learning, version 5.4

Databricks Runtime for Machine Learning, version 5.4

Public Preview: Distributed Hyperopt + Automated MLflow Tracking

Hyperparameter tuning is a common technique to optimize machine learning models based on hyperparameters, or parameters that are not learned during model training. However, one major challenge with hyperparameter tuning is that it can be both computationally expensive and slow.

Hyperopt is a popular open-source hyperparameter tuning library with strong community support (600,000+ PyPI downloads, 3300+ stars on Github as of May 2019). Data scientists like Hyperopt for its simplicity and effectiveness. Hyperopt offers two tuning algorithms: Random Search and the Bayesian method Tree of Parzen Estimators, which offers improved compute efficiency compared to a brute force approach such as grid search. However, distributing Hyperopt previously did not work out of the box and required manual setup.

In Databricks Runtime 5.4 ML, we introduce an implementation of Hyperopt powered by Apache Spark. Using a new Trials class SparkTrials, you can easily distribute a Hyperopt run without making any changes to the current Hyperopt APIs. You simply need to pass in the SparkTrials class when applying the hyperopt.fmin function (see the example code below). In addition, all tuning experiments, along with the tuned hyperparameters and targeted metrics, are automatically logged to MLflow in Databricks. With this feature, we aim to improve efficiency, scalability, and simplicity when conducting hyperparameter tuning.

This feature is now in Public Preview and we encourage Databricks customers to try it. You can learn more about the feature in the Documentation (Azure | AWS) section.

# New SparkTrials class which distributes tuning

spark_trials = SparkTrials(parallelism=24)

fmin(

 fn=train,             # Method to train and evaluate your model

 space=search_space,   # Defines space of hyperparameters

 algo=tpe.suggest,     # Search algorithm: Tree of Parzen Estimators

 max_evals=8,          # Number of hyperparameter settings to try

 show_progressbar=False,

 trials=spark_trials)

At Databricks, we embrace open source communities and APIs. We are working with the Hyperopt community to contribute this Spark-powered implementation to open source Hyperopt. Stay tuned.

Public Preview: MLlib + Automated MLflow Tracking

Databricks Runtime 5.4 and 5.4 ML supports automatic logging of MLflow runs for models trained using PySpark MLlib tuning algorithms CrossValidator and TrainValidationSplit. Before this feature, if you wanted to track PySpark MLlib cross validation or tuning in MLflow, you would have to make explicit MLflow API calls in Databricks notebooks. With MLflow-MLlib integration, when you tune hyperparameters by running CrossValidator or TrainValidationSplit, parameters and evaluation metrics will be automatically logged to MLflow. You can then review how the tuning affects evaluation metrics in MLflow.

This feature is now in Public Preview. We encourage Databricks users to try it (Azure | AWS).

Default Optimized FUSE Mount on AWS

The Databricks Runtime has a basic FUSE client for DBFS, a local view of a distributed file system installed on Databricks clusters. This feature has been very popular as it allows local access to remote storage. However, the previous implementation did not allow fast enough data access required for developing distributed deep learning applications.

In Databricks Runtime 5.4, Databricks on AWS now offers an optimized FUSE mount by default. You can now have high-performance data access during training and inference without applying init scripts. Data stored under dbfs:/ml and accessible locally at file:/dbfs/ml is now backed by this optimized FUSE mount. If you are running on a Databricks Runtime version prior to 5.4, you can follow our instructions to install a high-performance third-party FUSE client.

We introduced the default optimized FUSE mount for Azure Databricks in Databricks Runtime 5.3. By making it available under the same folder name, we achieved feature parity across Azure and AWS platforms.

In the upcoming months, we plan to enhance the DBFS FUSE client for data scientists who would like flexibility in how they access data.

Display HorovodRunner Training Logs

In the past we introduced HorovodRunner, a simple way to distribute Deep Learning training workloads in Databricks. Databricks Runtime 5.4 ML improves the user experience by displaying HorovodRunner training logs in Databricks Notebook cells. In order to review training logs to better understand optimization progress, you no longer have to look through executor logs under the Spark UI (Azure | AWS). Now, while the HorovodRunner jobs are being executed, training logs will be automatically collected to the driver node and displayed in the notebook cells. You can learn more in our Documentation (Azure | AWS).

Other Library Updates

We updated the following libraries in Databricks Runtime 5.4 ML:

  • Pre-installed XGBoost Python package 0.80.
  • r-base version bumped from 3.5.2 to 3.6.0.
  • We published instructions (Azure | AWS) to install TensorFlow 1.13 and 2.0-alpha to Databricks Runtime ML

Read More

--

Try Databricks for free. Get started today.

The post Enhanced Hyperparameter Tuning and Optimized AWS Storage with Databricks Runtime 5.4 ML appeared first on Databricks.

Announcing the MLflow 1.0 Release

$
0
0

MLflow is an open source platform to help manage the complete machine learning lifecycle. With MLflow, data scientists can track and share experiments locally (on a laptop) or remotely (in the cloud), package and share models across frameworks, and deploy models virtually anywhere.

Today we are excited to announce the release of MLflow 1.0. Since its launch one year ago, MLflow has been deployed at thousands of organizations to manage their production machine learning workloads, and has become generally available on services like Managed MLflow on Databricks. The MLflow community has grown to over 100 contributors, and the MLflow PyPI package download rate has reached close to 600K times a month. The 1.0 release not only marks the maturity and stability of the APIs, but also adds a number of frequently requested features and improvements.

The release is publicly available starting today. Install MLflow 1.0 using PyPl, read our documentation to get started, and provide feedback on GitHub. Below we describe just a few of the new features in MLflow 1.0. Please refer to the release notes for a full list.

What’s New in MLflow 1.0

Support for X Coordinates in the Tracking API

Data scientists and engineers who track metrics during ML training often either want to track summary metrics at the end of a training run, e.g., accuracy, or “streaming metrics” that are produced while the model is training, e.g., loss per mini-batch. Those streaming metrics are often computed for each mini-batch or epoch of training data. To enable accurate logging of these metrics, as well as better visualizations, the log_metric API now supports a step parameter.

mlflow.log_metric(key, value, step=None)

The metric step can be any integer that represents the x coordinate for the metric. For example, if you want to log a metric for each epoch of data, the step would be the epoch number.

The MLflow UI now also supports plotting metrics against provided x coordinate values. In the example below, we show how the UI can be used to visualize two metrics against walltime. Although they were logged at different points in time (as shown by the misalignment of data points in the “relative time” view), the data points relate to the same x coordinates. By switching to the “steps” view you can see the data points from both metrics lined up by their x coordinate values.

Improved Search Features

To improve search functionality, the search filter API now supports a simplified version of the SQL WHERE clause. In addition, it has been enhanced to support searching by run attributes and tags in addition to metrics and parameters. The example below shows a search for runs across all experiments by parameter and tag values.

from mlflow.tracking.client import MlflowClient

all_experiments = [exp.experiment_id for exp in MlflowClient().list_experiments()]

runs = (MlflowClient()
   .search_runs(experiment_ids=all_experiments,
    filter_string="params.model = 'Inception'
     and tags.version='resnet'", run_view_type=ViewType.ALL))

Batched Logging of Metrics

In experiments where you want to log multiple metrics, it is often more convenient and performant to log them as a batch, as opposed to individually. MLflow 1.0 includes a runs/log-batch REST API endpoint for logging multiple metrics, parameters, and tags with a single API request.

You can call this batched-logging endpoint from:

  • Python (`mlflow.log_metrics`, `mlflow.log_params`, `mlflow.set_tags`)
  • R (`mlflow_log_batch`)
  • Java (`MlflowClient.logBatch`)

Support for HDFS as an Artifact Store

In addition to local files, MLflow already supports the following storage systems as artifact stores: Amazon S3, Azure Blob Storage, Google Cloud Storage, SFTP, and NFS. With the MLflow 1.0 release, we add support for HDFS as an artifact store backend. Simply specify a hdfs:// URI with --backend-store-uri:

hdfs://<host>:<port>/<path>

Windows Support for the MLflow Client

MLflow users running on the Windows Operating System can now track experiments with the MLflow 1.0 Windows client.

Building Docker Images for Deployment

One of the most common ways of deploying ML models is to build a docker container. MLflow 1.0 adds a new command to build a docker container whose default entrypoint serves the specified MLflow pyfunc model at port 8080 within the container. For example, you can build a docker container and serve it at port 5001 on the host with these commands:

mlflow models build-docker -m "runs:/some-run-uuid/my-model" 
 -n "my-image-name" docker run -p 5001:8080 "my-image-name"

ONNX Model Flavor

This release adds an experimental ONNX model flavor. To log ONNX models in MLflow format, use the mlflow.onnx.save_model() and mlflow.onnx.log_model() methods. These methods also add the pyfunc flavor to the MLflow Models that they produce, allowing the models to be interpreted as generic Python functions for inference via mlflow.pyfunc.load_pyfunc(). The pyfunc representation of an MLflow ONNX model uses the ONNX Runtime execution engine for evaluation. Finally, you can use the mlflow.onnx.load_model() method to load MLflow Models with the ONNX flavor in native ONNX format.

Other Features and Updates

Note that this major version release includes several breaking changes. Please review the full list of changes and contributions from the community in the 1.0 release notes. We welcome more input on mlflow-users@googlegroups.com or by filing issues or submitting patches on GitHub. For real-time questions about MLflow, we also run a Slack channel for MLflow, and you can follow @MLflow on Twitter.

What’s Next After 1.0

The 1.0 release marks a milestone for the MLflow components that have been widely adopted: Tracking, Models, and Projects. While we continue development on those components, we are also investing in new components to cover more of the ML lifecycle. The next major addition to MLflow will be a Model Registry that allows users to manage their ML model’s lifecycle from experimentation to deployment and monitoring. Watch the recording of the Spark AI Summit Keynote on MLflow for a demo of upcoming features.

Don’t miss our upcoming webinar in which we’ll cover the 1.0 updates and more: Managing the Machine Learning Lifecycle: What’s new with MLflow – on Thursday June 6th.

Finally, join us for the Bay Area MLflow Meetup hosted by Microsoft on Thursday June 20th in Sunnyvale. Sign up here.

Read More

To get started with MLflow on your laptop or on Databricks you can:

  1. Read the quickstart guide
  2. Work through the tutorial
  3. Try Managed MLflow on Databricks

Credits

We want to thank the following contributors for updates, doc changes, and contributions in MLflow 1.0: Aaron Davidson, Alexander Shtuchkin, Anca Sarb, Andrew Chen, Andrew Crozier, Anthony, Christian Clauss, Clemens Mewald, Corey Zumar, Derron Hu, Drew McDonald, Gábor Lipták, Jim Thompson, Kevin Kuo, Kublai-Jing, Luke Zhu, Mani Parkhe, Matei Zaharia, Paul Ogilive, Richard Zang, Sean Owen, Siddharth Murching, Stephanie Bodoff, Sue Ann Hong, Sungjun Kim, Tomas Nykodym, Yahro, Yorick, avflor, eedeleon, freefrag, hchiuzhuo, jason-huling, kafendt, vgod-dbx.

--

Try Databricks for free. Get started today.

The post Announcing the MLflow 1.0 Release appeared first on Databricks.

Hyperparameter Tuning with MLflow, Apache Spark MLlib and Hyperopt

$
0
0

Hyperparameter tuning is a common technique to optimize machine learning models based on hyperparameters, or configurations that are not learned during model training.  Tuning these configurations can dramatically improve model performance. However, hyperparameter tuning can be computationally expensive, slow, and unintuitive even for experts.

Databricks Runtime 5.4 and 5.4 ML (Azure | AWS) introduce new features which help to scale and simplify hyperparameter tuning. These features support tuning for ML in Python, with an emphasis on scalability via Apache Spark and automated tracking via MLflow.

MLflow: tracking tuning workflows

Hyperparameter tuning creates complex workflows involving testing many hyperparameter settings, generating lots of models, and iterating on an ML pipeline.  To simplify tracking and reproducibility for tuning workflows, we use MLflow, an open source platform to help manage the complete machine learning lifecycle.  Learn more about MLflow in the MLflow docs and the recent Spark+AI Summit 2019 talks on MLflow.

Our integrations encourage some best practices for organizing runs and tracking for hyperparameter tuning.  At a high level, we organize runs as follows, matching the structure used by tuning itself:

Tuning MLflow runs MLflow logging
Hyperparameter tuning algorithm Parent run Metadata, e.g., numFolds for CrossValidator
Fit & evaluate model with hyperparameter setting #1 Child run 1 Hyperparameters #1, evaluation metric #1
Fit & evaluate model with hyperparameter setting #2 Child run 2 Hyperparameters #2, evaluation metric #2

To learn more, check out this talk on “Best Practices for Hyperparameter Tuning with MLflow” from the Spark+AI Summit 2019.

Managed MLflow is now generally available on Databricks, and the two integrations we discuss next leverage managed MLflow by default when the MLflow library is installed on the cluster.

Apache Spark MLlib + MLflow integration

Apache Spark MLlib users often tune hyperparameters using MLlib’s built-in tools CrossValidator and TrainValidationSplit.  These use grid search to try out a user-specified set of hyperparameter values; see the Spark docs on tuning for more info.

Databricks Runtime 5.3 and 5.3 ML and above support automatic MLflow tracking for MLlib tuning in Python.

With this feature, PySpark CrossValidator and TrainValidationSplit will automatically log to MLflow, organizing runs in a hierarchy and logging hyperparameters and the evaluation metric.  For example, calling CrossValidator.fit() will log one parent run.  Under this run, CrossValidator will log one child run for each hyperparameter setting, and each of those child runs will include the hyperparameter setting and the evaluation metric.  Comparing these runs in the MLflow UI helps with visualizing the effect of tuning each hyperparameter.

In Databricks Runtime 5.3 and 5.3 ML, automatic tracking is not enabled by default. To turn automatic tracking on, set the Spark Configuration spark.databricks.mlflow.trackMLlib.enabled to “true”.  With the 5.4 releases, automatic tracking is enabled by default.

This feature is now in Public Preview, so we encourage Databricks customers to try it out and send feedback.  Check out the docs (AWS | Azure) to get started!

Distributed Hyperopt + MLflow integration

Hyperopt is a popular open-source hyperparameter tuning library with strong community support (600,000+ PyPI downloads, 3300+ stars on Github as of May 2019). Data scientists use Hyperopt for its simplicity and effectiveness. Hyperopt offers two tuning algorithms: Random Search and the Bayesian method Tree of Parzen Estimators, which offers improved compute efficiency compared to a brute force approach such as grid search. However, distributing Hyperopt previously did not work out of the box and required manual setup.

In Databricks Runtime 5.4 ML, we introduce an implementation of Hyperopt powered by Apache Spark. Using a new Trials class SparkTrials, you can easily distribute a Hyperopt run without making any changes to the current Hyperopt APIs. You simply need to pass in the SparkTrials class when applying the hyperopt.fmin() function (see the example code below). In addition, all tuning experiments, along with their hyperparameters and evaluation metrics, are automatically logged to MLflow in Databricks. With this feature, we aim to improve efficiency, scalability, and simplicity for hyperparameter tuning workflows.

This feature is now in Public Preview, so we encourage Databricks customers to try it out and send feedback.  Check out the docs (Azure | AWS) to get started!

# New SparkTrials class which distributes tuning

spark_trials = SparkTrials(parallelism=24)

fmin(

 fn=train,             # Method to train and evaluate your model

 space=search_space,   # Defines space of hyperparameters

 algo=tpe.suggest,     # Search algorithm: Tree of Parzen Estimators

 max_evals=8,          # Number of hyperparameter settings to try

 show_progressbar=False,

 trials=spark_trials)

The results can be visualized using tools such as parallel coordinates plots.  In the plot below, we can see that the Deep Learning models with the best (lowest) losses were trained using medium to large batch sizes, small to medium learning rates, and a variety of momentum settings.

At Databricks, we embrace open source communities and APIs. We are working with the Hyperopt community to contribute this Spark-powered implementation to open source Hyperopt. Stay tuned.

Get started!

To learn more about hyperparameter tuning in general:

To learn more about MLflow, check out these resources:

To start using these specific features, check out the following doc pages and their embedded example notebooks.  Try them out with the new Databricks Runtime 5.4 ML release.

  • For MLlib use cases, look at the MLlib + Automated MLflow Tracking docs (AWS | Azure).
  • For single-machine Python ML use cases (e.g., scikit-learn, single-machine TensorFlow), look at the Distributed Hyperopt + Automated MLflow Tracking docs (Azure | AWS).
  • For non-MLlib distributed ML use cases (e.g., HorovodRunner), look at MLflow’s examples on adding tracking to Hyperopt and other tools.

--

Try Databricks for free. Get started today.

The post Hyperparameter Tuning with MLflow, Apache Spark MLlib and Hyperopt appeared first on Databricks.

Databricks Connect: Bringing the capabilities of hosted Apache Spark™ to applications and microservices

$
0
0

In this blog post we introduce Databricks Connect, a new library that allows you to leverage native Apache Spark APIs from any Notebook, IDE, or custom application.

Overview

Over the last several years, many custom application connectors have been written for Apache Spark. This includes tools like spark-submit, REST job servers, notebook gateways, and so on. These tools are subject to many limitations, including:

  • They’re not one-size-fits-all: many only work with specific IDEs or notebooks.
  • They may require your application to run hosted inside the Spark cluster.
  • You have to integrate with another set of programming interfaces on top of Spark.
  • Library dependencies cannot be changed without restarting the cluster.

Compare this to how you would connect to a SQL database service, which just involves importing a library and connecting to a server:

import pymysql
conn = pymysql.connect(<connection_conf>)
conn.execute("SELECT date, product FROM sales")

The equivalent for Spark’s structured data APIs would be the following:

from pyspark.sql import SparkSession
spark = SparkSession.builder.config(<connection_conf>).getOrCreate()
spark.table("sales").selectExpr("date", "product").show()

However, prior to Databricks Connect, this above snippet would only work with single-machine Spark clusters — preventing you from easily scaling to multiple machines or to the cloud without extra tools such as spark-submit.

Databricks Connect Client

Databricks Connect completes the Spark connector story by providing a universal Spark client library. This enables you to run Spark jobs from notebook apps (e.g., Jupyter, Zeppelin, CoLab), IDEs (e.g., Eclipse, PyCharm, Intellij, RStudio), and custom Python / Java applications.

What this means is that anywhere you can “import pyspark” or “import org.apache.spark”, you can now seamlessly run large-scale jobs against Databricks clusters. As an example, we show a CoLab notebook executing Spark jobs remotely using Databricks Connect. It is important to notice that there is no application-specific integration here—we just installed the databricks-connect library and imported it. We’re also reading an S3 dataset from GCP, which is possible since the Spark cluster itself is hosted in an AWS region:

Jobs launched from Databricks Connect run remotely on Databricks clusters to leverage their distributed compute, and can be monitored using the Databricks Spark UI:

How Databricks Connect works

To build a universal client library, we had to satisfy the following requirements:

  1. From the application point of view, the client library should behave exactly like full Spark (i.e., you can use SQL, DataFrames, RDDs, and so on).
  2. Heavyweight operations such as physical planning and execution must run on the servers in the cloud. Otherwise, the client could incur a lot of overhead reading data over the wide area network if it isn’t running co-located with the cluster.

To meet these requirements, when the application uses Spark APIs, the Databricks Connect library runs the planning of the job all the way up to the analysis phase. This enables the Databricks Connect library to behave identically to Spark (requirement 1). When the job is ready to be executed, Databricks Connect sends the logical query plan over to the server, where actual physical execution and IO occurs (requirement 2):

Figure 1. Databricks Connect divides the lifetime of Spark jobs into a client phase, which includes up to logical analysis, and server phase, which performs execution on the remote cluster.

The Databricks Connect client is designed to work well across a variety of use cases. It communicates to the server over REST, making authentication and authorization straightforward through platform API tokens. Sessions are isolated between multiple users for secure, high concurrency sharing of clusters. Results are streamed back in an efficient binary format to enable high-performance. The protocol used is stateless, which means that you can easily build fault-tolerant applications and won’t lose work even if the clusters are restarted.

Availability

Databricks Connect enters general availability starting with the DBR 5.4 release, and has support for Python, Scala, Java, and R workloads. You can get it from PyPI for all languages with “pip install databricks-connect”, and documentation is available here.

--

Try Databricks for free. Get started today.

The post Databricks Connect: Bringing the capabilities of hosted Apache Spark™ to applications and microservices appeared first on Databricks.

Detecting Bias with SHAP

$
0
0

StackOverflow’s annual developer survey concluded earlier this year, and they have graciously published the (anonymized) 2019 results for analysis. They’re a rich view into the experience of software developers around the world — what’s their favorite editor? how many years of experience? tabs or spaces? and crucially, salary. Software engineers’ salaries are good, and sometimes both eye-watering and news-worthy.

The tech industry is also painfully aware that it does not always live up to its purported meritocratic ideals. Pay isn’t a pure function of merit, and story after story tells us that factors like name-brand school, age, race, and gender have an effect on outcomes like salary.

Can machine learning do more than predict things? Can it explain salaries and so highlight cases where these factors might be undesirably causing pay differences? This example will sketch how standard models can be augmented with SHAP (SHapley Additive exPlanations) to detect individual instances whose predictions may be concerning, and then dig deeper into the specific reasons the data leads to those predictions.

Model Bias or Data (about) Bias?

While this topic is often characterized as detecting “model bias”, a model is merely a mirror of the data it was trained on. If the model is ‘biased’ then it learned that from the historical facts of the data. Models are not the problem per se; they are an opportunity to analyze data for evidence of bias.

Explaining models isn’t new, and most libraries can assess the relative importance of the inputs to a model. These are aggregate views of inputs’ effects. However, the output of some machine learning models has highly individual effects: is your loan approved? will you receive financial aid? are you a suspicious traveller?

Indeed, StackOverflow offers a handy calculator to estimate one’s expected salary, based on its survey. We can only speculate about how accurate the predictions are overall, but all that a developer particularly cares about is his or her own prospects.

The right question may not be, does the data suggest bias overall? but rather, does the data show individual instances of bias?

Assessing the Survey Data

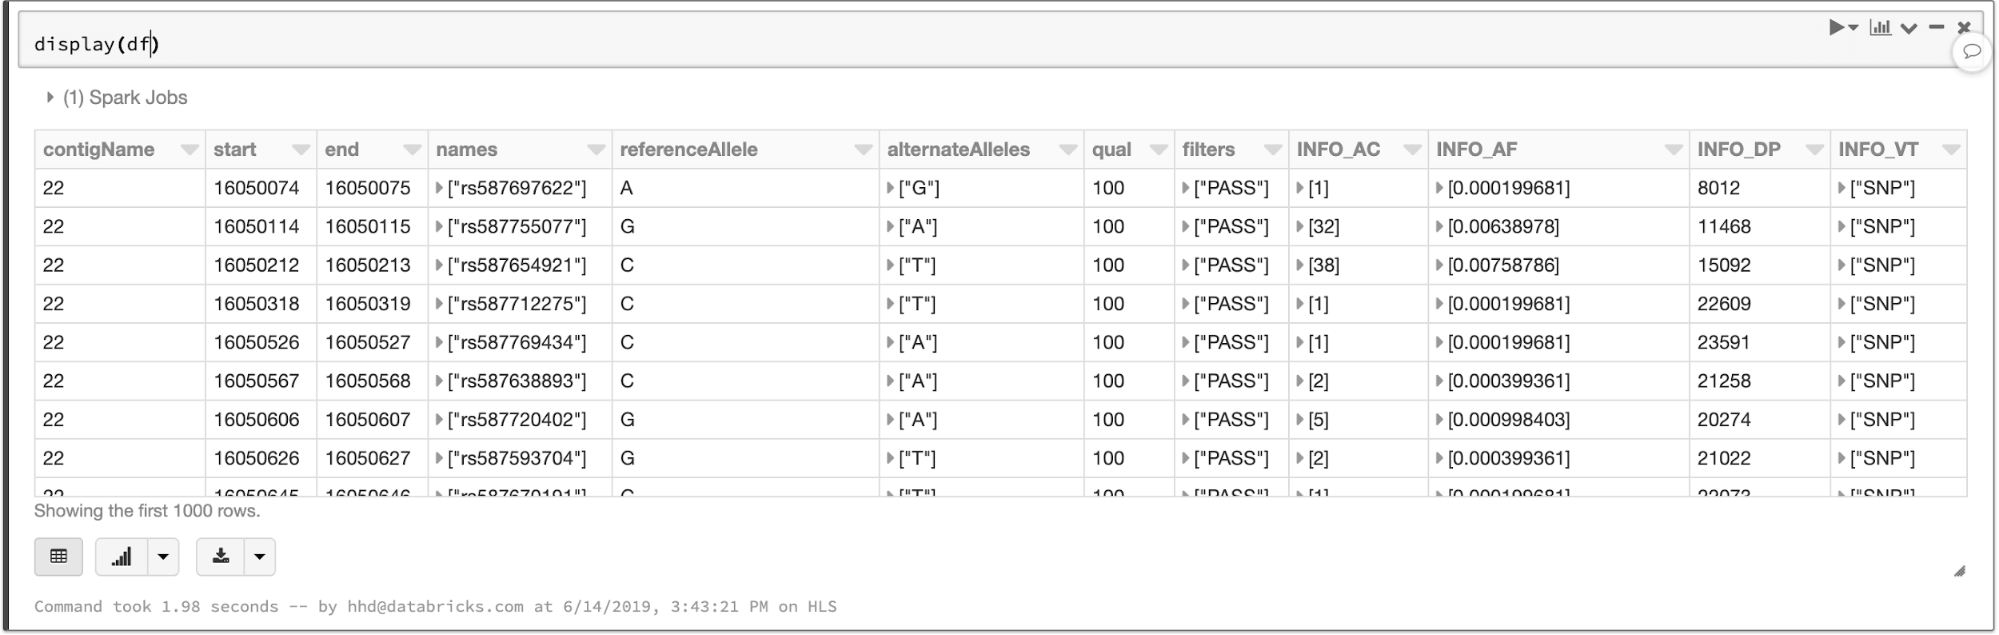
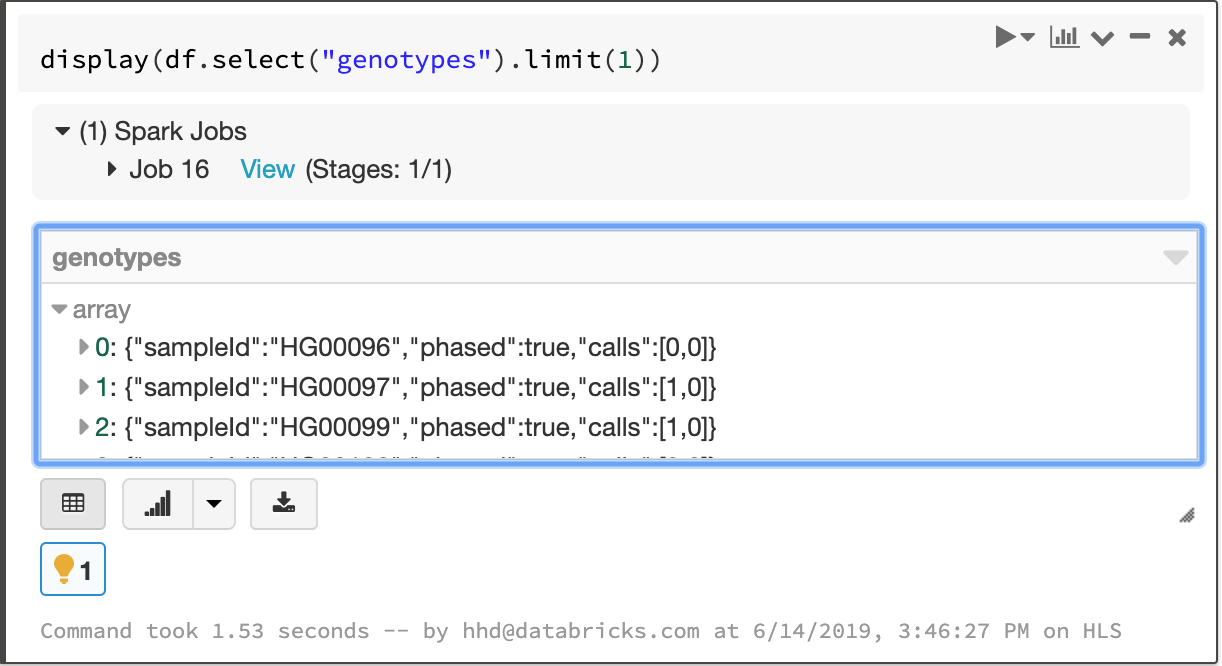
The 2019 data is, thankfully, clean and free of data problems. It contains responses to 85 questions from about 88,000 developers.

This example focuses only on full-time developers. The data set contains plenty of relevant information, like years of experience, education, role, and demographic information. Notably, this data set doesn’t contain information about bonuses and equity, just salary.

It also has responses to wide-ranging questions about attitudes on blockchain, fizz buzz, and the survey itself. These are excluded here as unlikely to reflect the experience and skills that presumably should determine compensation. Likewise, for simplicity, it will also only focus on US-based developers.

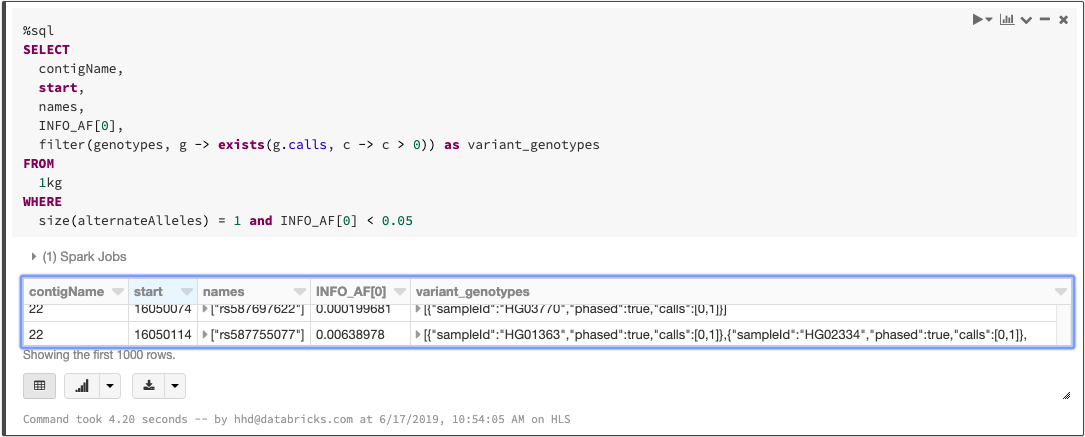
The data needs a little more transformation before modeling. Several questions allow multiple responses, like “What are your greatest challenges to productivity as a developer?” These single questions yield multiple yes/no responses and need to be broken out into multiple yes/no features.

Some multiple-choice questions like “Approximately how many people are employed by the company or organization you work for?” afford responses like “2-9 employees”. These are effectively binned continuous values, and it may be useful to map them back to inferred continuous values like “2” so that the model may consider their order and relative magnitude. This translation is unfortunately manual and entails some judgment calls.

The Apache Spark code that can accomplish this is in the accompanying notebook, for the interested.

Model Selection with Apache Spark

With the data in a more machine-learning-friendly form, the next step is to fit a regression model that predicts salary from these features. The data set itself, after filtering and transformation with Spark, is a mere 4MB, containing 206 features from about 12,600 developers, and could easily fit in memory as a pandas DataFrame on your wristwatch, let alone a server.

xgboost, a popular gradient-boosted trees package, can fit a model to this data in minutes on a single machine, without Spark. xgboost offers many tunable “hyperparameters” that affect the quality of the model: maximum depth, learning rate, regularization, and so on. Rather than guess, simple standard practice is to try lots of settings of these values and pick the combination that results in the most accurate model.

Fortunately, this is where Spark comes back in. It can build hundreds of these models in parallel and collect the results of each. Because the data set is small, it’s simple to broadcast it to the workers, create a bunch of combinations of those hyperparameters to try, and use Spark to apply the same simple non-distributed xgboost code that could build a model locally to the data with each combination.

...
def train_model(params):
  (max_depth, learning_rate, reg_alpha, reg_lambda, gamma, min_child_weight) = params  
  xgb_regressor = XGBRegressor(objective='reg:squarederror', max_depth=max_depth,\
    learning_rate=learning_rate, reg_alpha=reg_alpha, reg_lambda=reg_lambda, gamma=gamma,\
    min_child_weight=min_child_weight, n_estimators=3000, base_score=base_score,\
    importance_type='total_gain', random_state=0)
  xgb_model = xgb_regressor.fit(b_X_train.value, b_y_train.value,\
    eval_set=[(b_X_test.value, b_y_test.value)],\
                                eval_metric='rmse', early_stopping_rounds=30)
  n_estimators = len(xgb_model.evals_result()['validation_0']['rmse'])
  y_pred = xgb_model.predict(b_X_test.value)
  mae = mean_absolute_error(y_pred, b_y_test.value)
  rmse = sqrt(mean_squared_error(y_pred, b_y_test.value))
  return (params + (n_estimators,), (mae, rmse), xgb_model)

...

max_depth =        np.unique(np.geomspace(3, 7, num=5, dtype=np.int32)).tolist()
learning_rate =    np.unique(np.around(np.geomspace(0.01, 0.1, num=5), decimals=3)).tolist()
reg_alpha =        [0] + np.unique(np.around(np.geomspace(1, 50, num=5), decimals=3)).tolist()
reg_lambda =       [0] + np.unique(np.around(np.geomspace(1, 50, num=5), decimals=3)).tolist()
gamma =            np.unique(np.around(np.geomspace(5, 20, num=5), decimals=3)).tolist()
min_child_weight = np.unique(np.geomspace(5, 30, num=5, dtype=np.int32)).tolist()

parallelism = 128
param_grid = [(choice(max_depth), choice(learning_rate), choice(reg_alpha),\
  choice(reg_lambda), choice(gamma), choice(min_child_weight)) for _ in range(parallelism)]

params_evals_models = sc.parallelize(param_grid, parallelism).map(train_model).collect()

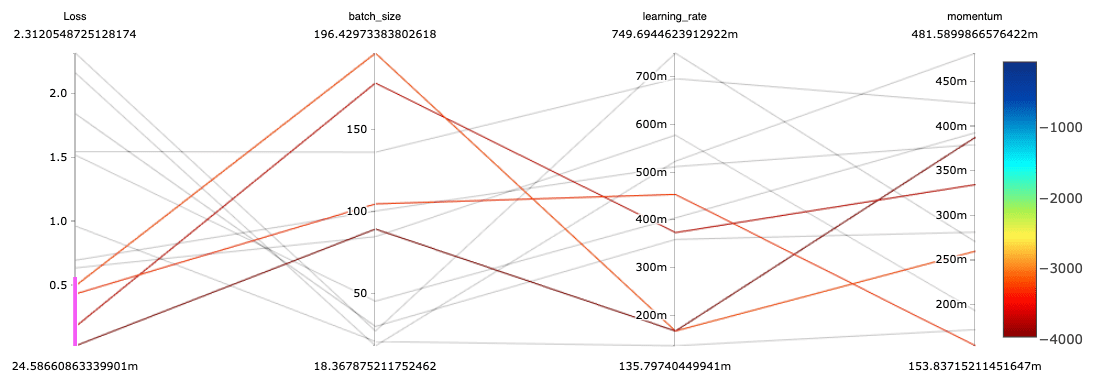
That will create a lot of models. To track and evaluate the results, mlflow can log each one with its metrics and hyperparameters, and view them in the notebook’s Experiment. Here, one hyperparameter over many runs is compared to the resulting accuracy (mean absolute error):

The single model that showed the lowest error on the held-out validation data set is of interest. It yielded a mean absolute error of about $28,000 on salaries that average about $119,000. Not terrible, although we should realize the model can only explain most of the variation in salary.

Interpreting the xgboost Model

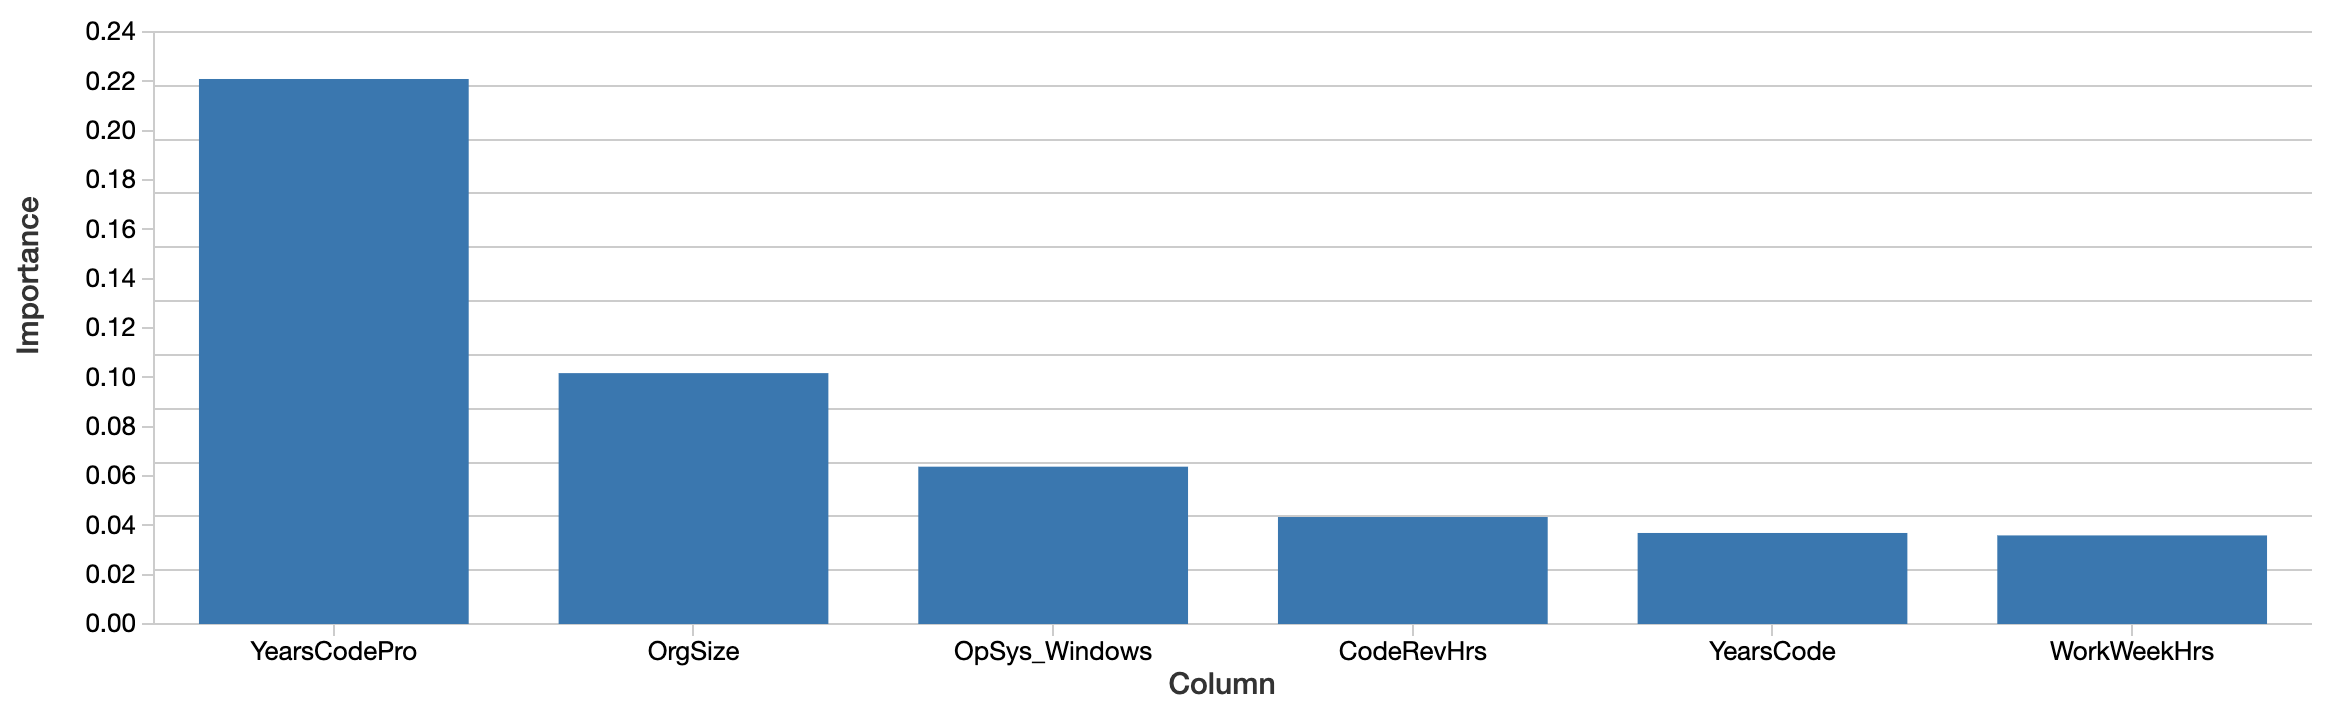
Although the model can be used to predict future salaries, instead, the question is what the model says about the data. What features seem to matter most when predicting salary accurately? The xgboost model itself computes a notion of feature importance:

import mlflow.sklearn
best_run_id = "..."
model = mlflow.sklearn.load_model("runs:/" + best_run_id + "/xgboost")
sorted((zip(model.feature_importances_, X.columns)), reverse=True)[:6]

Factors like years of coding professionally, organization size, and using Windows are most “important”. This is interesting, but hard to interpret. The values reflect relative and not absolute importance. That is, the effect isn’t measured in dollars. The definition of importance here (total gain) is also specific to how decision trees are built and are hard to map to an intuitive interpretation. The important features don’t even necessarily correlate positively with salary, either.

More importantly, this is a ‘global’ view of how much features matter in aggregate. Factors like gender and ethnicity don’t show up on this list until farther along. This doesn’t mean these factors aren’t still significant. For one, features can be correlated, or interact. It’s possible that factors like gender correlate with other features that the trees selected instead, and this to some degree masks their effect.

The more interesting question is not so much whether these factors matter overall — it’s possible that their average effect is relatively small — but, whether they have a significant effect in some individual cases. These are the instances where the model is telling us something important about individuals’ experience, and to those individuals, that experience is what matters.

Applying SHAP for Developer-Level Explanations

Fortunately, a set of techniques for more theoretically sound model interpretation at the individual prediction level has emerged over the past five years or so. They are collectively “Shapley Additive Explanations”, and conveniently, are implemented in the Python package shap.

Given any model, this library computes “SHAP values” from the model. These values are readily interpretable, as each value is a feature’s effect on the prediction, in its units. A SHAP value of 1000 here means “explained +$1,000 of predicted salary”. SHAP values are computed in a way that attempts to isolate away of correlation and interaction, as well.

import shap
explainer = shap.TreeExplainer(model)
shap_values = explainer.shap_values(X, y=y.values)

SHAP values are also computed for every input, not the model as a whole, so these explanations are available for each input individually. It can also estimate the effect of feature interactions separately from the main effect of each feature, for each prediction.

Explaining the Features’ Effects Overall

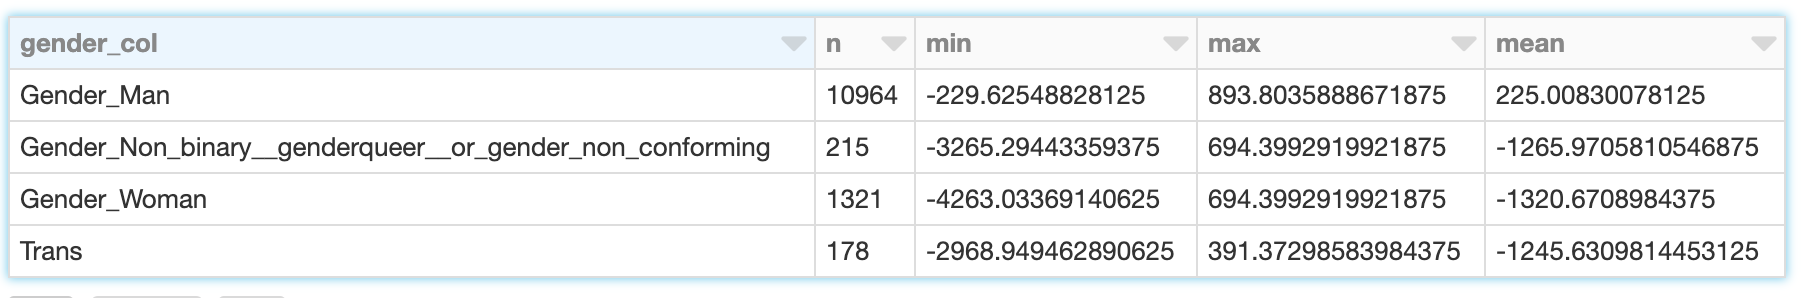
Developer-level explanations can aggregate into explanations of the features’ effects on salary over the whole data set by simply averaging their absolute values. SHAP’s assessment of the overall most important features is similar:

The SHAP values tell a similar story. First, SHAP is able to quantify the effect on salary in dollars, which greatly improves the interpretation of the results. Above is a plot the absolute effect of each feature on predicted salary, averaged across developers. Years of professional coding experience still dominates, explaining on average almost $15,000 of effect on salary.

Examining the Effects of Gender with SHAP Values

We came to look specifically at the effects of gender, race, and other factors that presumably should not be predictive per se of salary at all. This example will examine the effect of gender, though this by no means suggests that it’s the only or most important, type of bias to look for.

Gender is not binary, and the survey recognizes responses of “Man”, “Woman”, and “Non-binary, genderqueer, or gender non-conforming” as well as “Trans” separately. (Note that while the survey also separately records responses about sexuality, these are not considered here.) SHAP computes the effect on predicted salary for each of these. For a male developer (identifying only as male), the effect of gender is not just the effect of being male, but of not identifying as female, transgender, and so on.

SHAP values let us read off the sum of these effects for developers identifying as each of the four categories:

While male developers’ gender explains about a modest -$230 to +$890 with mean about $225, for females, the range is wider, from about -$4,260 to -$690 with mean -$1,320. The results for transgender and non-binary developers is similar, though slightly less negative.

When evaluating what this means below, it’s important to recall the limitations of the data and model here:

  • Correlation isn’t causation; ‘explaining’ predicted salary is suggestive, but doesn’t prove, that a feature directly caused salary to be higher or lower
  • The model isn’t perfectly accurate
  • This is just 1 year of data, and only from US developers
  • This reflects only base salary, not bonuses or stock, which can vary more widely

Gender and Interacting Features

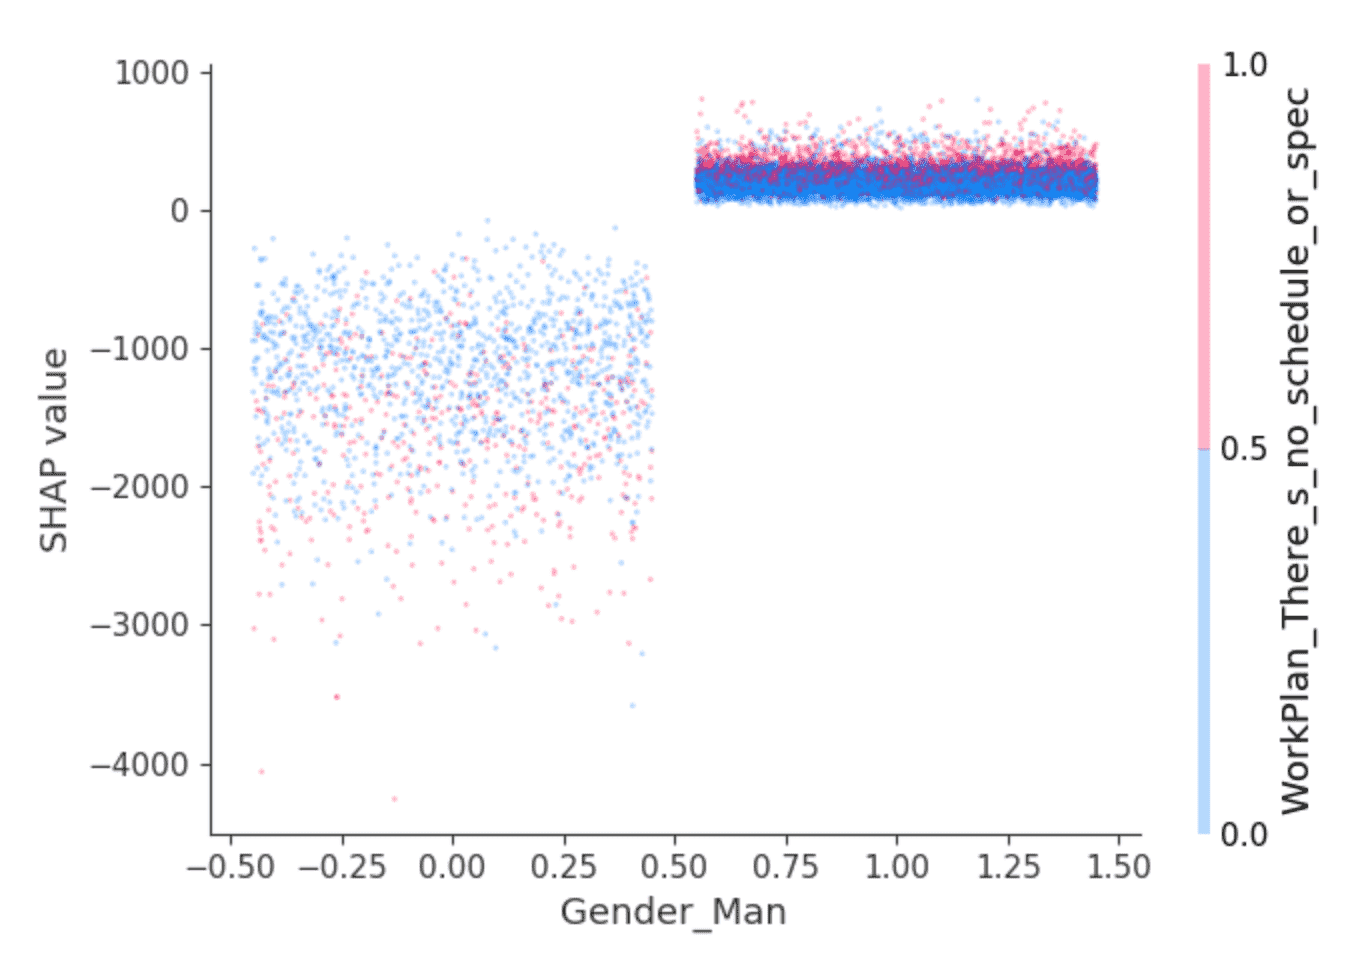
The SHAP library offers interesting visualizations that leverage its ability to isolate the effect of feature interactions. For example, the values above suggest that developers who identify as male are predicted to earn a slightly higher salary than others, but is there more to it? A dependence plot like this one can help:

Dots are developers. Developers at the left are those that don’t identify as male, and at the right, those that do, which are predominantly those identifying as only male. (The points are randomly spread horizontally for clarity.) The y-axis is SHAP value, or what identifying as male or not explains about predicted salary for each developer. As above, those not identifying as male show overall negative SHAP values, and one that varies widely, while others consistently show a small positive SHAP value.

What’s behind that variance? SHAP can select a second feature whose effect varies most given the value of, here, identifying as male or not.  It selects the answer “I work on what seems most important or urgent” to the question “How structured or planned is your work?”  Among developers identifying as male, those who answered this way (red points) appear to have slightly higher SHAP values. Among the rest, the effect is more mixed but seems to have generally lower SHAP values.

Interpretation is left to the reader, but perhaps: are male developers who feel empowered in this sense also enjoying slightly higher salaries, while other developers enjoy this where it goes hand in hand with lower-paying roles?

Exploring Instances with Outsized Gender Effects

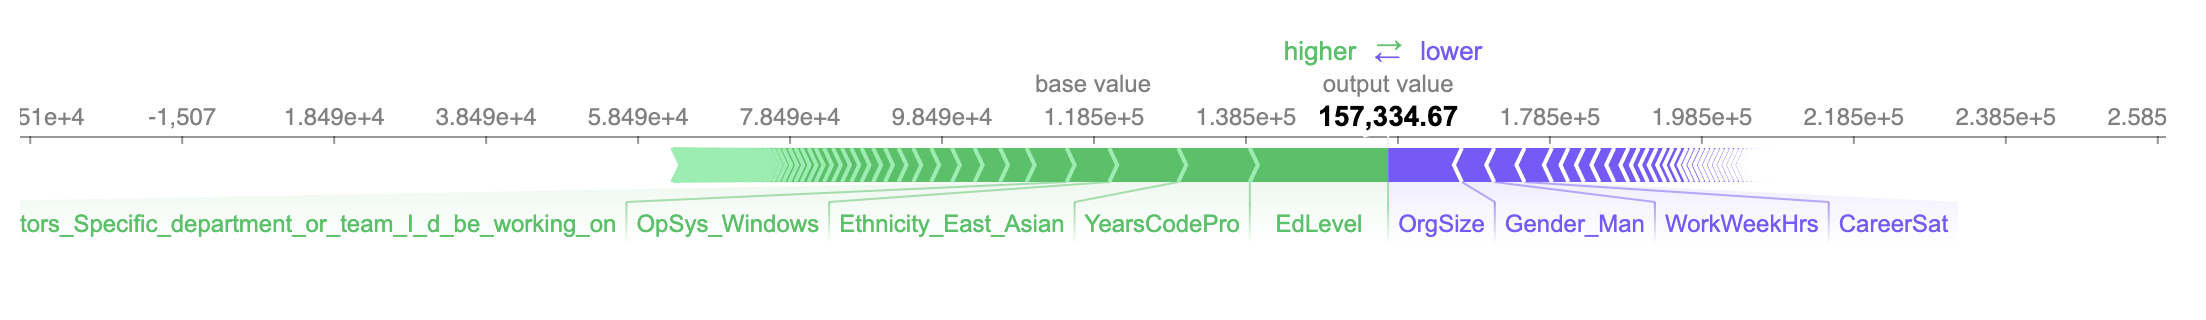
What about investigating the developer whose salary is most negatively affected? Just as it’s possible to look at the effect of gender-related features overall, it’s possible to search for the developer whose gender-related features had the largest impact on predicted salary. This person is female, and the effect is negative. According to the model, she is predicted to earn about $4,260 less per year because of her gender:

The predicted salary, just over $157,000, accurate in this case, as her actual reported salary is $150,000.

The three most positive and negative features influencing predicted salary are that she:

  • Has a college degree (only) (+$18,200)
  • Has 10 years professional experience (+$9,400)
  • Identifies as East Asian (+$9,100)
  • Works 40 hours per week (-$4,000)
  • Does not identify as male (-$4,250)
  • Works at a medium-sized org of 100-499 employees (-$9,700)

Given the magnitude of the effect on the predicted salary of not identifying as male, we might stop here and investigate the details of this case offline to gain a better understanding of the context around this developer and whether her experience, or salary, or both, need a change.

Explaining Interactions

There is more detail available within that -$4,260. SHAP can break down the effects of these features into interactions. The total effect of identifying as female on the prediction can be broken down into the effect of identifying as female and being an engineering manager, and working with Windows, etc.

The effect on predicted salary explained by the gender factors per se only adds up to about -$630. Rather, SHAP assigns most of the effects of gender to interactions with other features:

gender_interactions = interaction_values[gender_feature_locs].sum(axis=0)
max_c = np.argmax(gender_interactions)
min_c = np.argmin(gender_interactions)
print(X.columns[max_c])
print(gender_interactions[max_c])
print(X.columns[min_c])
print(gender_interactions[min_c])

DatabaseWorkedWith_PostgreSQL
110.64005
Ethnicity_East_Asian
-1372.6714

Identifying as female and working with PostgreSQL affects predicted salary slightly positively, whereas also identifying as East Asian predicted salary more negatively. Interpreting these values at this level of granularity is difficult in this context, but, this additional level of explanation is available.

Applying SHAP with Apache Spark

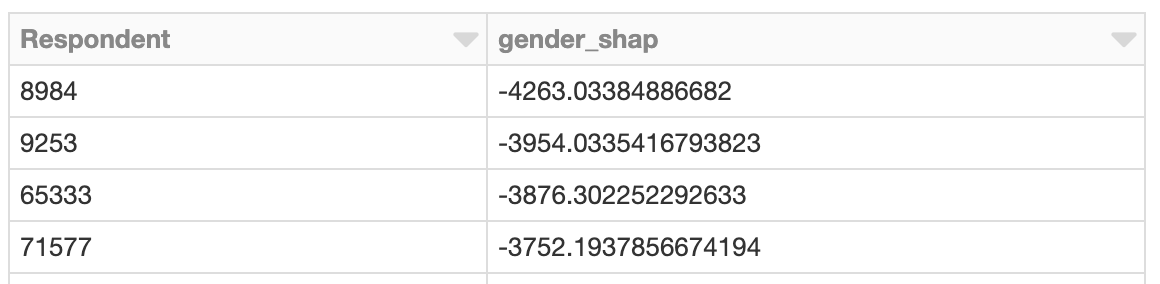
SHAP values are computed independently for each row, given the model, and so this could have also been done in parallel with Spark. The following example computes SHAP values in parallel and similarly locates developers with outsized gender-related SHAP values:

X_df = pruned_parsed_df.drop("ConvertedComp").repartition(16)
X_columns = X_df.columns

def add_shap(rows):
  rows_pd = pd.DataFrame(rows, columns=X_columns)
  shap_values = explainer.shap_values(rows_pd.drop(["Respondent"], axis=1))
  return [Row(*([int(rows_pd["Respondent"][i])] + [float(f) for f in shap_values[i]])) for i in range(len(shap_values))]

shap_df = X_df.rdd.mapPartitions(add_shap).toDF(X_columns)

effects_df = shap_df.\
  withColumn("gender_shap", col("Gender_Woman") + col("Gender_Man") + col("Gender_Non_binary__genderqueer__or_gender_non_conforming") + col("Trans")).\
  select("Respondent", "gender_shap")
top_effects_df = effects_df.filter(abs(col("gender_shap")) >= 2500).orderBy("gender_shap")

Clustering SHAP values

Applying Spark is advantageous when there are a large number of predictions to assess with SHAP. Given that output, it’s also possible to use Spark to cluster the results with, for example, bisecting k-means:

assembler = VectorAssembler(inputCols=[c for c in to_review_df.columns if c != "Respondent"],\
  outputCol="features")
assembled_df = assembler.transform(shap_df).cache()

clusterer = BisectingKMeans().setFeaturesCol("features").setK(50).setMaxIter(50).setSeed(0)
cluster_model = clusterer.fit(assembled_df)
transformed_df = cluster_model.transform(assembled_df).select("Respondent", "prediction")

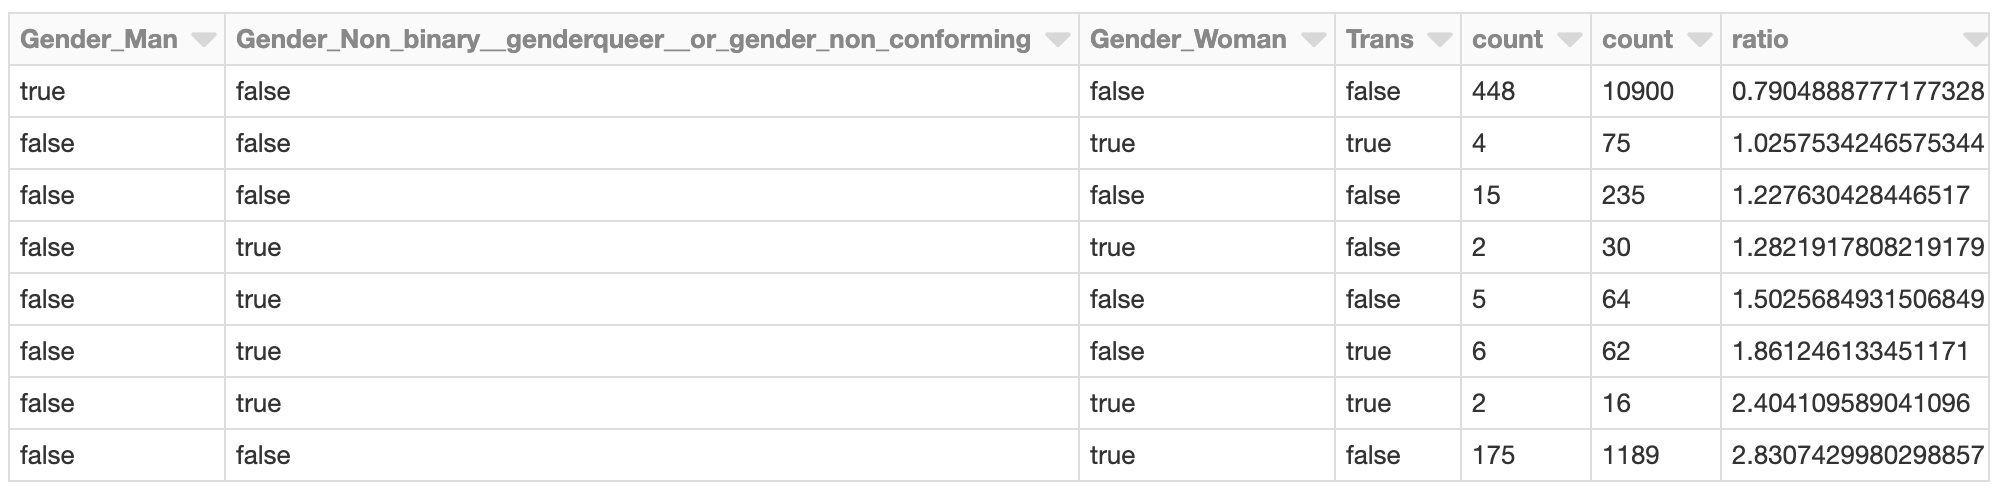
The cluster whose total gender-related SHAP effects are most negative might bear some further investigation. What are the SHAP values of those respondents in the cluster? What do the members of the cluster look like with respect to the overall developer population?

min_shap_cluster_df = transformed_df.filter("prediction = 5").\
  join(effects_df, "Respondent").\
  join(X_df, "Respondent").\
  select(gender_cols).groupBy(gender_cols).count().orderBy(gender_cols)
all_shap_df = X_df.select(gender_cols).groupBy(gender_cols).count().orderBy(gender_cols)
expected_ratio = transformed_df.filter("prediction = 5").count() / X_df.count()
display(min_shap_cluster_df.join(all_shap_df, on=gender_cols).\
  withColumn("ratio", (min_shap_cluster_df["count"] / all_shap_df["count"]) / expected_ratio).\
  orderBy("ratio"))

Developers identifying as female (only) are represented in this cluster at almost 2.8x the rate of the overall developer population, for example. This isn’t surprising given the earlier analysis. This cluster could be further investigated to assess other factors specific to this group that contribute to overall lower predicted salary.

Conclusion

This type of analysis with SHAP can be run for any model, and at scale too. As an analytical tool, it turns models into data detectives, to surface individual instances whose predictions suggest that they deserve more examination. The output of SHAP is easily interpretable and yields intuitive plots, that can be assessed case-by-case by business users.

Of course, this analysis isn’t limited to examining questions of gender, age or race bias. More prosaically, it could be applied to customer churn models. There, the question is not just “will this customer churn?” but “why is the customer churning?” A customer who is canceling due to price may be offered a discount, while one canceling due to limited usage might need an upsell.

Finally, this analysis can be run as part of a model validation process. Model validation often focuses on the overall accuracy of a model. It should also focus on the model’s ‘reasoning’, or what features contributed most to the predictions. With SHAP, it can also help detect when too many individual predictions’ explanations are at odds with overall feature importance.

--

Try Databricks for free. Get started today.

The post Detecting Bias with SHAP appeared first on Databricks.

Simplifying Streaming Stock Analysis using Delta Lake and Apache Spark: On-Demand Webinar and FAQ Now Available!

$
0
0

On June 13th, we hosted a live webinar — Simplifying Streaming Stock Analysis using Delta Lake and Apache Spark — with Junta Nakai, Industry Leader – Financial Services at Databricks, John O’Dwyer, Solution Architect at Databricks, and Denny Lee, Technical Product Marketing Manager at Databricks. This is the first webinar in a series of financial services webinars from Databricks and is an extension of the blog post Simplify Streaming Stock Data Analysis Using Delta Lake.

Analyzing trading and stock data? Traditionally, real-time analysis of stock data was a complicated endeavor due to the complexities of maintaining a streaming system and ensuring transactional consistency of legacy and streaming data concurrently. Delta Lake helps solve many of the pain points of building a streaming system to analyze stock data in real-time.

In this webinar, we will review:

  • The current problems of running such a system.
  • How Delta Lake addresses these problems.
  • How to implement the system in Databricks.

Delta Lake helps solve these problems by combining the scalability, streaming, and access to advanced analytics of Apache Spark with the performance and ACID compliance of a data warehouse.

During the webinar, we showcased Streaming Stock Analysis with a Delta Lake notebook.  To run it yourself, please download the following notebooks:

We also showcase the update of data in real-time with streaming and batch stock analysis data joined together as noted in the following image.

Toward the end, we also held a Q&A, and below are the questions and their answers.


Q: What is the difference between Delta Lake and Apache Parquet?

Delta Lake is an open-source storage layer that brings ACID transactions to Apache Spark™ and big data workloads.  While the Delta Lake stores data in Apache Parquet format, it includes features that allow data lakes to be reliable at scale.   These features include:

  • ACID Transactions: Delta Lake ensures data integrity and provides serializability.
  • Scalable Metadata Handling: For Big Data systems,  the metadata itself is often “big”  enough to slow down any system that tries to make sense of it, let alone making sense of the actual underlying data.  Delta Lake treats metadata like regular data and leverages Apache Spark’s distributed processing power. As a result, Delta Lake can handle petabyte-scale tables with billions of partitions and files at ease.
  • Time Travel (data versioning): Creates snapshots of data, allowing you to access and revert to earlier versions of data for audits, rollbacks or to reproduce experiments.
  • Open Format: All data in Delta Lake is stored in Apache Parquet format enabling Delta Lake to leverage the efficient compression and encoding schemes that are native to Parquet.
  • Unified Batch and Streaming Source and Sink: A table in Delta Lake is both a batch table, as well as a streaming source and sink. Streaming data ingest, batch historic backfill, and interactive queries all just work out of the box.
  • Schema Enforcement: Delta Lake provides the ability to specify your schema and enforce it. This helps ensure that the data types are correct and required columns are present, preventing bad data from causing data corruption.
  • Schema Evolution: Big data is continuously changing. Delta Lake enables you to make changes to a table schema that can be applied automatically, without the need for cumbersome DDL.
  • 100% Compatible with Apache Spark API: Developers can use Delta Lake with their existing data pipelines with minimal change as it is fully compatible with Spark, the commonly used big data processing engine.


Q: How can you view the Delta Lake table for both streaming and batch near the beginning of the notebook?

As noted in the Streaming Stock Analysis with Delta Lake notebook, in cell 8 we ran the following batch query:

dfPrice = spark.read.format("delta").load(deltaPricePath)
display(dfPrice.where(dfPrice.ticker.isin({'JO1', 'JN2'})))

Notice that we ran this query earlier in the cycle with data up until August 20th, 2012.  Using the same folder path (deltaPricePath), we also created a structured streaming DataFrame via the following code snippet in cell 4:

# Create Stream and Temp View for Price
dfPriceStream = spark.readStream.format("delta").load(deltaPricePath)
dfPriceStream.createOrReplaceTempView("priceStream")

We can then run the following real-time Spark SQL query that will continuously refresh.

%sql
SELECT *
FROM priceStream
where ticker in ('JO1', 'JN2')

Notice that, even though the batch query executed earlier (and ended at August 20th, 2012), the structured streaming query continued to process data long past that date (the small blue dot denotes where August 20th, 2012 is on the streaming line chart).    As you can see from the preceding code snippets, both the batch and structured streaming DataFrames query off of the same folder path of deltaPricePath.


Q: With the “mistake” that you had entered into the data, can I go back and find it and possibly correct it for auditing purposes?  

Delta Lake has a data versioning feature called Time Travel.  It provides snapshots of data, allowing you to access and revert to earlier versions of data for audits, rollbacks or to reproduce experiments.  To visualize this, note cells 36 onwards in the Streaming Stock Analysis with Delta Lake notebook.   The following screenshot shows three different queries using the VERSION AS OF syntax allowing you to view your data by version (or by timestamp using the TIMESTAMP syntax).

With this capability, you can know what changes to your data were made and when those transactions had occurred.


Q: I saw that the stock streaming data update was accomplished via a view; I wonder if updates can be done on actual data files themselves. For instance, do we need to refresh the whole partition parquet files to achieve updates? What is the solution under Delta Lake?

While the changes were done to a Spark SQL view, the changes are actually happening to the underlying files on storage.  Delta Lake itself determines which Parquet files need to be updated to reflect the new changes.

Q: Can we query Delta Lake Tables in Apache Hive

Currently (as of version 0.1.0) it is not possible to query Delta Lake tables with Apache Hive nor is the Hive metastore supported (though this feature is on the roadmap).  For the latest on this particular issue, please refer to the GitHub issue #18.

Q: Is there any guide that covers detailed usage of Delta Lake?

For the latest guidance on Delta Lake, please refer to the delta.io as well as the Delta Lake documentation.  Join the Delta Lake Community to communicate with fellow Delta Lake users and contributors through our Slack channel or Google Groups.

Additional Resources

--

Try Databricks for free. Get started today.

The post Simplifying Streaming Stock Analysis using Delta Lake and Apache Spark: On-Demand Webinar and FAQ Now Available! appeared first on Databricks.


Accurately Building Genomic Cohorts at Scale with Delta Lake and Spark SQL

$
0
0

This is the second post in our “Genomic Analysis at Scale”  series.  In our first postwe explored a simple problem: how to provide real-time aggregates when sequencing large volumes of genomes. We solved this problem by using Delta Lake and a streaming pipeline built using Spark SQL. In this blog, we focus on the more advanced process of joint genotyping, which involves merging variant calls from many individuals into a single view of a population. This is one of the most common and complex problems in genomics.


At Databricks we have leveraged innovations in distributed computation, storage, and cloud infrastructure and applied them to genomics to help solve problems that have hindered the ability for organizations to perform joint-genotyping, the “N + 1” problem, and the challenge of scaling to population-level cohorts. Our Unified Analytics Platform for Genomics provides an optimized pipeline that scales to massive clusters and thousands of samples with a single click. In this blog, we explore how to apply those innovations to joint genotyping.

Before we dive into joint genotyping, first let’s discuss why people do large scale sequencing. Most people are familiar with the genetic data produced by 23andMe or AncestryDNA. These tests use genotyping arrays, which read a fixed number of variants in the genome, typically ~1,000,000 well-known variants which occur commonly in the normal human population. With sequencing, we get an unbiased picture of all the variants an individual has, whether they are variants we’ve seen many times before in healthy humans or variants that we’ve never seen before that contribute to or protect against diseases. Figure 1 demonstrates the difference between these two approaches.


Figure 1: This diagram illustrates the difference between variation data produced by genotype arrays (left) and by sequencing (middle) followed by joint genotyping (right). Genotyping arrays are restricted to “read” a fixed number of known variants, but guarantee a genotype for every sample at every variant. In sequencing, we are able to discover variants that are so rare that they only exist in a single individual, but determining if a novel variant is truly unique in this person or just hard to detect with current technology is a non-trivial problem.

While sequencing provides much higher resolution, we encounter a problem when trying to examine the effect of a genetic variant across many patients. Since a genotyping array measures the same variants across all samples, looking across many individuals is a straightforward proposition: all variants have been measured across all individuals. When working with sequencing data, we have a trickier proposition: if we saw a variant in patient 1, but didn’t see that variant in patient 2, what does that tell us? Did patient 2 not have an allele of that variant? Alternatively, when we sequenced patient 2, did an error occur that caused the sequencer to not read the variant we are interested in?

Joint genotyping addresses this problem in three separate ways:

  1. Combining evidence from multiple samples enables us to rescue variants which do not meet strict statistical significance to be detected accurately in a single sample
  2. As the accuracy of your predictions at each site in the human genome increases, you are better able to model sequencing errors and filter spurious variants
  3. Joint genotyping provides a common variant representation across all samples that simplifies asking whether a variant in individual X is also present in individual Y

Accurately Identifying Genetic Variants at Scale with Joint Genotyping

Joint genotyping works by pooling data together from all of the individuals in our study when computing the likelihood for each individual’s genotype. This provides us a uniform representation of how many copies of each variant are present in each individual, a key stepping stone for looking at the link between a genetic variant and disease. When we compute these new likelihoods, we are also able to compute a prior probability distribution for a given variant appearing in a population, which we can use to disambiguate borderline variant calls.

For a more concrete example, table 1 shows the precision and recall statistics for indel (insertions/deletions) and single-nucleotide variants (SNVs) for the sample HG002 called via the GATK variant calling pipeline compared to the Genome-in-a-Bottle (GIAB) high-confidence variant calls in high-confidence regions.

Table 1: Variant calling accuracy for HG002, processed as a single sample

Recall Precision
Indel 96.25% 98.32%
SNV 99.72% 99.40%

As a contrast, table 2 shows improvement for indel precision and recall and SNV recall when we jointly call variants across HG002 and two relatives (HG003 and HG004). The halving of this error rate is significant, especially for clinical applications.

Table 2: Variant calling accuracy for HG002 following joint genotyping with HG003 and HG004

Recall Precision
Indel 98.21% 98.98%
SNV 99.78% 99.34%

Originally, joint genotyping was performed directly from the raw sequencing data for all individuals, but as studies have grown to petabytes in size, this approach has become impractical. Modern approaches start from a genome variant call file (gVCF), a tab-delimited file containing all variants seen in a single sample, and information about the quality of the sequencing data at every position where no variant was seen. While the gVCF-based approach touches less data than looking at the sequences, a moderately sized project can still have tens of terabytes of gVCF data. This gVCF-based approach eliminates the need to go back to the raw reads but still requires all N+1 gVCFs to be reprocessed when jointly calling variants with a new sample added to the cohort. Our approach uses Delta Lakes to enable incrementally squaring-off the N+1 samples in the cohort, while parallelizing regenotyping using Apache SparkTM.

Challenges Calling Variants at a Population level

Despite the importance of joint variant calling, bioinformatics teams often defer this step because the existing infrastructure around GATK4 makes these workloads hard to run and even harder to scale. The default implementation of the GATK4’s joint genotyping algorithm is single threaded, and scaling this implementation relies on manually parallelizing the joint genotyping kernel using a workflow language and runners like WDL and Cromwell. While GATK4 has support for a Spark-based HaplotypeCaller, it does not support running GenotypeGVCFs parallelized using Spark. Additionally, for scalability, the GATK4 best practice joint genotyping workflow relies on storing data in GenomicsDB. Unfortunately, GenomicsDB has limited support for cloud storage systems like AWS S3 or Azure Blob Storage, and studies have demonstrated that the new GenomicsDB workflow is slower than the old CombineGVCFs/GenotypeGVCFs workflow on some large datasets.

Our Solution

The Unified Analytics Platform for Genomics’ Joint Genotyping Pipeline (Azure | AWS) provides a solution for these common needs. Figure 2 shows the computational architecture of the joint genotyping pipeline. This pipeline is provided as a notebook (Azure | AWS) that can be called as a Databricks job, the joint variant calling pipeline is simple to run: the user simply needs to provide their input files and output directory. When the pipeline runs, it starts by appending the input gVCF data via our VCF reader (Azure | AWS) to Delta Lake. Delta Lake provides inexpensive incremental updates, which makes it cheap to add an N+1th sample into an existing cohort. When the pipeline runs, it uses Spark SQL to bin the variant calls. The joint variant calling algorithm then runs in parallel over each bin, scaling linearly with the number of variants.

Figure 2: The computational flow of the Databricks joint genotyping pipeline. In stage 1, the gVCF data is ingested into a Delta Lake columnar store in a scheme partitioned by a genomic bin. This Delta Lake table can be incrementally updated as new samples arrive. In stage 2, we then load the variants and reference models from the Delta Lake tables and directly run the core re-genotyping algorithm from the GATK4’s GenotypeGVCFs tool. The final squared off genotype matrix is saved to Delta Lake by default, but can also be written out as VCF.

The parallel joint variant calling step is implemented through Spark SQL, using a similar architecture to our DNASeq and TNSeq pipelines. Specifically, we bin all of the input genotypes/reference models from the gVCF files into contiguous regions of the reference genome. Within each bin, we then sort the data by reference position and sample ID. We then directly invoke the joint genotyping algorithm from the GATK4’s GenotypeGVCFs tool over the sorted iterator for the genomic bin. We then save this data out to a Delta table, and optionally as a VCF file. For more detail on the technical implementation, see our Spark Summit 2019 talk.

Benchmarking

To benchmark our approach, we used the low-coverage WGS data from the 1000 Genomes project for scale testing, and data from the Genome-in-a-Bottle consortium for accuracy benchmarking. To generate input gVCF files, we aligned and called variants using our DNASeq pipeline. Figure 3 demonstrates that our approach is efficiently scalable with both dataset and cluster size. With this architecture, we are able to jointly call variants across the 2,504 sample whole genome sequencing data from the 1000 Genomes Project in 79 hours on 13 c5.9xlarge machines. To date, we have worked with customers to scale this pipeline across projects with more than 3,000 whole genome samples.

Figure 3: Strong scaling (left) was evaluated by holding the input data constant at 10 samples and increasing the number of executors. Weak scaling (right) was evaluated by holding the cluster size fixed at 13 i3.8xlarge workers and increasing the number of gVCFs processed.

Running with default settings, the pipeline is highly concordant with the GATK4 joint variant calling pipeline on the HG002, HG003 and HG004 trio. Table 3 describes concordance at the variant and genotype level when comparing our pipeline against the “ground truth” of the GATK4 WDL workflow for joint genotyping. Variant concordance implies that the same variant was called across both tools; a variant called by our joint genotyper only is a false positive, while a variant called only by the GATK GenotypeGVCFs workflow is a false negative. Genotype concordance is computed across all variants that were called by both tools. A genotype call is treated as a false positive relative to the GATK if the count of called alternate alleles increased in our pipeline, and as a false negative if the count of called alternate alleles decreased.

Table 3: Concordance Statistics Comparing Open-source GATK4  vs. Databricks for Joint Genotyping Workflows

Precision Recall
Variant 99.9985% 99.9982%
Genotype 99.9988% 99.9992%

The discordant calls generally occur at locations in the genome that have a high number of observed alleles in the input gVCF files. At these sites, the GATK discards some alternate alleles to reduce the cost of re-genotyping. However, the alleles eliminated in this process depends on the sequence that variants are read. Our approach is to list the alternate alleles in the lexicographical order of the sample names prior to pruning. This approach ensures that the output variant calls are consistent given the same sample names and variant sites, regardless of how the computation is parallelized.

Of additional note, our joint genotyping implementation exposes a configuration option (Azure | AWS) which “squares off” and re-genotypes the input data without adjusting the genotypes by a prior probability which is computed from the data. This feature was requested by customers who are concerned about the deflation of rare variants caused by the prior probability model used in the GATK4.

Try it!

--

Try Databricks for free. Get started today.

The post Accurately Building Genomic Cohorts at Scale with Delta Lake and Spark SQL appeared first on Databricks.

Announcing Databricks Runtime 5.4

$
0
0

Databricks is pleased to announce the release of Databricks Runtime 5.4.  This release includes Apache Spark 2.4.3 along with several important improvements and bug fixes .   We recommend all users upgrade to take advantage of this new runtime release.  This blog post gives a brief overview of some of the new high value features that simplify manageability and improve usability in Databricks.

Simplified Manageability

We continue to make advances in Databricks that simplify data and resource management.

Delta Lake Auto Optimize – public preview

Delta Lake is the best place to store and manage data in an open format.  We’ve included a feature in public preview called Auto Optimize that removes administrative overhead by determining optimum file sizes and performing necessary compaction at write time.   It’s configured as an individual table property and can be added to existing tables. Optimized tables allow you to query those tables efficiently for analytics.

To try out Auto Optimize, consult the Databricks documentation(Azure | AWS).

AWS Glue as the Metastore for Databricks – public preview

We’ve partnered with the Data Services team at Amazon to bring the Glue Catalog to Databricks.   Databricks Runtime can now use Glue as a drop-in replacement for the Hive metastore. This provides several immediate benefits:

  • Simplifies manageability by using the same glue catalog across multiple Databricks workspaces.
  • Simplifies integrated security by using IAM Role Passthrough for metadata in Glue.
  • Provides easier access to metadata across the Amazon stack and access to data catalogued in Glue.


Glue as the metastore is currently in public preview, and to start using this feature please consult the Databricks Documentation for configuration instructions.

Improved Usability

Databricks Runtime 5.4 includes several new features that improve usability.

Databricks Connect – general availability

A popular feature that has enjoyed wide adoption during public preview, Databricks Connect is a framework that makes it possible to develop applications on the Databricks Runtime from anywhere.  This enables two primary use cases:

  • Connect to Databricks and work interactively through your preferred IDE
  • Build applications that connect to Databricks through an SDK

Databricks Connect allows you to:

  • Plug into your existing workflows for software development life cycle.
  • Check out, and develop locally in your preferred IDE, or notebook environment.
  • Run your code on Databricks clusters.

For an in depth description, refer to the Databricks Connect blog post, which goes into further detail.  To try out Databricks Connect, refer to  the getting started documentation(Azure | AWS).

Databricks Runtime with Conda – beta

Take advantage of the power of Conda for managing Python dependencies inside Databricks.   Conda has become the package and environment management tool of choice in the data science community and we’re excited to bring this capability to Databricks.  Conda is especially well suited for ML Workloads, and Databricks Runtime with Conda lets you create and manage Python environments from within the scope of a user session.  We provide two simplified Databricks Runtime pathways to get started:

  • databricks-standard environment includes updated versions of many popular Python packages. This environment is intended as a drop-in replacement for existing notebooks that run on Databricks Runtime. This is the default Databricks Conda-based runtime environment.
  • databricks-minimal environment contains a minimum number of packages that are required for PySpark and Databricks Python notebook functionality. This environment is ideal if you want to customize the runtime with various Python packages.

For more in depth information, visit the blog post introducing  Databricks Runtime with Conda.  To get started, refer to the Databricks Runtime with Conda documentation(Azure | AWS).

Library Utilities  – general availability

Databricks Library Utilities enable you to manage Python dependencies within the scope of a single user session.  You can add, remove, and update libraries and switch Python environments (if using our new Databricks Runtime with Conda)  all from within the scope of a session. When you disconnect, the session is not persisted and is garbage collected and resources are freed up for future user sessions.   This has several important benefits:

  • Install libraries when and where they’re needed, from within a notebook.  This eliminates the need to globally install libraries on a cluster before you can attach a notebook that requires those libraries.
  • Notebooks are completely portable between clusters.
  • Library environments are scoped to individual sessions.  Multiple notebooks using different versions of a particular library can be attached to a cluster without interference.
  • Different users on the same cluster can add and remove dependencies without affecting other users. You don’t need to restart your cluster to reinstall libraries.

For an in depth example visit the blog post Introducing Library Utilities.  For further information, refer to Library Utilities in the Databricks documentation(Azure | AWS).

--

Try Databricks for free. Get started today.

The post Announcing Databricks Runtime 5.4 appeared first on Databricks.

Scaling Genomic Workflows with Spark SQL BGEN and VCF Readers

$
0
0

In the past decade, the amount of available genomic data has exploded as the price of genome sequencing has dropped. Researchers are now able to scan for associations between genetic variation and diseases across cohorts of hundreds of thousands of individuals from projects such as the UK Biobank. These analyses will lead to a deeper understanding of the root causes of disease that will lead to treatments for some of today’s most important health problems. However, the tools to analyze these data sets have not kept pace with the growth in data.

Many users are accustomed to using command line tools like plink or single-node Python and R scripts to work with genomic data. However, single node tools will not suffice at terabyte scale and beyond. The Hail project from the Broad Institute builds on top of Spark to distribute computation to multiple nodes, but it requires users to learn a new API in addition to Spark and encourages that data to be stored in a Hail-specific file format. Since genomic data holds value not in isolation but as one input to analyses that combine disparate sources such as medical records, insurance claims, and medical images, a separate system can cause serious complications.

We believe that Spark SQL, which has become the de facto standard for working with massive datasets of all different flavors, represents the most direct path to simple, scalable genomic workflows. Spark SQL is used for extracting, transforming, and loading (ETL) big data in a distributed fashion. ETL is 90% of the effort involved in bioinformatics, from extracting mutations, annotating them with external data sources, to preparing them for downstream statistical and machine learning analysis. Spark SQL contains high-level APIs in languages such as Python or R that are simple to learn and result in code that is easier to read and maintain than more traditional bioinformatics approaches. In this post, we will introduce the readers and writers that provide a robust, flexible connection between genomic data and Spark SQL.

Reading data

Our readers are implemented as Spark SQL data sources, so VCF and BGEN can be read into a Spark DataFrame as simply as any other file type. In Python, reading a directory of VCF files looks like this:

spark.read\
  .format("com.databricks.vcf")\
  .option("includeSampleIds", True)\
  .option("flattenInfoFields", True)\
  .load("/databricks-datasets/genomics/1kg-vcfs")

The data types defined in the VCF header are translated to a schema for the output DataFrame. The VCF files in this example contain a number of annotations that become queryable fields:

The contents of a VCF file in a Spark SQL DataFrame

Fields that apply to each sample in a cohort—like the called genotype—are stored in an array, which enables fast aggregation for all samples at each site.

The array of per-sample genotype fields

As those who work with VCF files know all too well, the VCF specification leaves room for ambiguity in data formatting that can cause tools to fail in unexpected ways. We aimed to create a robust solution that was by default accepting of malformed records and then allow our users to choose filtering criteria. For instance, one of our customers used our reader to ingest problematic files where some probability values were stored as “nan” instead of “NaN”, which most Java-based tools require. Handling these simple issues automatically allows our users to focus on understanding what their data mean, not whether they are properly formatted. To verify the robustness of our reader, we have tested it against VCF files generated by common tools such as GATK and Edico Genomics as well as files from data sharing initiatives.


BGEN files such as those distributed by the UK Biobank initiative can be handled similarly. The code to read a BGEN file looks nearly identical to our VCF example:

spark.read.format("com.databricks.bgen").load(bgen_path)

These file readers produce compatible schemas that allow users to write pipelines that work for different sources of variation data and enable merging of different genomic datasets. For instance, the VCF reader can take a directory of files with differing INFO fields and return a single DataFrame that contains the common fields. The following commands read in data from BGEN and VCF files and merge them to create a single dataset:

vcf_df = spark.read.format(“com.databricks.vcf”).load(vcf_path)
bgen_df = spark.read.format(“com.databricks.bgen”)\
   .schema(vcf_df.schema).load(bgen_path)
big_df = vcf_df.union(bgen_df) # All my genotypes!!

Since our file readers return vanilla Spark SQL DataFrames, you can ingest variant data using any of the programming languages supported by Spark, like Python, R, Scala, Java, or pure SQL. Specialized frontend APIs such as Koalas, which implements the pandas dataframe API on Apache Spark, and sparklyr work seamlessly as well.

Manipulating genomic data

Since each variant-level annotation (the INFO fields in a VCF) corresponds to a DataFrame column, queries can easily access these values. For example, we can count the number of biallelic variants with minor allele frequency less than 0.05:

Spark 2.4 introduced higher-order functions that simplify queries over array data. We can take advantage of this feature to manipulate the array of genotypes. To filter the genotypes array so that it only contains samples with at least one variant allele, we can write a query like this:

Manipulating the genotypes array with higher order functions


If you have tabix indexes for your VCF files, our data source will push filters on genomic locus to the index and minimize I/O costs. Even as datasets grow beyond the size that a single machine can support, simple queries still complete at interactive speeds.

As we mentioned when we discussed ingesting variation data, any language that Spark supports can be used to write queries. The above statements can be combined into a single SQL query:

Querying a VCF file with SQL


Exporting data

We believe that in the near future, organizations will store and manage their genomic data just as they do with other data types, using technologies like Delta Lake. However, we understand that it’s important to have backward compatibility with familiar file formats for sharing with collaborators or working with legacy tools.

We can build on our filtering example to create a block gzipped VCF file that contains all variants with allele frequency less than 5%:

df.where(fx.expr("INFO_AF[0] < 0.05"))\
    .orderBy(“contigName”, “start”)\
    .write.format(“com.databricks.bigvcf”)\
    .save(“output.vcf.bgz”)

This command sorts, serializes, and uploads each segment of the output VCF in parallel, so you can safely output cohort-scale VCFs. It’s also possible to export one VCF per chromosome or on even smaller granularities.

Saving the same data to a BGEN file requires only one small modification to the code:

df.where(fx.expr("INFO_AF[0] < 0.05"))\
    .orderBy(“contigName”, “start”)\
    .write.format(“com.databricks.bigbgen”)\
    .save(“output.bgen”)

What’s next

Ingesting data into Spark is the first step of most big data pipelines, but it’s hardly the end of the journey. In the next few weeks, we’ll have more blog posts that demonstrate how features built on top of these readers and writers can scale and simplify genomic workloads. Stay tuned!

Try it!

Our Spark SQL readers make it easy to ingest large variation datasets with a small amount of code (Azure | AWS). Learn more about our genomics solutions in the Databricks Unified Analytics for Genomics and try out a preview today.


--

Try Databricks for free. Get started today.

The post Scaling Genomic Workflows with Spark SQL BGEN and VCF Readers appeared first on Databricks.

Brickster Spotlight: Meet Alexandra

$
0
0

At Databricks, we build platforms to enable data teams to solve the world’s toughest problems and we couldn’t do that without our wonderful Databricks Team. “Teamwork makes the dreamwork” is not only a central function of our product but it is also central to our culture. Learn more about Alexandra Cong, one of our Software Engineers, and what drew her to Databricks!

Tell us a little bit about yourself.

I’m a software engineer on the Identity and Access Management team. I joined Databricks almost 3 years ago after graduating from Caltech, and I’ve been here ever since!

What were you looking for in your next opportunity, and why did you choose Databricks?

Coming out of college, I was looking for a smaller company where I could not only learn and grow, but make an impact. As a math major, I didn’t have all of the software engineering basics, but interviewing at Databricks reassured me that as long as I was willing and excited to learn from the unknown, I could be successful. Being able to help solve a wide scope of challenges sounded really exciting, as opposed to being at a more established company, where they may have already solved a lot of their big problems. Finally, every person I met during my interviews at Databricks was not only extremely smart, but more importantly, humble and nice – which made me really excited to join the team!

What gets you excited to come to work every day?

It’s really important to me to be always learning and developing new skills. At Databricks, each team owns their services end-to-end and covers such a wide breadth that this is always the case. It’s an additional bonus that any feature you work on is mission-critical and will have a big impact – we don’t have the bandwidth to work on anything that isn’t!

One of our core values at Databricks is to be an owner. What is your most memorable experience at Databricks when you owned it?

I’m part of our diversity committee because I’m passionate about creating an inclusive and welcoming environment for everyone here. We recently sponsored an organization at UC Berkeley that runs a hackathon for under-resourced high school students. Databricks provided mentorship, sponsored prizes, and I got to teach students how to use Databricks to do their data analysis. It was really rewarding to give back to the community, see high school students get excited about coding and data, and be able to encourage even just a handful of students to study Computer Science.

What has been the biggest challenge you’ve faced, and what is a lesson you learned from it?

The biggest challenge I’ve faced so far has been overcoming the mental hurdles growing into a senior software engineer role. Upon first understanding the expectations, I felt overwhelmed and the challenges seemed insurmountable, to the point where I became unmotivated and unhappy. Slowly I came to terms that I would have to take on uncomfortable tasks that would challenge me, and that I would inevitably make mistakes in the process. However, it was a necessary part of my growth and I would just have to tackle these challenges one at a time. This was difficult for me because I hate failing and would rather only do things when I know I will be successful. However, through this process, I’ve learned that I’ll grow so much more if I’m willing to make mistakes and learn from them.

Databricks has grown tremendously in the last few years. How do you see the future of Databricks evolving and what are you most excited to see us accomplish?

I see Databricks being used more and more by companies across many different domains. In an ideal world, Databricks will become the standard for doing data analysis. It might even be a qualification that data analysts list on their resumes! Of course, we have a lot of work to do if we want to get to that point, but I think the market opportunity is huge and I hope that we’ll be able to execute well enough to see that become a reality.

What advice would you give to women in tech who are starting their careers?

Advocate for yourself. This comes in various forms – negotiations, promotions, mentorship, leading projects, or even just talking with your manager about furthering your career growth. At times, I fell into the trap of assuming that my work would speak for itself, and that I didn’t need to do anything on top of that. I’ve since learned that even if it feels outside my comfort zone, I need to actively ask for more if and when I think I deserve it, because no one will be a better advocate for me than myself.

Want to work with Alexandra? Check out our Careers Page.

--

Try Databricks for free. Get started today.

The post Brickster Spotlight: Meet Alexandra appeared first on Databricks.

What’s new with MLflow? On-Demand Webinar and FAQs now available!

$
0
0

On June 6th, our team hosted a live webinar—Managing the Complete Machine Learning Lifecycle: What’s new with MLflow—with Clemens Mewald, Director of Product Management at Databricks.

Machine learning development brings many new complexities beyond the traditional software development lifecycle. Unlike in traditional software development, ML developers want to try multiple algorithms, tools and parameters to get the best results, and they need to track this information to reproduce work. In addition, developers need to use many distinct systems to productionize models.

To solve for these challenges, last June, we unveiled MLflow, an open source platform to manage the complete machine learning lifecycle. Most recently, we announced the General Availability of Managed MLflow on Databricks and the MLflow 1.0 Release.

In this webinar, we reviewed new and existing MLflow capabilities that allow you to:

  • Keep track of experiments runs and results across frameworks.
  • Execute projects remotely on to a Databricks cluster, and quickly reproduce your runs.
  • Quickly productionize models using Databricks production jobs, Docker containers, Azure ML, or Amazon SageMaker

We demonstrated these concepts using notebooks and tutorials from our public documentation so that you can practice at your own pace. If you’d like free access Databricks Unified Analytics Platform and try our notebooks on it, you can access a free trial here.

Toward the end, we held a Q&A and below are the questions and answers.

Q: Apart from having the trouble of all the set-up, is there any missing features/disadvantages of using MLflow on-premises rather than in the cloud on Databricks?

Databricks is very committed to the open source community. Our founders are the original creators of Apache SparkTM – a widely adopted open source unified analytics engine – and our company still actively maintains and contributes to the open source Spark code. Similarly, for both Delta Lake and MLflow, we’re equally committed to help the open source community benefit from these products, as well as provide an out-of-the-box managed version of these products.

When we think about features to provide on the open source or the managed version of Delta Lake or MLflow, we don’t think about whether we should hold back a feature on a version or another. We think about what additional features we can provide that only make sense in a hosted and managed version for enterprise users. Therefore, all the benefits you get from managed MLflow on Databricks are that you don’t need to worry about the setup, managing the servers, and all these integrations with the Databricks Unified Analytics Platform that makes it seamlessly work with the rest of the workflow. Visit http://databricks.com/mlflow to learn more.

Q: Does MLflow 1.0 supports Windows?

Yes, we added support to run the MLflow client on windows. Please see our release notes here.

Q: Is MLflow complements or competes with TensorFlow?

It’s a perfect complement. You can train TensorFlow models and log the metrics and models with MLflow.

Q: How many different metrics can we track using MLflow? Are there any restrictions imposed on it?

MLflow doesn’t impose any limits on the number of metrics you can track. The only limitations are in the backend that is used to store those metrics.

Q: How to parallelize models training with MLflow?

MLflow is agnostic to the ML framework you use to train the model. If you use TensorFlow or PyTorch you can distribute your training jobs with for example HorovodRunner and use MLflow to log your experiments, runs, and models.

Q: Is there a way to bulk extract the MLflow info to perform operational analytics (e.g. how many training runs were there in the last quarter. How many people are training models etc.)?

We are working on a way to more easily extract the MLflow tracking metadata into a format that you can do data science with, e.g. into a pandas dataframe.

Q: Is it possible to train and build a MLflow model using a platform (e.g. like Databricks using TensorFlow with PySpark) and then reuse that MLflow model in another platform (for example in R using RStudio) to score any input?

The MLflow Model format and abstraction allows using any MLflow model from anywhere you can load them. E.g., you can use the python function flavor to call the model from any Python library, or the r function flavor to call it as an R function. MLflow doesn’t rewrite the models into a new format, but you can always expose an MLflow model as a REST endpoint and then call it in a language agnostic way.

Q: To serve a model, what are the options to deploy outside of databricks, eg. Sagemaker. Do you have any plans to deploy as AWS Lambdas?

We provide several ways you can deploy MLflow models, including Amazon SageMaker, Microsoft Azure ML, Docker Containers, Spark UDF and more… See this page for a list. To give one example of how to use MLflow models with AWS Lambda, you can use the python function flavor which enables you to call the model from anywhere you can call a Python function.

Q: Can MLflow be used with python programs outside of Databricks?

Yes, MLflow is an open source product and can be found on GitHub and PyPi.

Q: What is the pricing model for Databricks?

Please see https://databricks.com/product/pricing

Q: Hi how do you see MLflow evolving in relation to Airflow?

We are looking into ways to support multi-step workflows. One way we could do this is by using Airflow. We haven’t made these decisions yet.

Q: Suggestions for deploying multi-step models for example ensemble of several base models.

Right now you can deploy those as MLflow models by writing code to ensemble other models. E.g. similar to how the multi-step workflow example is implemented.

Q: Does MLflow provide a framework to do feature engineering on data?

Not specifically, but you can use any other framework together with MLflow.

To get started with MLflow, follow the instructions at mlflow.org or check out the alpha release code on Github. We’ve also recently created a Slack channel for MLflow as well for real time questions, and you can follow @MLflowOrg on Twitter. We are excited to hear your feedback!

--

Try Databricks for free. Get started today.

The post What’s new with MLflow? On-Demand Webinar and FAQs now available! appeared first on Databricks.

Getting Data Ready for Data Science: On-Demand Webinar and Q&A Now Available

$
0
0

On June 25th, our team hosted a live webinar — Getting Data Ready for Data Science — with Prakash Chockalingam, Product Manager at Databricks.

Successful data science relies on solid data engineering to furnish reliable data. Data lakes are a key element of modern data architectures. Although data lakes afford significant flexibility, they also face various data reliability challenges. Delta Lake is an open source storage layer that brings reliability to data lakes allowing you to provide reliable data for data science and analytics. Delta Lake is deployed at nearly a thousand customers and was recently open sourced by Databricks.

The webinar covered modern data engineering in the context of the data science lifecycle and how the use of Delta Lake can help enable your data science initiatives. Topics areas covered included:

  • The data science lifecycle
  • The importance of data engineering to successful data science
  • Key tenets of modern data engineering
  • How Delta Lake can help make reliable data ready for analytics
  • The ease of adopting Delta Lake for powering your data lake
  • How to incorporate Delta Lake within your data infrastructure to enable Data Science

If you are interested in learning more technical detail we encourage you to also check out the webinar “Delta Lake: Open Source Reliability for Data Lakes” by Michael Armbrust, Principal Engineer responsible for Delta Lake. You can access the Delta Lake code and documentation at the Delta Lake hub.

Toward the end of the webinar, there was time for Q&A. Here are some of the  questions and answers.

Q: Is Delta Lake available on Docker?
A: You can download and package Delta Lake as part of your Docker container. We are aware of some users employing this approach. The Databricks platform also has support for containers. If you use Delta Lake on the Databricks platform then you will not require extra steps since Delta Lake is packaged as part of the platform. If you have custom libraries, you can package them as docker containers and use them to launch clusters.

Q: Is Delta architecture good for both reads and writes?
A: Yes, the architecture is good for both reads and writes. It is optimized for throughput for both reads and writes.

Q: Is MERGE available on Delta Lake without Databricks i.e. in the open source version?
A: While not currently available as part of the open source version MERGE is on the roadmap and planned for the next release in July. Its tracked in Github milestones here.

Q: Can you discuss about creating feature engineering pipeline using Delta Lake.
A: Delta Lake can play an important role in your feature engineering pipeline with schema on write helping ensure that the feature store is of high quality. We are also working on a new feature called Expectations that will further help with managing how tightly constraints are applied to features.

Q: Is there a way to bulk move the data from databases into Delta Lake without creating and managing a message queue?
A: Yes, you can dump the change data to ADLS or S3 directly using connectors like GoldenGate. You can then stream from cloud storage. This eliminates the burden of managing a message queue.

Q: Can you discuss the Bronze, Silver, Gold concept as applied to tables.
A: The Bronze, Silver, Gold approach (covered in more detail in an upcoming blog) is a common pattern that we see in our customers where raw data is ingested and refined successively to different degrees and for different purposes until eventually one has the most refined “Gold” tables.

Q: Does versioning operate at a file or table or partition level?
A: Versioning operates at a file level so whenever there are updates Delta Lake identifies which files are changed and maintains appropriate information to facilitate Time Travel.

Interested in the open source Delta Lake?
Visit the Delta Lake online hub to learn more, download the latest code and join the Delta Lake community.


--

Try Databricks for free. Get started today.

The post Getting Data Ready for Data Science: On-Demand Webinar and Q&A Now Available appeared first on Databricks.

Hyperparameter Tuning with MLflow, Apache Spark MLlib and Hyperopt

$
0
0

Hyperparameter tuning is a common technique to optimize machine learning models based on hyperparameters, or configurations that are not learned during model training.  Tuning these configurations can dramatically improve model performance. However, hyperparameter tuning can be computationally expensive, slow, and unintuitive even for experts.

Databricks Runtime 5.4 and 5.4 ML (Azure | AWS) introduce new features which help to scale and simplify hyperparameter tuning. These features support tuning for ML in Python, with an emphasis on scalability via Apache Spark and automated tracking via MLflow.

MLflow: tracking tuning workflows

Hyperparameter tuning creates complex workflows involving testing many hyperparameter settings, generating lots of models, and iterating on an ML pipeline.  To simplify tracking and reproducibility for tuning workflows, we use MLflow, an open source platform to help manage the complete machine learning lifecycle.  Learn more about MLflow in the MLflow docs and the recent Spark+AI Summit 2019 talks on MLflow.

Our integrations encourage some best practices for organizing runs and tracking for hyperparameter tuning.  At a high level, we organize runs as follows, matching the structure used by tuning itself:

Tuning MLflow runs MLflow logging
Hyperparameter tuning algorithm Parent run Metadata, e.g., numFolds for CrossValidator
Fit & evaluate model with hyperparameter setting #1 Child run 1 Hyperparameters #1, evaluation metric #1
Fit & evaluate model with hyperparameter setting #2 Child run 2 Hyperparameters #2, evaluation metric #2

To learn more, check out this talk on “Best Practices for Hyperparameter Tuning with MLflow” from the Spark+AI Summit 2019.

Managed MLflow is now generally available on Databricks, and the two integrations we discuss next leverage managed MLflow by default when the MLflow library is installed on the cluster.

Apache Spark MLlib + MLflow integration

Apache Spark MLlib users often tune hyperparameters using MLlib’s built-in tools CrossValidator and TrainValidationSplit.  These use grid search to try out a user-specified set of hyperparameter values; see the Spark docs on tuning for more info.

Databricks Runtime 5.3 and 5.3 ML and above support automatic MLflow tracking for MLlib tuning in Python.

With this feature, PySpark CrossValidator and TrainValidationSplit will automatically log to MLflow, organizing runs in a hierarchy and logging hyperparameters and the evaluation metric.  For example, calling CrossValidator.fit() will log one parent run.  Under this run, CrossValidator will log one child run for each hyperparameter setting, and each of those child runs will include the hyperparameter setting and the evaluation metric.  Comparing these runs in the MLflow UI helps with visualizing the effect of tuning each hyperparameter.

In Databricks Runtime 5.3 and 5.3 ML, automatic tracking is not enabled by default. To turn automatic tracking on, set the Spark Configuration spark.databricks.mlflow.trackMLlib.enabled to “true”.  With the 5.4 releases, automatic tracking is enabled by default.

This feature is now in Public Preview, so we encourage Databricks customers to try it out and send feedback.  Check out the docs (AWS | Azure) to get started!

Distributed Hyperopt + MLflow integration

Hyperopt is a popular open-source hyperparameter tuning library with strong community support (600,000+ PyPI downloads, 3300+ stars on Github as of May 2019). Data scientists use Hyperopt for its simplicity and effectiveness. Hyperopt offers two tuning algorithms: Random Search and the Bayesian method Tree of Parzen Estimators, which offers improved compute efficiency compared to a brute force approach such as grid search. However, distributing Hyperopt previously did not work out of the box and required manual setup.

In Databricks Runtime 5.4 ML, we introduce an implementation of Hyperopt powered by Apache Spark. Using a new Trials class SparkTrials, you can easily distribute a Hyperopt run without making any changes to the current Hyperopt APIs. You simply need to pass in the SparkTrials class when applying the hyperopt.fmin() function (see the example code below). In addition, all tuning experiments, along with their hyperparameters and evaluation metrics, are automatically logged to MLflow in Databricks. With this feature, we aim to improve efficiency, scalability, and simplicity for hyperparameter tuning workflows.

This feature is now in Public Preview, so we encourage Databricks customers to try it out and send feedback.  Check out the docs (Azure | AWS) to get started!

# New SparkTrials class which distributes tuning

spark_trials = SparkTrials(parallelism=24)

fmin(

 fn=train,             # Method to train and evaluate your model

 space=search_space,   # Defines space of hyperparameters

 algo=tpe.suggest,     # Search algorithm: Tree of Parzen Estimators

 max_evals=8,          # Number of hyperparameter settings to try

 show_progressbar=False,

 trials=spark_trials)

The results can be visualized using tools such as parallel coordinates plots.  In the plot below, we can see that the Deep Learning models with the best (lowest) losses were trained using medium to large batch sizes, small to medium learning rates, and a variety of momentum settings. Note that this plot was made by hand via plotly, but MLflow will provide native support for parallel coordinates plots in the near future.

At Databricks, we embrace open source communities and APIs. We are working with the Hyperopt community to contribute this Spark-powered implementation to open source Hyperopt. Stay tuned.

Get started!

To learn more about hyperparameter tuning in general:

To learn more about MLflow, check out these resources:

To start using these specific features, check out the following doc pages and their embedded example notebooks.  Try them out with the new Databricks Runtime 5.4 ML release.

  • For MLlib use cases, look at the MLlib + Automated MLflow Tracking docs (AWS | Azure).
  • For single-machine Python ML use cases (e.g., scikit-learn, single-machine TensorFlow), look at the Distributed Hyperopt + Automated MLflow Tracking docs (Azure | AWS).
  • For non-MLlib distributed ML use cases (e.g., HorovodRunner), look at MLflow’s examples on adding tracking to Hyperopt and other tools.

--

Try Databricks for free. Get started today.

The post Hyperparameter Tuning with MLflow, Apache Spark MLlib and Hyperopt appeared first on Databricks.


Brickster Spotlight: Meet Vida

$
0
0

At Databricks, we build platforms to enable data teams to solve the world’s toughest problems and we couldn’t do that without our wonderful Databricks Team. “Teamwork makes the dreamwork” is not only a central function of our product but it is also central to our culture. Learn more about Vida, our Sr. Director of Field Engineering, and about how Databricks has evolved during her time here!

Tell us a little bit about yourself. 

I’m Vida, I lead the Field Engineering team for Enterprise East at Databricks and am based out of NYC. We help customers put their big data workloads onto Databricks’ platform. I’ll celebrate 5 years at Databricks this July – so I’ve seen the company through a lot of transitions and seen the technology evolve. It’s all been very exciting!

What were you looking for in your next opportunity, and why did you choose Databricks?

I wanted to work for a big data technology, cloud, and open source company – I’m so excited about the intersection of technology and innovation at Databricks. I also wanted to transition from a software engineering role to a customer facing role, and I wanted to go to a smaller company where it would be easy and flexible to try out that new type of role. When I joined Databricks, we didn’t have a sales team, support functions, marketing, etc. so I got to dabble a bit in some of those and work very closely with the first people that seeded those functions.  Even though Databricks has gotten a lot bigger, I still find our culture to be very open, which makes it easy to collaborate with other teams.

What gets you excited to come to work every day? 

I’m excited about what Databricks customers are doing with big data technology across all sorts of verticals! I wanted to come to Databricks rather than work on the Big Data team for a single company because I realized a company like Databricks would give me exposure to so many different use cases. I have customers who are using genomics processing to aid new drug discovery, and leveraging insights from data to combat fraud, analyze risk, and personalize their websites. There’s so much exciting innovation and applicability to different industries, so it’s wonderful to find out what customers have been able to accomplish with Databricks.

One of our core values at Databricks is to be an owner. What is your most memorable experience at Databricks when you owned it? 

I started when Databricks was still in beta, so I worked directly with Databricks’ first users, which gave me a lot of insight into what confused new developers about Apache Spark™. This helped me figure out what talks to give on Apache Spark™ to help people understand big data concepts and what notebook examples to provide.

What has been the biggest challenge you’ve faced, and what is a lesson you learned from it?

Things move really fast at a high growth startup: in some ways it almost feels like a new company every year as we double. What I’ve learned from this experience is that there’s no way to survive at this rate of growth without a strong, diverse team built on trust and teamwork. I’m grateful for my teammates at Databricks for helping me tackle exciting challenges.

Databricks has grown tremendously in the last few years. How do you see the future of Databricks evolving and what are you most excited to see us accomplish?

Big Data and cloud technology is still really early and I think there’s still a ton of potential for growth. That’s the reason I wanted to come to Databricks: to work for an engineering team that I knew would continue to innovate in the space. I’m really excited for Delta Lake, which I believe is one of the most significant advances in the big data space since Apache Spark™. Right now a lot of the innovation is focused on infrastructure, and I think the future will have a lot of application innovation as well.

What advice would you give to women in tech who are starting their careers?

After you’ve invested in learning a core set of hard skills, for the next part of your career you really have to think about what makes you unique and play to those strengths. I enjoyed being a software developer, but I realized at some point it would be fun to work with customers. I love telling stories and working with people, and that’s not helpful when your job is to code all day, but it is great for doing demos and working in sales. I also recommend connecting with other women in technology – there aren’t a lot of us, so I’ve found it easy to network and reach out to meet other women in the field who are also seeking a sense of community.

Want to join Vida’s team? Check out our Careers Page.

--

Try Databricks for free. Get started today.

The post Brickster Spotlight: Meet Vida appeared first on Databricks.

Making the Move to Amsterdam: Bilal Aslam

$
0
0

While we are proud of our Berkeley roots, Databricks now calls many cities around the world our home. In addition to offices in London, Singapore, New York and our headquarters in San Francisco, we have one of our major engineering hubs in the fast-growing European R&D center, Amsterdam. Databricks offers the exciting opportunity to relocate to one of our global offices and we are proud to say that we have been able to help our employees navigate through that transition. In this blog, learn more about what inspired me to make the move from Seattle to Amsterdam.

Fun team activity

Tell us a little about yourself.

I am a Director of Product Management at Databricks in Amsterdam. I work on Databricks Runtime with a group of talented individuals. I like to think that my team helps make Databricks the fastest platform for big data. On December 14, 2018, just before Christmas, my wife and I made the improbable but ultimately delightful move from the suburbs of Seattle to Amsterdam, with three young children and two old dogs.

What were you looking for in your next opportunity?

For my next opportunity, I wanted an international experience. To build great products, one must understand and incorporate voices from various cultures from all over the world. Second, I wanted to join a fast-growing technology startup where I could have a chance to build the organization and the product from an early stage. It had to be in a place where I would be challenged to leave my comfort zone. My background is in big data, ML and AI, so I wanted to narrow my search down to companies in this space.

My wife and I also share the goal of traveling more exposing our children to new cultures. We wanted our children to have the opportunity to learn a new language and experience a different culture from the one they grew up in. Like many immigrants to the US, our families are spread out all over the globe. We talked frequently about wanting the kids to be closer to their cousins, but schools, sports, and activities kept getting in the way.

How did you choose to go to Amsterdam and Databricks specifically?

We wanted to choose a city that was safe, centrally located for easy international travel and had excellent educational and cultural opportunities. Amsterdam quickly bubbled to the top of our list:

  • The Netherlands is an incredibly safe country. Per capita crime rates are some of the lowest in the world.
  • Amsterdam is centrally located and is a hub for major airlines. Many European capitals are less than an hour by air. Much of Asia is within 5 to 6 hours. The train network is superb, with comfortable, rapid travel throughout Europe.
  • Culturally, the Netherlands is one of the richest countries in the world. Amsterdam has many world-class museums.
  • Amsterdam is incredibly friendly to expatriates. Many highly-skilled workers, such as software engineers, qualify for the 30% ruling, which exempts 30% of your salary from taxation for up to 5 years.

Joining Databricks was a no-brainer. Databricks is the only Unified Analytics Platform in the world. It solves a very difficult problem with a really delightful product. I have been a customer of Databricks at two different companies and so I was truly excited to work at a company I respected so much. I’ve found our Amsterdam office to be a great place to work. It is nerdy in the best kind of way; I am surrounded by some of the smartest people I know. People here also love data and data science – you will see Databricks Notebooks on most screens. Weekly lightning talks are a great way to learn about everything, from advances in query optimization to underwater photography.

Weekly lightning talk at our Amsterdam office

What was the biggest challenge you faced when relocating to Amsterdam, and what lessons did you learn from it?

To be honest, the move seemed impossible at first. How do you uproot from communities you have been part of for more than a decade? There are so many big and little things that make Seattle special – friends, schools, professional relationships etc. This seemed like a really big hill to climb.

However, the only way to reduce uncertainty is to start planning, so we made a project plan and wrote down a list of everything that needs to happen to make the move successful. We were also lucky to work with an excellent relocation specialist who arranged everything from shipping furniture to arranging schooling for the children (including choosing between so many great options!). What seemed like an impossible move started looking more possible day by day.

Once we were in Amsterdam, it took us a while to get used to living in the Netherlands. The Dutch are incredible hosts, but it took me some time to start picking up cultural nuances in communication and work style.

What has been the most exciting aspect about living in Amsterdam?

One of the most exciting aspects for my family, about moving to Amsterdam, was that this was an adventure that allowed us to spend more time doing what we love: travel. We have traveled to France, Greece and the United Kingdom in the last 6 months, with Scotland on the horizon.

Another aspect that I’ve enjoyed is the accessibility and accommodations offered in Amsterdam. A typical day in Amsterdam starts with the children getting ready for school. They are all enrolled in Dutch schools, and the transition to a new language and culture was very smooth, thanks to the Dutch education system which offers special language classes to help newcomers. Instead of being driven to school, our children bike to school like locals. My wife and I also bike to work, with our commutes taking under 15 minutes. We live in an apartment in Amsterdam and enjoy walking to neighborhood cafes.

While we work hard at Databricks Amsterdam, we also like to have fun. Amsterdam and its surrounding areas are beautiful – we take every chance we can to do boerengolf and go boating in canals. A weekly highlight is homemade Thai food delivered fresh by a local entrepreneur every Tuesday.

Playing boerengolf

Databricks has grown tremendously in the last few years. How do you see the future of Databricks evolving and what are you most excited to see us accomplish?

I believe Databricks has a very bright future ahead of it. Data, ML and AI are the backbone of a new economy and we are the only data platform that brings all three together in a single unified platform. In the coming years, I anticipate strong growth in the Amsterdam office. We are hiring as fast as we can in almost all disciplines – software engineering, product management, customer success and much more.

Celebrating a teammate’s birthday

What advice would you give to people considering relocation?

Moving to Databricks Amsterdam was one of the best things we ever did as a family. It was a challenging move, but we grow when we challenge assumptions about where we are happy and comfortable. We are continually surprised by how flexible our children were and how enriching it has been for them to travel more, learn a new language and spend more time with their cousins, aunts and uncles. My advice is simply this: don’t be afraid to dream. And while you do that, also create a project plan!


Interested in joining Bilal’s team in our Amsterdam office? Check out our Careers Page.


--

Try Databricks for free. Get started today.

The post Making the Move to Amsterdam: Bilal Aslam appeared first on Databricks.

Migrating Transactional Data to a Delta Lake using AWS DMS

$
0
0
Try this notebook in Databricks

Note: We also recommend you read Efficient Upserts into Data Lakes with Databricks Delta which explains the use of MERGE command to do efficient upserts and deletes.

Challenges with moving data from databases to data lakes

Large enterprises are moving transactional data from scattered data marts in heterogeneous locations to a centralized data lake. Business data is increasingly being consolidated in a data lake to eliminate silos, gain insights and build AI data products. However, building data lakes from a wide variety of continuously changing transactional databases and keeping data lakes up to date is extremely complex and can be an operational nightmare.

Traditional solutions using vendor-specific CDC tools or Apache SparkTM direct JDBC ingest are not practical in typical customer scenarios represented below:

(a) Data sources are usually spread across on-prem servers and the cloud with tens of data sources and thousands of tables from databases such as  PostgreSQL, Oracle, and MySQL databases

(b) Business SLA for change data captured in the data lake is within 15 mins

(c)  Data occurs with varying degrees of ownership and network topologies for Database connectivity.

In scenarios such as the above, building a data lake using Delta Lake and AWS Database Migration Services (DMS) to migrate historical and real-time transactional data proves to be an excellent solution. This blog post walks through an alternate easy process for building reliable data lakes using AWS Database Migration Service (AWS DMS) and  Delta Lake, bringing data from multiple RDBMS data sources. You can then use the Databricks Unified Analytics Platform to do advanced analytics on real-time and historical data.

What is Delta Lake?

Delta Lake is an open source storage layer that brings reliability to data lakes. Delta Lake provides ACID transactions, scalable metadata handling, and unifies streaming and batch data processing. Delta Lake runs on top of your existing data lake and is fully compatible with Apache Spark APIs.

Specifically, Delta Lake offers:

  • ACID transactions on Spark: Serializable isolation levels ensure that readers never see inconsistent data.
  • Scalable metadata handling: Leverages Spark’s distributed processing power to handle all the metadata for petabyte-scale tables with billions of files at ease.
  • Streaming and batch unification: A table in Delta Lake is a batch table as well as a streaming source and sink. Streaming data ingest, batch historic backfill, interactive queries all just work out of the box.
  • Schema enforcement: Automatically handles schema variations to prevent insertion of bad records during ingestion.
  • Time travel: Data versioning enables rollbacks, full historical audit trails, and reproducible machine learning experiments.
  • Upserts with Managed Delta Lake on Databricks (also coming soon to the open source Delta Lake): The MERGE command allows you to efficiently upsert and delete records in your data lakes. MERGE dramatically simplifies how a number of common data pipelines can be built; all the complicated multi-hop processes that inefficiently rewrote entire partitions can now be replaced by simple MERGE queries. This finer-grained update capability simplifies how you build your big data pipelines for change data capture from AWS DMS changelogs.

What is AWS Database Migration Service (DMS)?

AWS DMS can migrate your data from the most widely used commercial and open-source databases to S3 for both migrations of existing data and changing data. The service supports migrations from different database platforms, such as Oracle to Amazon Aurora or Microsoft SQL Server to MySQL. With AWS Database Migration Service, you can continuously replicate your data with high availability and consolidate databases by streaming data to Amazon S3  from any of the supported sources.

Migrating data into a Delta Lake using AWS Database Migration Services

Assume that you have a “person” table built on a MySQL database that holds data for the application user records with the columns shown. The table is updated whenever a person moves, a new person gets added and an existing person may be deleted. We will ingest this table using AWS DMS into S3 and then load it using Delta Lake to showcase an example of ingesting and keeping the data lake in sync with the transactional data stores.  We will demonstrate change data capture to this table in MySQL and use AWS DMS to replicate changes into S3 and easily merge into the data lake built using Delta Lake.

Architecture

In this solution, we will use DMS to bring the data sources into Amazon S3 for the initial ingest and continuous updates. We load initial data from S3 into a Delta Lake table, and then use Delta Lake’s upserts capability to capture the changes into the Delta Lake table. We will run analytics on Delta Lake table that is in sync with the original sources to gain business insights. The following diagram demonstrates the proposed solution:

After the data is available on Delta Lake, you can easily use dashboards or BI tools to generate intelligent reports to gain insights. You can also take this a step further and use the data to build ML models with Databricks.

Solution Details

For the purposes of this post, we create an RDS database with a MySQL engine then load some data. In real life, there may be more than a single source database; the process described in this post would still be similar.

Follow the steps in Tutorial: Create a Web Server and an Amazon RDS Database to create the source database. Use the links from the main tutorial page to see how to connect to specific databases and load data. For more information, see: Creating a DB Instance Running the MySQL Database Engine

Make a note of the security group that you create and associate all the RDS instances with it. Call it “TestRDSSecurityGroup”. Afterward, you should be able to see the database listed in the RDS Instances dashboard.

Setup Target S3 buckets

Set up two S3 buckets as shown below,  one for batch initial load and another for incremental change data capture.

In the next step, choose Publicly Accessible for non-production usage to keep the configuration simple. Also, for simplicity, choose the same VPC where you have placed the RDS instances and include the TestRDSSecurityGroup in the list of security groups allowed to access.

Setup up DMS

You can set up DMS easily, as indicated in the AWS Database Migration Service blog post. You may take the following step-by-step approach:

  1. Create a replication instance.
  2. Create the endpoints for the source database and the target S3 buckets you set up in the previous step .
  3. Create a task to synchronize each of the sources to the target.
Create endpoints

In the DMS console, choose Endpoints, Create endpoint. You need to configure the endpoint representing the MySQL RDS database. You also need to create the target endpoint by supplying the S3 buckets that you created in the previous steps. After configuration, the endpoints look similar to the following screenshot:

Create two tasks and start data migration

You can rely on DMS to migrate table(s) in your target Amazon S3 buckets

In the DMS console, choose Tasks, Create Tasks. Fill in the fields as shown in the following screenshot:

  1. Migration Task for Initial Load:

  1. Migration Task for CDC:

Note that given the source is RDS MySQL and you chose to migrate data and replicate ongoing changes, you need to enable bin log retention. Other engines have other requirements and DMS prompts you accordingly. For this particular case, run the following command:

call mysql.rds_set_configuration('binlog retention hours', 24);

After both tasks have successfully completed, the Tasks tab now looks like the following:

Ensure that data migration is working:
  1. Check that initial data is loaded to S3 bucket:

Example Row:

2. Make some changes to the person table in the source database and note that the changes are migrated to S3
INSERT into  person(id,first_name,last_name,email,gender,dob,address,city,state) values ('1001','Arun','Pamulapati','cadhamsrs@umich.edu','Female','1959-05-03','4604 Delaware Junction','Gastonia','NC');
UPDATE person set state = 'MD' where id=1000;
DELETE from person  where id = 998;
UPDATE person set state = 'CA' where id=1000;

Change Log:

Load initial migration data into Delta Lake

We will be creating Delta Lake table from the initial load file , you can use Spark SQL code and change the format from parquet, csv, json, and so on, to delta. For all file types, you read the files into a DataFrame and write out in delta format:

personDF = spark.read.option("Header",True).option("InferSchema",True).csv("/mnt/%s/arun/person/" % initialoadMountName)
personDF.write.format("delta").save("/delta/person")spark.sql("CREATE TABLE person USING DELTA LOCATION '/delta/person/'")
Merge incremental data into Delta Lake

We will be using Delta merge into capability to capture change logs into Delta Lake.

personChangesDF = (spark.read.csv("dbfs:/mnt/%s/arun/person" % changesMountName,                         inferSchema=True, header=True,                         
ignoreLeadingWhiteSpace=True,
                        ignoreTrailingWhiteSpace=True))
personChangesDF.registerTempTable("person_changes")
MERGE INTO person target
USING
(SELECT Op,latest_changes.id,first_name,last_name,email,gender,dob,address,city,state,create_date,last_update
  FROM person_changes latest_changes
 INNER JOIN (
   SELECT id,  max(last_update) AS MaxDate
   FROM person_changes
   GROUP BY id
) cm ON latest_changes.id = cm.id AND latest_changes.last_update = cm.MaxDate) as source
ON source.id == target.id
WHEN MATCHED AND source.Op = 'D' THEN DELETE
WHEN MATCHED THEN UPDATE SET *
WHEN NOT MATCHED  THEN INSERT *

Note:

1) You can use Databricks Jobs functionality to schedule CDC merges based on your SLAs and move the changelogs from cdc S3 bucket to an archive bucket after a successful merge to keep your merge payload to most recent and small.  A job in Databricks platform is a way of running a notebook or JAR either immediately or on a scheduled basis. You can create and run jobs using the UI, the CLI, and by invoking the Jobs API. Similarly, you can monitor job run results in the UI, using the CLI, by querying the API, and through email alerts.

2) For a performant initial load of large tables prefer to take advantage of Spark native parallelism using JDBC reads or employ DMS best practices to use AWS Database Migration Service (AWS DMS) most effectively.

Conclusion build a simpler data pipeline and a reliable Delta Lake

In this post, we showed the use of Delta Lake to ingest and incrementally capture changes from RDBMS data source using AWS DMS to build easy, reliable, and economical data lakes with simple configuration and minimal code. You also used Databricks notebooks to create a data visualization on the dataset to provide you with additional insights.

Try this notebook in Databricks


--

Try Databricks for free. Get started today.

The post Migrating Transactional Data to a Delta Lake using AWS DMS appeared first on Databricks.

Brickster Spotlight: Meet Heather

$
0
0

At Databricks, we build platforms to enable data teams to solve the world’s toughest problems and we couldn’t do that without our wonderful Databricks Team. “Teamwork makes the dreamwork” is not only a central function of our product but it is also central to our culture. Learn more about Heather, our VP of Mid Market and Commercial Sales and what gets her excited about coming to work every day!

Tell us a little bit about yourself.

Current life motto = work hard, mom hard. I’ve been in tech sales for 20 years, and have always worked for awesome product and engineering companies. I currently lead Mid Market and Commercial Sales for the Americas at Databricks!

What were you looking for in your next opportunity, and why did you choose Databricks?

There were a few things I was looking for: rapid growth, exceptional executive leadership that I could learn from, and a company where my previous experience in sales with high-growth companies could be applied to help build the organization.

This one surprised me and I didn’t realize it until it’s become true – that I was looking for a company to make the world a better place. I know it sounds so cheesy but when we see what our customers can do, like Regeneron, who has been using Databricks to improve their drug discovery and development processes – that to me, is inspirational. I didn’t realize that was what I was getting into but it’s so true – the ability to see these things you can’t imagine; be improved.

What gets you excited to come to work every day? 

I’m very goal oriented – whether it’s a quarterly goal, helping my AEs achieve their personal goals, or just winning a deal. There’s so much opportunity and it doesn’t happen without people actually taking initiative and doing things. And I enjoy being one of those people.

One of our core values at Databricks is to be an owner. What is your most memorable experience at Databricks when you owned it? 

As a Sales leader, I own the diversity and impact of my team completely. That means I’m purposeful, set goals for myself, communicate them to the hiring team and to my broader team. You can’t expect things to happen if you’re not intentional about it. I’m happy to say that my team started off as 15% women, and has increased to about 40%. It’s not quite where I want it to be, but we’re getting there!

What is one of the biggest challenges you’ve faced, and what is a lesson you learned from it?

This is from a long time ago, but in terms of my college decision, I had the choice of going to a small liberal arts college, where I would have been the star water polo player vs. going to a bigger, far more challenging school and walking onto the water polo team, where I wasn’t the star at all. Choosing to go to the big school and embracing new challenges, allowed me to grow as a person. You’re not going to grow as much being a big fish in a small pond, so seek out a bigger pond so you can grow within it.

Databricks has grown tremendously in the last few years. How do you see the future of Databricks evolving and what are you most excited to see us accomplish?

Right now, we’re well-known within Data and AI industries but not really known outside of our niche. I’m really looking forward to us being a “household name” and having anyone hear Databricks and know what we do. I’m also excited to see more of what our customer base can do – they astound me with what is possible. Finally, I’m excited to see how our culture evolves as we scale. Our core values like teamwork and being customer and partner obsessed are solid, and those will always stay the same. But I’m excited to see how the manifestation of those values evolve as we grow and add more team members.

What advice would you give to women in tech who are starting their careers?

Look for advocates and people who lift those around them as they rise in their career. In other words, find people who want to bring you up with them. This is different than mentors. Mentorship is teaching someone how to do things. Advocates are people who look out for you, create opportunities for you, and want to help you grow your career, as they grow theirs as well. So find the advocate, as well as the mentor – male or female.

Also, this applies to anyone: work really hard. Push yourself because you will be better, stronger, and prepared for the next position if you are the internal motivator and not driven by external motivators like the approval of others or money.

Want to join Heather’s team? Check out our Careers Page.

--

Try Databricks for free. Get started today.

The post Brickster Spotlight: Meet Heather appeared first on Databricks.

Announcing Databricks Runtime 5.5 and Runtime 5.5 for Machine Learning

$
0
0

Databricks is pleased to announce the release of Databricks Runtime 5.5.  This release includes Apache Spark 2.4.3 along with several important improvements and bug fixes as noted in the latest release notes [Azure|AWS].  We recommend all users upgrade to take advantage of this new runtime release.  This blog post gives a brief overview of some of the new high-value features that increase performance, compatibility, manageability and simplifying machine learning on Databricks.


Faster Cluster Launches with Instance Pools – public preview

In Databricks Runtime 5.5 we are previewing a feature called Instance Pools, which significantly reduces the time it takes to launch a Databricks cluster. Today, launching a new cluster requires acquiring virtual machines from your cloud provider, which can take up to several minutes. With Instance Pools, you can hold back a set of virtual machines so they can be used to rapidly launch new clusters. You pay only cloud provider infrastructure costs while virtual machines are not being used in a Databricks cluster, and pools can scale down to zero instances, avoiding costs entirely when there are no workloads.

Presto and Amazon Athena Compatibility with Delta Lake – public preview on AWS

As of Databricks Runtime 5.5, you can make Delta Lake tables available for querying from Presto and Amazon Athena. These tables can be queried just like tables with data stored in formats like Parquet. This feature is implemented using manifest files. When an external table is defined in the Hive metastore using manifest files, Presto and Amazon Athena use the list of files in the manifest rather than finding the files by directory listing.

AWS Glue as the Databricks Metastore – generally available

We’ve partnered with Amazon Web Services to bring AWS Glue to Databricks. Databricks Runtime can now use AWS Glue as a drop-in replacement for the Hive metastore. For further information, see Using AWS Glue Data Catalog as the Metastore for Databricks Runtime.

DBFS FUSE v2 – private preview

The Databricks Filesystem (DBFS) is a layer on top of cloud storage that abstracts away peculiarities of underlying cloud storage providers. The existing DBFS FUSE client lets processes access DBFS using local filesystem APIs. However, it was designed mainly for convenience instead of performance. We introduced high-performance FUSE storage at location file:/dbfs/ml for Azure in Databricks Runtime 5.3 and for AWS in Databricks Runtime 5.4.  DBFS FUSE v2 expands the improved performance from dbfs:/ml to all DBFS locations including mounts. The feature is in private preview; to try it contact Databricks support.

Secrets API in R notebooks

The Databricks Secrets API [Azure|AWS] lets you inject secrets into notebooks without hardcoding them. As of Databricks Runtime 5.5, this API is available in R notebooks in addition to existing support for Python and Scala notebooks. You can use the dbutils.secrets.get function to obtain secrets. Secrets are redacted before printing to a notebook cell.

Plan to drop Python 2 support in Databricks Runtime 6.0

Python 2 is coming to the end of life in 2020. Many popular projects have announced they will cease supporting Python 2 on or before 2020, including a recent announcement for Spark 3.0. We have considered our customer base and plan to drop Python 2 support starting with Databricks Runtime 6.0, which is due to release later in 2019.

Databricks Runtime 6.0 and newer versions will support only Python 3. Databricks Runtime 4.x and 5.x will continue to support both Python 2 and 3. In addition, we plan to offer long-term support (LTS) for the last release of Databricks Runtime 5.x. You can continue to run Python 2 code in the LTS Databricks Runtime 5.x. We will soon announce which Databricks Runtime 5.x will be LTS.

Enhancements to Databricks Runtime for Machine Learning


Major package upgrades

With Databricks Runtime 5.5 for Machine Learning, we have made major package upgrades including:

  • Added MLflow 1.0 Python package
  • Tensorflow upgraded from 1.12.0 to 1.13.1
  • PyTorch upgraded from 0.4.1 to 1.1.0
  • scikit-learn upgraded from 0.19.1 to 0.20.3

Single-node multi-GPU operation for HorovodRunner

We enabled HorovodRunner to utilize multi-GPU driver-only clusters. Previously, to use multiple GPUs, HorovodRunner users would have to spin up a driver and at least one worker. With this change, customers can now distribute training within a single node (i.e. a multi-GPU node) and thus use compute resources more efficiently. HorovodRunner is available only in Databricks Runtime for ML.

Faster model inference pipelines with improved binary file data source and scalar iterator Pandas UDF – public preview

Machine learning tasks, especially in the image and video domain, often have to operate on a large number of files. In Databricks Runtime 5.4, we made available the binary file data source to help ETL arbitrary files such as images into Spark tables. In Databricks Runtime 5.5, we have added an option, recursiveFileLookup, to load files recursively from nested input directories. See binary file data source [Azure|AWS].

The binary file data source enable you to run model inference tasks in parallel from Spark tables using a scalar Pandas UDF. However, you might have to initialize the model for every record batch, which introduces overhead. In Databricks Runtime 5.5, we are backporting a new Pandas UDF type called “scalar iterator” from Apache Spark master. With it you can initialize the model only once and apply the model to many input batches, which can result in a 2-3x speedup for models like ResNet50. See Scalar Iterator UDFs [Azure|AWS].

--

Try Databricks for free. Get started today.

The post Announcing Databricks Runtime 5.5 and Runtime 5.5 for Machine Learning appeared first on Databricks.

Viewing all 1999 articles
Browse latest View live