Quantcast
Channel: Databricks
Viewing all 1873 articles
Browse latest View live

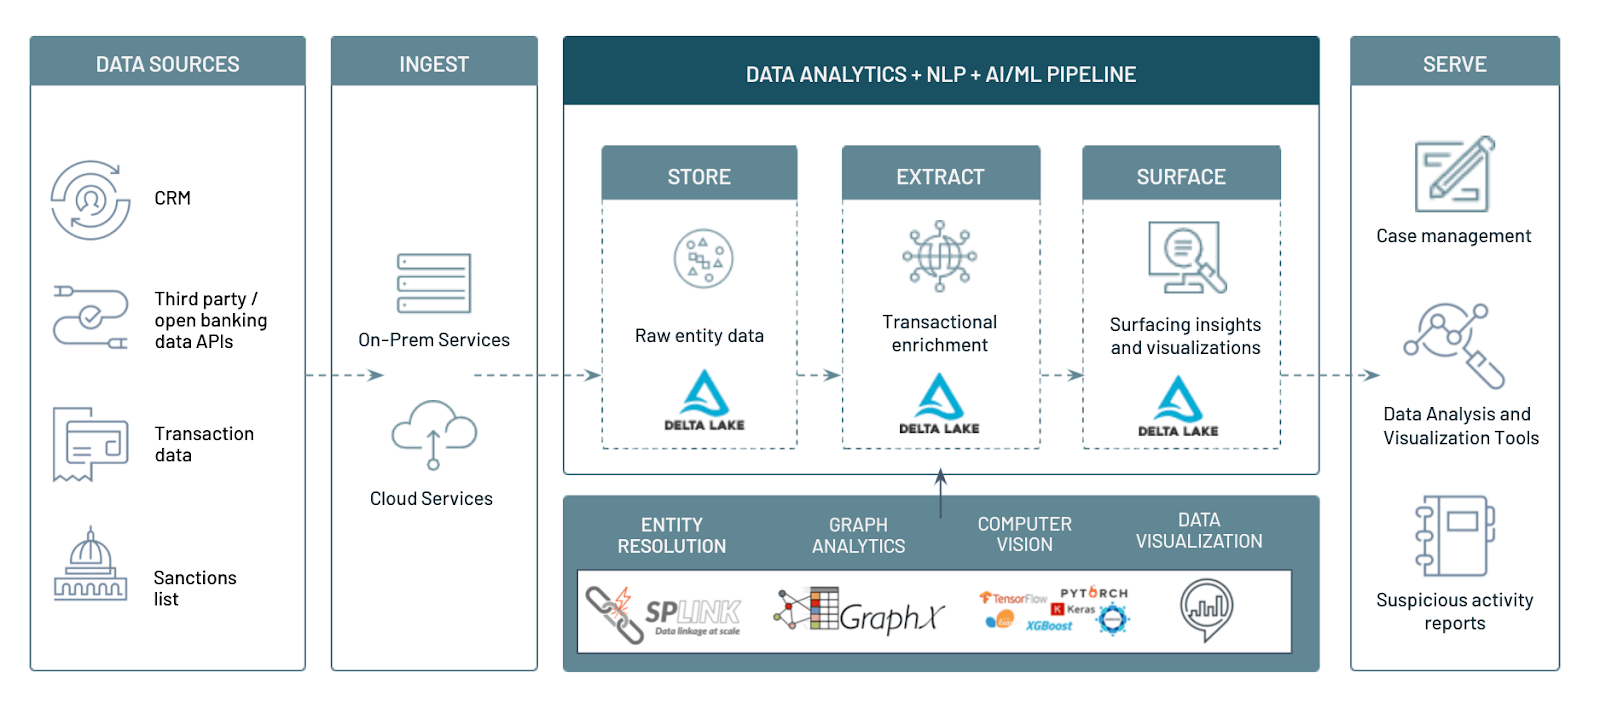
AML Solutions at Scale Using Databricks Lakehouse Platform

$
0
0

Anti-Money Laundering (AML) compliance has been undoubtedly one of the top agenda items for regulators providing oversight of financial institutions across the globe. As AML evolved and became more sophisticated over the decades, so have the regulatory requirements designed to counter modern money laundering and terrorist financing schemes. The Bank Secrecy Act of 1970 provided guidance and framework for financial institutions to put in proper controls to monitor financial transactions and report suspicious fiscal activity to relevant authorities. This law provided set the framework for how financial institutes combat money laundering and financial terrorism.

Why anti-money laundering is so complex

Current AML operations bear little resemblance to those of the last decade. The shift to digital banking, with financial institutions (FI’s) processing billions of transactions daily, has resulted in the ever increasing  scope of money laundering,  even with stricter transaction  monitoring systems and robust Know Your Customer (KYC) solutions. In this blog, we  share our experiences working with our FI customers to build  enterprise-scale AML solutions on the  lakehouse platform that both provides strong oversight and delivers innovative, scalable solutions to adapt to the reality of modern online money laundering threats.

Building an AML solution with lakehouse

The operational burden of processing billions of transactions a day comes from the need to store the data from multiple sources and power intensive, next-gen AML solutions. These solutions provide powerful risk analytics and reporting while supporting the use of  advanced machine learning models to reduce false positives and improve downstream investigation efficiency. FIs have already taken steps to solve the infrastructure and scaling problems by moving from on-premises to cloud for better security, agility and the economies of scale required to store massive amounts of data.

But then there is the issue of how to make sense of the massive amounts of structured and unstructured data collected and stored on cheap object storage. While cloud vendors provide an inexpensive way to store the data, making sense of the data for downstream AML risk management and compliance activities starts with storage of the data in high-quality and performant formats for downstream consumption. The Databricks Lakehouse Platform does exactly this. By combining the low storage cost benefits of data lakes with the robust transaction capabilities of data warehouses, FIs can truly build the modern AML platform.

On top of the data storage challenges outlined above, AML analysts face some key domain-specific challenges:

  • Improve time-to-value parsing unstructured data such as images, textual data and network links
  • Reduce DevOps burden for supporting critical ML capabilities such as entity resolution, computer vision and graph analytics on entity metadata
  • Break down silos by introducing analytics engineering and dashboarding layer on AML transactions and enriched tables

Luckily, Databricks helps solve these by leveraging Delta Lake to store and combine both unstructured and structured data to build entity relationships; moreover, Databricks’ Delta engine provides efficient access using the new Photon compute to speed up BI queries on tables. On top of these capabilities, ML is a first-class citizen in lakehouse, which means analysts and data scientists do not waste time subsampling or moving data to share dashboards and stay one-step ahead of bad actors.

AML Lakehouse Reference Architecture

Detecting AML patterns with graph capabilities

One of the main data sources that AML analysts use as part of a case is transaction data. Even though this data is tabular and easily accessible with SQL, it becomes cumbersome to track chains of transactions that are three or more layers deep with SQL queries. For this reason, it is important to have a flexible suite of languages and APIs to express simple concepts such as a connected network of suspicious individuals transacting illegally together. Luckily, this is simple to accomplish using GraphFrames, a graph API pre-installed in the Databricks Runtime for Machine Learning. 

In this section, we will show how graph analytics can be used to detect AML schemes such as synthetic identity and layering / structuring. We are going to utilize a dataset consisting of transactions, as well as entities derived from transactions, to detect the presence of these patterns with Apache Spark™, GraphFrames and Delta Lake. The persisted patterns are saved in Delta Lake so that Databricks SQL can be applied on the gold-level aggregated versions of these findings, offering the power of graph analytics to end-users.

Scenario 1 — Synthetic identities

As mentioned above, the existence of synthetic identities can be a cause for alarm. Using graph analysis, all of the entities from our transactions can be analyzed in bulk to detect a risk level. In our analysis, this is done in three phases:

  1. Based on the transaction data, extract the entities
  2. Create links between entities based on address, phone number or email
  3. Use GraphFrames connected components to determine whether multiple entities (identified by an ID and other attributes above) are connected via one or more links.

Based on how many connections (i.e. common attributes) exist between entities, we can assign a lower or higher risk score and create an alert based on high-scoring groups. Below is a basic representation of this idea.

Based on how many connections (i.e. common attributes) exist between entities, we can assign a lower or higher AML risk score

First, we create an identity graph using an address, email and phone number to link individuals if they match any of these attributes.

e_identity_sql = '''
select entity_id as src, address as dst from aml.aml_entities_synth  where address is not null
UNION
select entity_id as src, email as dst from aml.aml_entities_synth  where email_addr is not null
UNION
select entity_id as src, phone as dst from aml.aml_entities_synth  where phone_number is not null
'''

from graphframes import *
from pyspark.sql.functions import *
aml_identity_g = GraphFrame(identity_vertices, identity_edges)
result = aml_identity_g.connectedComponents()

result \
 .select("id", "component", 'type') \
 .createOrReplaceTempView("components")

Next, we’ll run queries to identify when two entities have overlapping personal identification and scores. Based on the results of these querying graph components, we would expect a cohort consisting of only one matching attribute (such as address), which isn’t  too much cause for concern. However, as more attributes match, we should expect to be alerted. As shown below, we can flag cases where all three attributes match, allowing SQL analysts to get daily results from graph analytics run across all entities.

Sample query visualization identifying when two entities have overlapping personal identification and scores.

Scenario 2 – Structuring

Another common pattern is called structuring, which occurs when multiple entities collude and send smaller ‘under the radar’ payments to a set of banks, which subsequently route larger aggregate amounts to a final institution (as depicted below on the far right). In this scenario, all parties have stayed under the $10,000 threshold amount, which would typically alert authorities. Not only is this easily accomplished with graph analytics, but the motif finding technique can be automated to extend to other permutations of networks and locate other suspicious transactions in the same way.

 A common pattern is called structuring. This is when in which multiple entities send collude and send smaller ‘under the radar’ payments to a set of banks, which subsequently route larger aggregate amounts to a final institution

Now we’ll write the basic motif-finding code to detect the scenario above using graph capabilities. Note that the output here is semi-structured JSON; all data types, including unstructured types,  are easily accessible in the lakehouse — we will save these particular results for SQL reporting.

motif = "(a)-[e1]->(b); (b)-[e2]->(c); (c)-[e3]->(d); (e)-[e4]->(f); (f)-[e5]->(c); (c)-[e6]->(g)"
struct_scn_1 = aml_entity_g.find(motif)

joined_graphs = struct_scn_1.alias("a") \
 .join(struct_scn_1.alias("b"), col("a.g.id") == col("b.g.id")) \
 .filter(col("a.e6.txn_amount") + col("b.e6.txn_amount") > 10000)

Using motif finding, we extracted interesting patterns where money is flowing through 4 different entities and kept under a $10,000 threshold. We join our graph metadata back to structured datasets to generate insights for an AML analyst to investigate further.

Identifying possible structuring through graph motif finding

Scenario 3 — Risk score propagation

The identified high-risk entities will have an influence (a network effect) on their circle. So, the risk score of all the entities that they interact with must be adjusted to reflect the zone of influence. Using an iterative approach, we can follow the flow of transactions to any given depth and adjust the risk scores of others affected in the network. As mentioned previously, running graph analytics avoids multiple repeated SQL joins and complex business logic, which can impact performance due to memory constraints. Graph analytics and Pregel API was built for that exact purpose. Initially developed by Google, Pregel allows users to recursively “propagate” messages from any vertex to its corresponding neighbours, updating vertex state (their risk score here) at each step. We can represent our dynamic risk approach using Pregel API as follows.

Using graph analytics and Pregel API to detect how entities spread AML risk throughout a network.

The diagram above shows the starting state of the network and two subsequent iterations. Say we started with one bad actor (Node# 3) with a risk score of 10. We want to penalize all the people who transact with that node (namely Nodes 4, 5 and 6) and receive funds by passing on, for instance, half the risk score of the bad actor, which then is added to their base score. In the next iteration, all nodes that are downstream from Nodes 4, 5, 6 will get their scores adjusted.

Node # Iteration #0 Iteration #1 Iteration #2
1 0 0 0
2 0 0 0
3 10 10 10
4 0 5 5
5 0 5 5
6 0 5 5
7 0 0 5
8 0 0 0
9 0 0 2.5
10 0 0 0


Using the Pregel API from GraphFrame, we can do this computation and persist the modified scores for other applications downstream to consume.

from graphframes.lib import Pregel

ranks = aml_entity_g.pregel \
    .setMaxIter(3) \
    .withVertexColumn(
       "risk_score", 
       col("risk"), 
       coalesce(Pregel.msg()+ col("risk"),
       col("risk_score"))
    ) \
    .sendMsgToDst(Pregel.src("risk_score")/2 )  \
    .aggMsgs(sum(Pregel.msg())) \
    .run()

Address matching

A pattern we want to briefly touch upon is address matching of text to actual street view images. Oftentimes, there is a need for an AML analyst to validate the legitimacy of addresses that are linked to entities on file. Is this address a commercial building, a residential area or a simple postbox? However, analysing pictures is often a tedious, time-consuming and manual process to obtain, clean and validate. A  lakehouse data architecture allows us to automate most of this task using Python and ML runtimes with PyTorch and pre-trained open-source models. Below is an example of a valid address to the human eye. To automate validation, we will use a pre-trained VGG model for which there are hundreds of valid objects we can use to detect a residence.

Valid residential image on the left. Invalid residential address on the right-hand side indicating potential higher risk.

Using the code below, which can be automated to run daily, we’ll now have a label attached to all our images — we’ve loaded all the image references and labels up into a SQL table for simpler querying also. Notice in the code below how simple it is to query a set of images for the objects inside them — the ability to query such unstructured data with Delta Lake is an enormous time-saver for analysts, and speeds up the validation process to minutes instead of days or weeks.

from PIL import Image
from matplotlib import cm

img = Image.fromarray(img)
...

vgg = models.vgg16(pretrained=True)
prediction = vgg(img)
prediction = prediction.data.numpy().argmax()
img_and_labels[i] = labels[prediction]

As we start to summarize, we notice some interesting categories appear. As seen below from the breakdown, there are a few obvious labels such as patio, mobile home and motor scooter we would expect to see as items detected in a residential address. On the other hand, the CV model has labeled a solar dish from surrounding objects in one image. (note: since we are restricted to an open source model not trained on a custom set of images, the solar dish label is not accurate.) Upon further analysis of the image, we drill down and immediately see that i) there is not a real solar dish here and more importantly ii) this address is not a real residence (pictured in our side-by-side comparison above). The Delta Lake format allows us to store a reference to our unstructured data along with a label for simple querying in our classification breakdown below.

The power of Delta Lake allows us to store a reference to our unstructured data along with a label for simple querying in our classification breakdown below

Sample AML solution address validation visualization, displaying the label attached to each analyzed image.

Entity resolution

The last category of AML challenges that we’ll focus on is entity resolution. Many open-source libraries tackle this problem, so for some basic entity fuzzy matching, we chose to highlight Splink, which  achieves the linkage at scale and offers configurations to specify matching columns and blocking rules.

In the context of the entities derived from our transactions, it is a simple exercise to insert our Delta Lake transactions into the context of Splink.

settings = {
  "link_type": "dedupe_only",
  "blocking_rules": [
      "l.txn_amount = r.txn_amount",
  ],
  "comparison_columns": [  
      {
          "col_name": "rptd_originator_address",
      },
      {
          "col_name": "rptd_originator_name",
      }
  ]
}

from splink import Splink
linker = Splink(settings, df2, spark)
df2_e = linker.get_scored_comparisons()

Splink works by assigning a match probability that can be used to identify transactions in which entity attributes are highly similar, raising a potential alert with respect to a reported address, entity name or transaction amount. Given the fact that entity resolution can be highly manual for matching account information, having open-source libraries that automate this task and save the information in Delta Lake can make investigators much more productive for case resolution. While there are several options available for entity matching, we recommend using Locality-Sensitive Hashing (LSH) to identify the right algorithm for the job. You can learn more about LSH and its benefits in this blog post.

As reported above, we quickly found some inconsistencies for the NY Mellon bank address, with “Canada Square, Canary Wharf, London, United Kingdom” similar to “Canada Square, Canary Wharf, London, UK”. We can store our de-duplicated records back to a delta table that can be used for AML investigation.

Deduplicating matching entities

AML lakehouse dashboard

Databricks SQL on the lakehouse is closing the gap with respect to traditional data warehouses in terms of simplified data management, performance with new query engine Photon and user concurrency. This is important since many organizations do not have the budget for overpriced proprietary AML software to support the myriad use cases, such as combatting the financing of terrorism (CFT), that help fight financial crime. In the market, there are dedicated solutions that can perform the graph analytics above, dedicated solutions to address BI in a warehouse, and dedicated solutions for ML. The AML lakehouse design unifies all three. AML data platform teams can leverage Delta Lake at the lower cost of cloud storage while easily integrating open source technologies to produce curated reports based on graph technology, computer vision and SQL analytics engineering. Below we will show a materialization of the reporting for AML.

The attached notebooks produced a transactions object, entities object, as well as summaries such as structuring prospects, synthetic identity tiers and address classifications using pre-trained models. In the Databricks SQL visualization below, we used our Photon SQL engine to execute summaries on these and built-in visualization to produce a reporting dashboard within minutes. There are full ACLs on both tables, as well as the dashboard itself, to allow users to share with executives and data teams —  a scheduler to run this report periodically is also built-in. The dashboard is a culmination of AI, BI and analytics engineering built into the AML solution.

The dashboard is a culmination of AI, BI, and analytics engineering we have built into the AML solution.

The open banking transformation

The rise of open banking enables FIs to provide a better customer experience via data sharing between consumers, FIs and third-party service providers through APIs. An example of this is Payment Services Directive (PSD2), which transformed financial services in the EU region as part of Open Banking Europe regulation. As a result, FIs have access to more data from multiple banks and service providers, including customer account and transaction data. This trend has expanded within the world of fraud and financial crimes with the latest guidance from FinCEN under section 314(b) of USA Patriot Act;  covered FIs can now share information with other FIs and within domestic and foreign branches regarding individuals, entities, organizations and so on that are suspected to be involved in potential money laundering.

While information sharing provision helps with transparency and protects the United States financial systems against money laundering and terrorism financing, the information exchange must be done using protocols with proper data and security protections. To solve the problem of securing information sharing, Databricks recently announced Delta Sharing, an open and secure protocol for data sharing. Using familiar open source API’s, such as Pandas and Spark, data producers and consumers can now share data using secure and open protocols and maintain a full audit of all the data transactions to maintain compliance with FinCEN regulations.

AML Intra-Organizational Data Sharing

Conclusion

The lakehouse architecture is the most scalable and versatile platform to enable analysts in their AML analytics. Lakehouse supports use cases ranging from fuzzy match to image analytics to BI with built-in dashboards, and all of these capabilities will allow organizations to reduce total cost of ownership compared to proprietary AML solutions. The Financial Services team at Databricks is working on a variety of business problems in the Financial Services space and enabling data engineering and data science professionals to start the Databricks journey through Solution Accelerators like AML.

Try the below notebooks on Databricks to accelerate your AML development strategy today and contact us to learn more about how we assist customers with similar use cases.


Unlocking The Power of Health Data With a Modern Data Lakehouse

$
0
0

A single patient produces approximately 80 megabytes of medical data every year. Multiply that across thousands of patients over their lifetime, and you’re looking at petabytes of patient data that contains valuable insights. Unlocking these insights can help streamline clinical operations, accelerate drug R&D and improve patient health outcomes. But first, the data needs to be prepared for downstream analytics and AI. Unfortunately, most healthcare and life science organizations spend an inordinate amount of time simply gathering, cleaning and structuring their data.

Health data is growing exponentially with a single patient producing over 80 megabytes of data a year

Health data is growing exponentially with a single patient producing over 80 megabytes of data a year

Challenges with data analytics in healthcare and life sciences

There are lots of reasons why data preparation, analytics and AI are a challenge for organizations  in the healthcare industry, many of which are related to investments in legacy data architectures built on data warehouses. Here are the four common challenges we see in the industry:

Challenge #1 (Volume): Scaling for rapidly growing health data

Genomics is perhaps the single best example of the explosive growth in data volume in healthcare. The first genome cost more than $1B to sequence. Given the prohibitive costs, early efforts (and many efforts still) focused on genotyping, a process to look for specific variants in a very small fraction of a person’s genome, typically around 0.1%. That evolved to Whole Exome Sequencing, which covers the protein coding portions of the genome, still less than 2% of the entire genome. Companies now offer direct-to-consumer tests for Whole Genome Sequencing (WGS) that are less than $300 for 30x WGS. On a population level, the UK Biobank is releasing more than 200,000 whole genomes for research this year.  It’s not just genomics. Imaging, health wearables and electronic medical records are growing tremendously as well.

Scale is the name of the game for initiatives like population health analytics and drug discovery. Unfortunately, many legacy architectures are built on-premises and designed for peak capacity. This approach results in unused compute power (and ultimately wasted dollars) during periods of low usage nor does it scale quickly when upgrades are needed.

Challenge #2 (Variety): Analyzing diverse health data

Healthcare and life science organizations deal with a tremendous amount of data variety, each with its own nuances. It is widely accepted that over 80% of medical data is unstructured, yet most organizations still focus their attention on data warehouses designed for structured data and traditional SQL-based analytics. Unstructured data includes image data, which is critical to diagnose and measure disease progression in areas like oncology, immunology and neurology (the fastest growing areas of cost) and narrative text in clinical notes, which are critical to understanding the complete patient health and social history. Ignoring these data types, or setting them to the side, is not an option.

To further complicate matters, the healthcare ecosystem is becoming more interconnected, requiring stakeholders to grapple with new data types. For example, providers need claims data to manage and adjudicate risk-sharing agreements, and payers need clinical data to support processes like prior authorizations and drive quality measures. These organizations often lack data architectures and platforms to support these new data types.

Some organizations have invested in data lakes to support unstructured data and advanced analytics, but this creates a new set of issues. In this environment, data teams now need to manage two systems — data warehouses and data lakes — where data is copied across siloed tools resulting in data quality and management issues.

Challenge #3 (Velocity): Processing streaming data for real-time patient insights

In many settings, healthcare is a matter of life and death. Conditions can be very dynamic, and batch data processing — done even on a daily basis — often is not good enough. Access to the latest, up-to-the-second information is critical to successful interventional care. To save lives, streaming data is used by hospitals and national health systems for everything from predicting sepsis to implementing real-time demand forecasting for ICU beds.

Additionally, data velocity is a major component of the healthcare digital revolution. Individuals have access to more information than ever before and are able to influence their care in real time. For example, wearable devices — like the continuous glucose monitors provided by Livongo – stream real-time data into mobile apps that provide personalized behavioral recommendations.

Despite some of these early successes, most organizations have not designed their data architecture to accommodate streaming data velocity. Reliability issues and challenges integrating real-time data with historic data is inhibiting innovation.

Challenge #4 (Veracity): Building trust in healthcare data and AI

Last, but not least, clinical and regulatory standards demand the utmost level of data accuracy in healthcare. Healthcare organizations have high public health compliance requirements that must be met. Data democratization within organizations requires governance.

Additionally, organizations need good model governance when bringing artificial intelligence (AI) and machine learning (ML) into a clinical setting. Unfortunately, most organizations have separate platforms for data science workflows that are disconnected from their data warehouse. This creates serious challenges when trying to build trust and reproducibility in AI-powered applications.

Unlocking health data with a Lakehouse

The lakehouse architecture helps healthcare and life sciences organizations overcome these challenges with a modern data architecture that combines the low-cost, scalability and flexibility of a cloud data lake with the performance and governance of a data warehouse. With a lakehouse, organizations can store all types of data and power all types of analytics and ML in an open environment.

Deliver on all your healthcare and life sciences data analytics use cases with a modern Lakehouse architecture

Specifically, the lakehouse provides the following benefits for healthcare and life sciences organizations:

  • Organize all your health data at scale. At the core of the Databricks Lakehouse Platform is Delta Lake, an open-source data management layer, that provides reliability and performance to your data lake. Unlike a traditional data warehouse, Delta Lake supports all types of structured and unstructured data, and to make ingesting health data easy, Databricks has built connectors for domain-specific data types like electronic medical records and genomics. These connectors come packaged with industry-standard data models in a set of quick-start solution accelerators.  Additionally, Delta Lake provides built-in optimizations for data caching and indexing to significantly accelerate data processing speeds. With these capabilities, teams can land all their raw data in a single place and then curate it to create a holistic view of patient health.
  • Power all your patient analytics and AI. With all your data centralized in a lakehouse, teams can build powerful patient analytics and predictive models directly on the data. To build on these capabilities, Databricks provides collaborative workspaces with a full suite of analytics and AI tools and support for a broad set of programming languages — such as SQL, R, Python, and Scala. This empowers a diverse group of users, like data scientists, engineers, and clinical informaticists, to work together to analyze, model and visualize all your health data.
  • Provide real-time patient insights. The lakehouse provides a unified architecture for streaming and batch data. No need to support two different architectures nor wrestle with reliability issues. Additionally, by running the lakehouse architecture on Databricks, organizations have access to a cloud-native platform that auto-scales based on workload. This makes it easy to ingest streaming data and blend with petabytes of  historic data for near real-time insights at population scale.
  • Deliver data quality and compliance. To address data veracity, the lakehouse includes capabilities missing from traditional Data Lakes like schema enforcement, auditing, versioning and fine-grained access controls. An important benefit of the lakehouse is the ability to perform both analytics and ML on this same, trusted data source. Additionally, Databricks provides ML model tracking and management capabilities to make it easy for teams to reproduce results across environments and help meet compliance standards. All of these capabilities are provided in a HIPAA-compliant analytics environment.

This lakehouse is the best architecture for managing healthcare and life sciences data. By marrying this architecture with the capabilities of Databricks, organizations can support a wide range of highly impactful use cases, from drug discovery through chronic disease management programs.

Get started building your Lakehouse for Healthcare and Life Sciences

As mentioned above, we are pleased to make available a series of solution accelerators to help Healthcare and Life Sciences organizations get started building a Lakehouse for their specific needs. Our solution accelerators include sample data, prebuilt code and step-by-step instructions within a Databricks notebook.

  • New Solution Accelerator: Lakehouse for Real-world Evidence. Real-world data provides pharmaceutical companies with new insights into patient health and drug efficacy outside of a trial. This accelerator helps you build a Lakehouse for Real-world Evidence on Databricks. We’ll show you how to ingest sample EHR data for a patient population, structure the data using the OMOP common data model and then run analyses at scale like investigating drug prescription patterns.

Check out the Lakehouse for Real-world Evidence notebooks.

  • Coming Soon: Lakehouse for Population Health. Healthcare payors and providers need real-time insights on patients to make more informed decisions. In this accelerator, we will show you how to easily ingest streaming HL7 data on Databricks and build powerful ML models for use cases like predicting patient disease risk.

Learn more about all of our Healthcare and Life Sciences solutions.

--

Try Databricks for free. Get started today.

The post Unlocking The Power of Health Data With a Modern Data Lakehouse appeared first on Databricks.

How Databricks’ Data Team Built a Lakehouse Across 3 Clouds and 50+ Regions

$
0
0

The internal logging infrastructure at Databricks has evolved over the years and we have learned a few lessons along the way about how to maintain a highly available log pipeline across multiple clouds and geographies. This blog will give you some insight as to how we collect and administer real-time metrics using our Lakehouse platform, and how we leverage multiple clouds to help recover from public cloud outages.

When Databricks was founded, it only supported a single public cloud. Now, the service has grown to support the 3 major public clouds (AWS, Azure, GCP) in over 50 regions around the world. Each day, Databricks spins up millions of virtual machines on behalf of our customers. Our data platform team of less than 10 engineers is responsible for building and maintaining the logging telemetry infrastructure, which processes half a petabyte of data each day. The orchestration, monitoring, and usage is captured via service logs that are processed by our infrastructure to provide timely and accurate metrics. Ultimately, this data is stored in our own petabyte-sized Delta Lake. Our Data Platform team uses Databricks to perform inter-cloud processing so that we can federate data where appropriate, mitigate recovery from a regional cloud outage, and minimize disruption to our live infrastructure.

Pipeline Architecture

Each cloud region contains its own infrastructure and data pipelines to capture, collect, and persist log data into a regional Delta Lake. Product telemetry data is captured across the product and within our pipelines by the same process replicated across every cloud region. A log daemon captures the telemetry data and it then writes these logs onto a regional cloud storage bucket (S3, WASBS, GCS). From there, a scheduled pipeline will ingest the log files using Auto Loader (AWS | Azure | GCP), and write the data into a regional Delta table. A different pipeline will read data from the regional delta table, filter it, and write it to a centralized delta table in a single cloud region.

Databricks Lakehouse pipeline architecture

Before Delta Lake

Prior to Delta Lake, we would write the source data to its own table in the centralized lake, and then create a view which was a union across all of those tables. This view needed to be calculated at runtime and became more inefficient as we added more regions:

CREATE OR REPLACE VIEW all_logs AS
SELECT * FROM (
  SELECT * FROM region_1.log_table
  UNION ALL
  SELECT * FROM region_2.log_table
  UNION ALL
  SELECT * FROM region_3.log_table
  ...
);

After Delta Lake

Today, we just have a single Delta Table that accepts concurrent write statements from over 50 different regions. While simultaneously handling queries against the data. It makes querying the central table as easy as:

SELECT * FROM central.all_logs;

The transactionality is handled by Delta Lake. We have deprecated the individual regional tables in our central Delta Lake and retired the UNION ALL view. The following code is a simplified representation of the syntax that is executed to load the data approved for egress from the regional Delta Lakes to the central Delta Lake

spark.readStream.format("delta")
  .load(regional_source_path)
  .where(“egress_approved = true”)
  .writeStream
  .format("delta")
  .outputMode("append")
  .option("checkpointLocation", checkpoint_path)
  .start(central_target_path)

Disaster recovery

One of the benefits of operating an inter-cloud service is that we are well positioned for certain disaster recovery scenarios. Although rare, it is not unheard of for the compute service of a particular cloud region to experience an outage. When that happens, the cloud storage is accessible, but the ability to spin up new VMs is hindered. Because we have engineered our data pipeline code to accept configuration for the source and destination paths, this allows us to quickly deploy and run data pipelines in a different region to where the data is being stored. The cloud for which cloud the cluster is created in is irrelevant to which cloud the data is read or written to.

There are a few datasets which we safeguard against failure of the storage service by continuously replicating the data across cloud providers. This can easily be done by leveraging Delta deep clone functionality as described in this blog. Each time the clone command is run on a table, it updates the clone with only the incremental changes since the last time it was run. This is an efficient way to replicate data across regions and even clouds.

Minimizing disruption to live data pipelines

Our data pipelines are the lifeblood of our managed service and part of a global business that doesn’t sleep. We can’t afford to pause the pipelines for an extended period of time for maintenance, upgrades, or backfilling of data. Recently, we needed to fork our pipelines to filter a subset of the data normally written to our main table to be written to a different public cloud. We were able to do this without disrupting business as usual.

By following these steps we were able to deploy changes to our architecture into our live system without causing disruption.

First, we performed a deep clone of the main table to a new location on the other cloud. This copies both the data and the transaction log in a way to ensure consistency.

Second, we released the new config to our pipelines so that the majority of data continues to be written to the central main table, and the subset of data writes to the new cloned table in the different cloud. This change can be made easily by just deploying a new config, and the tables receive updates for just the new changes they should receive.

Next, we ran the same deep clone command again. Delta Lake will only capture and copy the incremental changes from the original main table to the new cloned table. This essentially backfills the new table with all the changes to the data between step 1 and 2.

Finally, the subset of data can be deleted from the main table and the majority of data can be deleted from the cloned table.

Now both tables represent the data they are meant to contain, with full transactional history, and it was done live without disrupting the freshness of the pipelines.

Summary

Databricks abstracts away the details of individual cloud services whether that be for spinning up infrastructure with our cluster manager, ingesting data with Auto Loader, or performing transactional writes on cloud storage with Delta Lake. This provides us with an advantage in that we can use a single code-base to bridge the compute and storage across public clouds for both data federation and disaster recovery. This inter-cloud functionality gives us the flexibility to move the compute and storage wherever it serves us and our customers best.

--

Try Databricks for free. Get started today.

The post How Databricks’ Data Team Built a Lakehouse Across 3 Clouds and 50+ Regions appeared first on Databricks.

The Three Things CXO’s Prioritize in Their Data and AI Strategy

$
0
0

Leveraging data (internal and external) and customer analytics to innovate and create competitive advantages is more powerful than it has ever been. This popular practice is fueled by the growing volume of operational and customer data and technological advancements that make extracting value from data even faster and more accessible. Driving more value from all data feels even more urgent when considering that experts predict that analytics and AI will create $15.4 trillion by 2030, as reported by McKinsey & Company. Yes, that’s right, $15.4 TRILLION!

When it comes to their data and AI strategy, every CXO aims to accomplish three things: get better insights from data, reduce risks, and control costs. Ultimately, this focus is the key to becoming part of the 13% of organizations that are succeeding on their data strategy (MIT Tech Review, 2021).

So, how are they delivering on this goal? In this blog post, we’ll dive deeper into the three focus areas for CXOs and how the lakehouse architecture can help drive an enterprise data and AI strategy that enables transformation.

Top strategic goals of the modern CXO

Better insights to increase business impact

Organizations are now collecting more data across more data types than ever before with the goal to leverage all data sets and data assets to generate better actionable insights within the organization and  make better business decisions. The typical CXO is now not only looking at traditional structured information, such as purchase and CRM data, but also semistructured data, like customer interactions from web and mobile properties, and more increasingly unstructured data, such as social media posts or customer service chat or phone logs. The application of the data now extends beyond traditional SQL and business intelligence (BI) reporting but increasingly shifting to do more with artificial intelligence and machine learning (AI/ML).  Within enterprises, there’s a push to move away from very complex and expensive on-premises architectures  (e.g., Hadoop) and disparate tools to a more streamlined, lower-cost approach focused on improving the user experience and increasing collaboration across data personas.

Reduce risks from weak data management

Organizations need to be able to reduce the risks associated with data management to minimize the threat of cyber attacks by having a consistent way to store, process, manage and secure data. But they also need to adhere to the growing data privacy regulations like GDPR and CCPA, as well as contend with new privacy directives, like those issued by Google and Apple, which effectively eliminate third-party reporting sources. Ultimately, CXOs need a consistent way to store, process, manage, secure and leverage ALL their data, to not only mitigate risk but also take advantage of new and unexplored data sources that can replace traditional customer behavioral, demographic, and interaction intel.

Control costs

The on-premise data architectures that many organizations currently rely on are expensive. There are a lot of moving parts, overhead from operations and maintenance and an overwhelming number of vendor agreements locked in. What’s the alternative? To truly drive modern data and AI initiatives, data leaders need a simplified cloud architecture that executes more of the data workloads with a less complex environment. In turn, CXOs have stronger control over their costs as they move forward with their transformation. Simpler architectures also mean more agility for CXOs and their teams to iterate and produce actionable insights without delay or IT intervention.

Driving enterprise data initiatives with a lakehouse architecture

Legacy architectures have done a great job at serving the needs of enterprises when data came in batches and lacked data types and complexity. The lakehouse architecture delivers on the shortcomings of legacy architectures while reducing complexity. Lakehouse architecture combines the best elements of data lakes and data warehouses — delivering data management and performance typically found in data warehouses with the low-cost, flexible object stores offered by data lakes— enabling the full range of analytics and ML workloads. This helps to not only control costs but also increase the performance of the architecture to do more faster.

By having a simplified data architecture, CXOs can operate their organizations with more confidence in reduced risk by enabling fine-grained access controls for data governance across clouds, functionality typically not possible with siloed data across data warehouses and data lakes. Furthermore, organizations can quickly and accurately update data in your data lake to comply with regulations like GDPR and maintain better data governance through audit logging, automatic data testing, and deep visibility into the ETL process for monitoring and recovery.

The unified approach also eliminates data silos that traditionally separated analytics, data science and machine learning. When brought to life in platforms like the Databricks Lakehouse Platform, native collaborative capabilities across clouds accelerate the ability to work across teams and innovate faster in a highly secure and scalable data and AI infrastructure.

A modern architecture alone isn’t enough – the data and AI strategy matters

The most critical step for CXOs to enable data and AI at scale is to develop a comprehensive strategy for how their organization will leverage people, processes, data and technology to drive measurable business results, such as increased sales or customer loyalty and business priorities. The strategy serves as a set of principles that every member of your customer experience team can refer to when making decisions. The strategy should cover the responsibilities of roles within your team for how you capture, store, curate and process data to run your unit— including the resources (labor and budget) needed to be successful. The strategy should clearly answer these questions and more and should be captured in a living document, owned and governed by the CXOs, and made available for everyone on the team to review and provide feedback. The strategy will evolve based on the changing business and/or technology landscape — but it should serve as the North Star for how the team will navigate the many decisions and tradeoffs that you will need to make over the course of the transformation. Download the eBook,” Enable Data and AI at Scale to Transform Your Organization” to get comprehensive guidance on building out an effective and executable strategy.

--

Try Databricks for free. Get started today.

The post The Three Things CXO’s Prioritize in Their Data and AI Strategy appeared first on Databricks.

Top Considerations When Migrating Off of Hadoop

$
0
0

Apache Hadoop was created more than 15 years ago as an open source, distributed storage and compute platform designed for large data sets and large-scale batch processing. Early on, it was cheaper than traditional data storage solutions. At the time, businesses didn’t need to run it on particular hardware. The Hadoop ecosystem also consists of multiple open source projects, and it can be deployed both on-premises and in the cloud, but it’s complex.

But 15-year-old technology isn’t designed for the workloads of today. When it comes down to it, Hadoop is a highly engineered system with a zoo of technologies. It’s resource-intensive with the need for highly skilled people to manage and operate the environment. With data growth and the need for more advanced analytics like AI/ML, we’ve seen very few advanced analytic projects deployed in production on Hadoop. Lastly, it failed to support the fundamentals of analytics as well. In a previous blog, we explored the high financial and resource taxes of running Hadoop; the environment is fixed, services are operating 24/7, the environment is sized for peak processing, can be costly to upgrade, and is maintenance-intensive. Organizations need dedicated teams to keep the lights on, and the system’s fragility affects their ability to get value from all their data.

Effectively tapping into AI/ML and the value of all your data requires a modernized architecture. This blog will walk through how to do just that and the top considerations when organizations plan their migration off of Hadoop.

Importance of modernizing the data architecture 

An enterprise-ready modern cloud data and AI architecture provides seamless scale and high performance, which go hand in hand with the cloud in a cost-effective way.  Performance is often underestimated as a criterion, but the shorter the execution time, the lower the cloud costs.

It also needs to be simple to administer so that data teams can focus more on building out use cases, not managing infrastructure. And the architecture needs to provide a reliable way to deal with all kinds of data to enable predictive and real-time analytics use cases to drive innovation. Enter the Databricks Lakehouse Platform, built from the ground up on the cloud supporting \AWS)\, \ Azure, and\ GCP. It’s a managed collaborative environment that unifies data processing, analytics via Databricks SQL, advanced analytics like data science and machine learning (ML) with real-time streaming data. This removes the need to stitch multiple tools and worry about disjointed security or move data around — data resides in the organizations’ cloud storage within Delta Lake. Everything is in open format accessed by open source tooling, enabling organizations to maintain complete control of their data and code.

Top considerations when planning your migrating off of Hadoop

Top considerations when organizations are planning their migration off of Hadoop

Internal questions

Let’s start by talking about planning the migration. There are several things data teams, CIOs, and CDOs need to go through, as with any journey. Most will start with the questions, where am I now? Where do I need to go? They then assess the composition of the current infrastructure and plan for the new world along the way. There will be a lot of new learnings and self-discovery that happens at this point. Data teams will test and validate some assumptions. And finally, they can execute the migration itself. A set of questions organizations should ask before starting the migration include:

  • Why do we want to migrate? The value is no longer there, you’re not innovating as fast as your competition, the promise of Hadoop is no longer there. There’s a costly license renewal coming up at the end of life for a particular version of our Hadoop environment or a hardware refresh on the horizon that the CIO and CFO want to avoid. Possibly all of the above and more.
  • What are the desired start and end dates?
  • Who are the internal stakeholders needed for buy-in?
  • Who needs to be involved in every stage? This will help map what resources will be required.
  • Lastly, how does the migration fit into the overall cloud strategy? Is the organization going to AWS,  Azure, or GCP?

Migration assessment

Organizations must start by taking an inventory of all the migration items. Take note of the environment and various workloads, and then prioritize the use cases that need to be migrated. While a big bang approach is possible, a more realistic approach for most will be to migrate project by project. Furthermore, organizations will need to understand what jobs are running and what the code looks like. In most scenarios, organizations also have to build a business justification for the migration, including calculating the existing total cost of ownership and forecasting and the cost for Databricks itself. Lastly, organizations will have a better sense of their migration timeline and alignment with the originally planned schedule by completing the migration assessment.

Technical planning phase

The technical phase carries a significant amount of weight when it comes to Hadoop migration. Here, organizations need to think through their target architecture and ensure it will support the business for the long term. The general data flow will be similar to what is already there. In many cases, the process includes mapping older technologies to new ones or simply  and optimizing them. Organizations must also assess how to move their data to the cloud with the workloads. Will it be a lift and shift or perhaps something more transformative leveraging the new capabilities within Databricks? Or a hybrid of both? Other considerations include data governance and security, and the introduction of automation where possible, ensuring a smooth migration as it can be less prone to error and introduces repeatable processes. Here, organizations should also ensure that existing production processes are carried forward to the cloud, tying into existing monitoring and operations.

Evaluation and enablement

It’s essential to understand what the new platform has to offer and how things translate. Databricks is not Hadoop, but it provides similar functionality at greater performance and scale for all the data in data processing and data analytics. It’s also recommended to conduct some form of an evaluation, targeted demos, perhaps workshops, or jointly plan a production pilot to vet an approach for the environment.

Migration execution

The last consideration is executing the migration. Migration is never easy. However, getting it done right the first time is critical to the success of the modernization initiative and how quickly the organization can finally start to scale its analytics practices, cut costs and increase overall data team productivity. The organization should first deploy an environment, then migrate use case by use case, by moving across the data, then the code. To ensure business continuity, the organization should consider running workloads on both Hadoop and Databricks. Validation is required to ensure everything is identical in the new environment. When things are great, the decision can be made to cut over to Databricks and decommission the use case from Hadoop. Organizations will rinse and repeat across all the remaining use cases until they are all transferred across, after which the entire Hadoop environment can be decommissioned.

Migration off of Hadoop is not a question of ‘if’ but ‘when’

A lot of credit goes to Hadoop for the innovation it fueled from the time of its inception to even a few years ago. However, as organizations look to do more with their data, empower their data teams to do more analytics and AI, and less infrastructure maintenance and data management, the world of data and AI is in need of a Hadoop alternative. Organizations worldwide have realized that it’s no longer a matter of if migration is needed to stay competitive and innovate, but a matter of when. The longer organizations wait to evolve their data architecture to meet the growing customer expectations and competitive pressures, the further behind they fall while incurring increasing costs. As organizations begin their modernization journey, they need a step-wise approach that thoroughly explores each of the five considerations across the entire organization and not only within silos of the business. To learn more about the Databricks migration offerings, visit databricks.com/migration.

--

Try Databricks for free. Get started today.

The post Top Considerations When Migrating Off of Hadoop appeared first on Databricks.

Improving Patient Insights With Textual ETL in the Lakehouse Paradigm

$
0
0

This is a collaborative post from Databricks and Forest Rim Technology. We thank Bill Inmon, Founder and CEO, and Mary Levins, Chief Data Officer, of Forest Rim for their contributions.

 
The amount of healthcare data generated today is unprecedented and rapidly expanding with the growth in digital patient care. Yet much of the data remains unused after it is created. This is particularly true for the 80% of medical data that is unstructured in forms like text and images.

In a health system setting, unstructured provider notes offer an important trove of patient information.  For example, provider notes can contain patient conditions that are not otherwise coded in structured data, patient symptoms that can be signals of deteriorating status and disease, and patient social and behavioral history.

Every time a patient undergoes care, providers document the intricacies of that encounter. The amount of raw text and the nature of the language depends on the provider and many other factors. This creates a lot of variability in what text is captured and how it is presented. The collection of these raw text records serves as the basis for a patient’s medical history and provides immense value to both the individual patient and entire populations of patients. When records are examined collectively across millions of patients, researchers can identify patterns relating to the cause and progression of disease and medical conditions. This information is critical to delivering better patient outcomes.

Raw unstructured text data, such as provider notes, also contains very important information for patient care and medical research; however, textual data is usually filed away and goes untapped due to the complexity and time required to manually review it. Extracting information from textual provider notes, and combining it with more traditional structured data variables, offers the most complete view of the patient as possible. This is critical for everything from advancing clinical knowledge at the point of care and supporting chronic condition management to delivering acute patient interventions.

Challenges analyzing healthcare textual data

The challenge for health systems in making use of these data sets is that traditional data warehouses, which typically utilize relational databases, do not support semi-structured or unstructured data types. Standard technology handles structured data, numerical data and transactions quite well; however, when it comes to text, it fails at retrieving and analyzing the text. The lack of structure of the text defeats many of the advantages provided by the data warehouse.

A second reason why legacy data architectures do not lend themselves to the collective analysis of patient data is that most of the data resides on very different sources and proprietary technologies. These technologies simply were never designed to work seamlessly with other technologies, and often prohibit analysis of unstructured text at scale.

Furthermore, these legacy systems were never designed for big data, advanced analytical processing or machine learning. Built for SQL-based analytics these systems are suitable for reporting on events in the past, but do little in the way of providing predictions into the future which is critical to delivering on innovative new use cases.

Unlocking patient insights with Forest Rim Technology and Databricks Lakehouse Platform

Forest Rim Technology, the creators of Textual ETL, and Databricks can help healthcare organizations overcome the challenges faced by legacy data warehouses and proprietary data technologies. The path forward begins with the Databricks Lakehouse, a modern data platform that combines the best elements of a data warehouse with the low-cost, flexibility and scale of a cloud data lake. This new, simplified architecture enables health systems to bring together all their data — structured (e.g. diagnoses and procedure codes found in EMRs), semi-structured (e.g. organized textual notes), and unstructured (e.g. image or textual data) — into a single, high-performance platform for both traditional analytics and data science.

At the core of the Databricks Lakehouse platform is Delta Lake, an open-source storage layer that brings reliability and performance to data lakes. Healthcare organizations can land all of their data, including raw provider notes, into the Bronze ingestion layer of Delta Lake (pictured below). This preserves the original source of truth before applying any data transformations. By contrast, with a traditional data warehouse, transformations occur prior to loading the data. As such, all structured variables extracted from unstructured text are disconnected from the native text. The lakehouse architecture also provides a full suite of analytics and AI capabilities so organizations can begin exploring their data without replicating into another system.

The Delta Lake architecture allows data teams to incrementally improve the quality of their data until it is ready for consumption.

Forest Rim Technology builds on Databricks’ capabilities with Textual ETL, an advanced technology that reads raw, narrative text, such as that found in medical records, and refines that text into structured data that can easily be ingested into Delta Lake. Textual ETL is capable of converting unstructured medical notes that come from any electronically readable source into a structured format. Other capabilities of Textual ETL include homographic resolution and translating textual data in different languages. Currently Textual ETL supports many languages including English, Spanish, Portuguese, German, French, Italian and Dutch. Unstructured textual data can be processed into structured data securely, ensuring that any sensitive data is protected and governed. The combination of Databricks Lakehouse Platform and Textual ETL makes it possible to analyze data for a patient, a group of patients, an entire hospital or an entire country.

Forest Rim Technology builds on Databricks’ capabilities with Textual ETL, converting raw text into structured data that can easily be ingested into Delta Lake.

Analyzing medical records at scale with Textual ETL and Databricks Lakehouse

To demonstrate the power of Textual ETL in the Lakehouse architecture, Forest Rim and Databricks generated a large number of textual synthetic medical records using Synthea, the Synthetic Patient Population Simulator. The electronic textual medical records ranged in size, from 10 pages in length for a patient to more than 40 pages.

Textual ETL uses sophisticated ontologies and can disambiguate differences in medical terminology (for example, the abbreviation “HA” to a cardiologist means “heart attack” while the same abbreviation to other providers could mean “headache” or “Hepatitis A”). In this example, Forest Rim Technology deployed Textual ETL to identify and extract values from the text ranging from demographic (age, gender, geography and race) to medical (symptoms, conditions and medications). The resulting variables were then used as the input to a visualization tool to begin to explore the data. Databricks’ Lakehouse enables integration with business intelligence (BI) tools directly from Delta Lake to facilitate fast exploration and visualization of relationships in the data.

For this example, we focused on simulated records from the state of Alabama and could easily explore all the textual notes after processing the data using Textual ETL and connecting the structured results to Microsoft PowerBI. This enabled us to explore the data and understand the most frequently discussed topics between providers and patients, as well as specific distributions like immunizations.

Textual ETL and Databricks’ Lakehouse facilitates detailed drill downs, and we can easily explore correlations across domains such as medications and diseases by different parameters such as gender, age, geography and marital status, as seen in the GIF below.

Once the electronic textual medical records have been processed by Textual ETL, researchers,  analysts and data scientists can support everything from reporting through machine learning use cases or other advanced analytical tools. An additional advantage of Lakehouse is that the original notes reside in Delta Lake, enabling users to easily review the full patient record as needed (compared to data warehouses, where the full notes likely reside in a separate system).  Furthermore, the notes data can be linked to data from the structured record to reduce time for the clinician and improve overall patient care.

Databricks and Forest Rim Technology bring a shared vision to provide a trusted environment in which sensitive, unstructured healthcare data can be securely processed in Lakehouse for analytical research. As healthcare data continues to grow, this vision provides a trusted environment for deeper insights through Textual ETL while protecting the sensitive nature of healthcare information.

About Forest Rim Technology:  Forest Rim Technology was founded by Bill Inmon and is the world leader in converting textual unstructured data to a structured database for deeper insights and meaningful decisions.  The Forest Rim Medical Data mission is to enable governments and health institutions to use textual information for analytical research and patient care at a lower cost.

--

Try Databricks for free. Get started today.

The post Improving Patient Insights With Textual ETL in the Lakehouse Paradigm appeared first on Databricks.

Monitoring ML Models With Model Assertions

$
0
0

This is a collaborative post from Databricks and the Stanford University Computer Science Department. We thank Daniel Kang, Deepti Raghavan and Peter Bailis of Stanford University for their contributions.


Machine learning (ML) models are increasingly used in a wide range of business applications. Organizations deploy hundreds of ML models to predict customer churn, optimal pricing, fraud and more. Many of these models are deployed in situations where humans can’t verify all of the predictions – the data volumes are simply too large! As a result, monitoring these ML models is becoming crucial to successfully and accurately applying ML use cases.

In this blog post, we’ll show why monitoring models is critical and the catastrophic errors that can occur if we do not. Our solution leverages a simple, yet effective, tool for monitoring ML models we developed at Stanford University (published in MLSys 2020) called model assertions. We’ll also describe how to use our open-source Python library model_assertions to detect errors in real ML models.

Why we need monitoring

Let’s consider a simple example of estimating housing prices in Boston (dataset included in scikit-learn). This example is representative of standard use cases in the industry on a publicly available dataset. A data scientist might try to fit a linear regression model using features such as the average number of rooms to predict the price – such models are standard in practice. Using aggregate statistics to measure performance, like RMSE, shows that the model is performing reasonably well:

The model performance for test set
--------------------------------------
Root Mean Squared Error: 4.93
R^2: 0.67

Unfortunately, while this model performs well on average, it makes some critical mistakes:

Sample visualization for ML model demonstrating the risk of only looking at aggregated metrics.

As highlighted above, the model predicts negative housing prices for some of the data. Using this model for setting housing prices would result in giving customers cash to purchase a house! If we only look at the aggregate metrics for our models, we would miss errors like these.

While seemingly simple, these kinds of errors are ubiquitous when using ML models. In our full paper, we also describe how to apply model assertions to autonomous vehicle and vision data (with an example about predicting attributes of TV news anchors here).

Model assertions

In the examples above, we see that ML models widely used in practice can produce inconsistent or nonsensical results. As a first step toward addressing these issues, we’ve developed an API called model assertions.

Model assertions let data scientists, developers and domain experts specify when errors in ML models may be occurring. A model assertion takes the inputs and outputs of a model and returns records containing potential errors.

Tabular data

Let’s look at an example with the housing price prediction model above. As a simple sanity check, a data scientist specifies that housing price predictions must be positive. After specifying and registering the assertion, it will flag potentially erroneous data points:

from model_assertions.checker import Checker
from model_assertions.per_row import PerRowAssertion


# Define the prediction function in a standard way
def pred_fn(df, model=None):
    X = df.values
    y_pred = model.predict(X)
    return pd.DataFrame(y_pred, columns=['Price'])

# Define the assertion that outputs should be positive
def output_pos(_inp, out):
    return out[0] <= 0

# Define the checker and register the assertion
checker = Checker(name='Housing price checker', verbose=False)
output_pos_assertion = PerRowAssertion(output_pos)
checker.register_assertion(output_pos_assertion.get_assertion(), 'Output positive')

# Define the predictor and run the checker
predictor = functools.partial(pred_fn, model=lr)
predictor = checker.wrap(predictor)
_ = predictor(X_test)
checker.retrieve_errors()

OMG Databricks blog post code example

We can see that the model predicted two examples with negative prices! Now let’s look at a more complex example.

Autonomous vehicle and vision data

In many cases, models are used to predict over unstructured data to produce structured outputs. For example, autonomous vehicles predict pedestrian and car positions, and researchers studying TV news may be interested in predicting attributes of TV news anchors.

Many assertions over this data deal with the predicted attributes or the temporal nature of the data. As a result, we’ve designed a consistency API that allows users to specify that 1) attributes should be consistent with the same identifier (e.g., the person in a scene, bounding box) and 2) that identifiers should not change too rapidly. In the second case, we’re taking advantage of the strong temporal consistency present in many applications (e.g., that a person shouldn’t appear, disappear and reappear within 0.5 seconds).

As an example, we’re showing a vision and LIDAR model predicting trucks in the screenshot below. As you can see, the predictions are inconsistent; the prediction in green is from the vision model, and the prediction in purple is the LIDAR model.

Example computer vision and LIDAR model predicting trucks in the screenshot .

As another example, we’re showing a model predicting attributes about TV news anchors. The scene identifier tracks a person’s prediction across time. The news anchor’s name, gender and hair color are inconsistently predicted by the model. The gender or hair color shouldn’t change frame to frame!

Example ML model predicting attributes about TV news anchors.

# Hair color should not change for a person within a scene
hair_color_consistency = IdentifierConsistencyAssertion('scene_idenfier', 'hair_color')
# A scene_idenfier should not change too many times over frames
time_consistency = TimeConsistencyAssertion('scene_idenfier', 'frame')

# Create and register the assertions
checker = Checker(name='Consistency checker', verbose=False)
checker.register_assertion(hair_color_consistency.get_assertion())
checker.register_assertion(time_consistency.get_assertion())

The IdentifierConsistencyAssertion specifies that the attributes (hair_color) of a particular entity (scene_identifier) consistent, e.g., that a specific newscaster should have the same hair color in the same scene. The TimeConsistencyAssertion specifies that an entity (scene_identifier) should not appear and disappear too many times in a time window.

Using model assertions

We’ve implemented model assertions as a Python library. To use it in your own code, simply install the package

pip install model_assertions

Our library currently supports:

  • Per-row assertions (e.g., that the output should be positive).
  • Identifier consistency assertions that specify attributes of the same identifier should agree.
  • Time consistency assertions that specify entities should not appear and disappear too many times in a time window.

And we plan on adding more!

In our full paper, we show other examples of how to use model assertions, including in autonomous vehicles, video analytics and ECG applications. In addition, we describe how to use model assertions for selecting training data. Using model assertions to select training data can be up to 40% cheaper than standard methods of selecting training data. Instead of selecting data at random or via uncertainty, selecting “hard” data points (i.e. data points with errors or ones that trigger model assertions) can be more informative.

Try the notebooks:

Visit the GitHub repository for more details and examples. Please reach out to ddkang@stanford.edu if you have any questions, feedback or would like to contribute!

--

Try Databricks for free. Get started today.

The post Monitoring ML Models With Model Assertions appeared first on Databricks.

The Delta Between ML Today and Efficient ML Tomorrow

$
0
0

Delta Lake and MLflow both come up frequently in conversation but often as two entirely separate products. This blog will focus on the synergies between Delta Lake and MLflow for machine learning use cases and explain how you can leverage Delta Lake to deliver strong ML results based on solid data foundations.

If you are working as a data scientist, you might have your full modelling process sorted and potentially have even deployed a machine learning model into production using MLflow. You might have experimented using MLflow tracking and promoted models using the MLflow Model Registry. You are probably quite happy with the reproducibility this provides, as you are able to track things like code version, cluster set-up and also data location.

But what if you could reduce the time you spend on data exploration? What if you could see the exact version of the data used for development? What if the performance of a training job isn’t quite what you had hoped or you keep experiencing out of memory (OOM) errors?

All of these are valid thoughts and are likely to emerge throughout the ML development and deployment process. Coming up with a solution can be quite challenging, but one way to tackle some of these scalability problems is through using Delta Lake.

Delta Lake (Delta for short) is an open-source storage layer that brings reliability to your data lake. It does not require you to change your way of working or learn a new API to experience the benefits. This blog focuses on common problems experienced by data scientists and ML engineers and highlights how Delta can alleviate these.

My query is slow, but I don’t understand why.

Depending on the size of your dataset, you might find that learning more about your data is a time-consuming process. Even when parallelizing queries, different underlying processes might still make a query slow. Delta has an optimized Delta Engine, which adds performance to various types of queries, including ETL, as well as ad hoc queries that can be used for exploratory data analysis. If performance is still not as expected, the Delta format enables you to use the DESCRIBE DETAIL functionality. This allows you to quickly gain insight into the size of the table you are querying and how many files it consists of, as well as some of the key information regarding schema. In this way, Delta gives you the built-in tools to identify the performance problems from inside your notebook and abstract away some of the complexity.

The Delta Lake format enables you to use DESCRIBE DETAIL to quickly gain insight not only into the size of the table you are querying and how many files it consists of but also some of the key schema information.


Waiting for a query to run is a common issue and only gets worse as data volumes get increasingly large. Luckily, Delta provides some optimizations that you can leverage, such as data skipping. As our data grows and new data is inserted into a Databricks Delta table, file-level min/max statistics are collected for all the columns of supported types. Then, when you try to query the table, Databricks Delta first consults these statistics in order to determine which files can safely be skipped and which ones are relevant. Delta Lake on Databricks takes advantage of this information at query time to provide faster queries and it requires no configuration.

Another way to take advantage of the data skipping functionality is to explicitly advise Delta to optimize the data with respect to a column(s). This can be done with Z-Ordering, a technique to colocate related information in the same set of files. In simple terms, applying ZORDER BY on a column will help get your results back faster if you are repeatedly querying the table with a filter on that same column. This will hold true especially if the column has high cardinality, or in other words, a large number of distinct values.

Delta Lake’s Z-Ordering feature helps speed queries by determining which files can be safely skipped.

Finally, if you don’t know the most common predicates for the table or are in an exploration phase, you can just optimize the table by coalescing small files into larger ones. This will reduce the scanning of files when querying your data and, in this way, improve performance. You can use the OPTIMIZE command without specifying the ZORDER column.

Delta Lake OPTIMIZE coalesces small files into larger ones, reducing the number of files scanned for greater query performance.

If you have a large amount of data and only want to optimize a subset of it, you can specify an optional partition predicate using WHERE to indicate you only want to optimize a subset of the data (e.g. only recently added data).

If you only want to optimize a subset of your data, Delta Lake will allow you to specify an optional partition predicate using WHERE.

My data doesn’t fit in memory.

During model training, there are cases in which you may need to train a model on a specific subset of data or filter the data to be in a specific date range instead of the full dataset. The usual workflow would be to read all the data, at which point all the data is scanned and loaded in memory, and then keep the relevant part of it. If the process doesn’t break at this stage, it will definitely be very slow. But what about just reading the necessary files from the beginning and in this way not allowing your machine to overload with data that will be dropped anyway? This is where partition pruning can be very handy.

In simple terms, when talking about a partition, we are actually referring to the subdirectory for every distinct value of the partition column(s). If the data is partitioned on the columns you want to apply filters on, then pruning techniques will be utilized to read only the necessary files by just scanning the right subdirectory and ignoring the rest. This may seem like a small win, but if you factor in the number of iterations/reads required to finalize a model, then this becomes more significant. So understanding the frequent patterns of querying the data leads to better partition choices and less expensive operations overall.

Alternatively, in some cases, your data is not partitioned and you experience OOM errors, as your data simply does not fit in a single executor. Using a combination of DESCRIBE DETAIL, partitioning and ZORDER can help you understand if this is the cause of the error and  resolve it.

I spend half my days improving data quality.

It happens regularly that data teams are working with a dataset and find that variables hold erroneous data, for instance a timestamp from 1485. Identifying these data problems and removing values like this can be a cumbersome process. Removing these rows is often also costly from a computational perspective, as queries using .filter() can be quite expensive. In an ideal scenario, you would avoid erroneous data being added to a table entirely. This is where Delta Constraints and Delta Live Tables expectations can help. In particular, Delta Live Tables allow you to specify expected data quality and also what should happen to data that does not meet the requirement. Rather than removing the data retrospectively, you can now proactively keep your data clean and ready for use.

Delta for ML Draft code results example blog img


In a similar fashion, we might want to avoid people accidentally adding columns to the data we are using for modeling. Also here Delta offers a simple solution: automatic schema updates. By default, data written to a Delta table needs to adhere to the known schema unless otherwise specified.

Delta Lake automatic schema updates ensure schema compatibility  with the data being written.

If someone has changed the schema anyhow, this can be easily checked by using the describe detail command, followed by a DESCRIBE HISTORY to give a quick overview of what the schema looks like now and who might have changed the schema. This allows you to communicate with your fellow Data Scientist, Data Engineer or Data Analyst to understand why they made the change and whether that change was legitimate or not.

Delta Lake DESCRIBE HISTORY command provides a quick overview of the current schema and a changelog with user names and change details.

If you find the change illegitimate or still accidental, you also have the option to revert back to or restore a previous version of your data using the Time Travel capability.

I don’t know what data I used for training and cannot reproduce the results.

When creating features for a particular model, we might try different versions of features in the process. Using different versions of the same feature can lead to a number of challenges down the line.

  • The training results are no longer reproducible from losing track of the specific version of your feature used for training.
  • The results of your model in production don’t meet the standard of the training results, as the features used in production might not be quite the same as used during the training.

To avoid this, one solution is to create multiple versions of the feature tables and store them in blob storage (using e.g. Apache Parquet). The specific path to the data used can then be logged as a parameter during your MLflow run. However, this is still a manual process and can take up significant amounts of data storage space. Here, Delta offers an alternative. Rather than saving different versions of your data manually, you can use Delta versioning to automatically track changes that have been made to your data. On top of this, Delta integrates with various MLflow flavors, which supports autologging such as mlflow.spark.autolog() to track  the location of the data used for model training and the version if your data is stored in Delta. In this manner, you can avoid storing multiple versions of your data, allowing you to reduce storage cost as well as confusion around what data was used for a particular training run.

Rather than saving different versions of your data manually, you can use Delta Lake versioning to automatically track  the version of your data used for training.

However, storing endless versions of your data might still make you worry about storage costs. Delta easily takes care of this by providing a retention threshold (VACUUM) on the number of data versions you want to keep. In cases where you would like to archive data for longer periods for retrieval at a later point in time, for instance when you want to A/B test a new model down the line, you can use Delta clones. Deep clones make a full copy of the metadata and data files being cloned for the specified version, including partitioning, constraints and other information. As the syntax for deep clones is simple, archiving a table for model testing down the line becomes very simple.

Delta Clones allows you to make a full copy of the specific version of the cloned file’s metadata and data, including partitioning, constraints, and other information.


My features in prod don’t match the features I used to develop.

With the data versioning challenges sorted, you might still worry about code reproducibility for particular features. The solution here would be the Databricks Feature Store, which is fully underpinned by Delta and supports the approach outlined in this blog. Any development of features done on Delta tables can be easily logged to the Feature Store, keeping track of the code and version from where they were created. Moreover, it provides additional governance on your features, as well as look-up logic to make your feature better findable and more usable and many other capabilities.

More information

If you are interested in learning more about the various concepts discussed in this blog, have a look at the following resources.

Conclusion

In conclusion, in this blog, we have reviewed some of the common challenges faced by data scientists. We have learned that Delta Lake can alleviate or remove these challenges, which in turn leads to a greater chance of data science and machine learning projects succeeding.

Learn more about Delta Lake

--

Try Databricks for free. Get started today.

The post The Delta Between ML Today and Efficient ML Tomorrow appeared first on Databricks.


Getting Started With Ingestion into Delta Lake

$
0
0

Ingesting data can be hard and complex since you either need to use an always-running streaming platform like Kafka or you need to be able to keep track of which files haven’t been ingested yet. In this blog, we will discuss Auto Loader and COPY INTO, two methods of ingesting data into a Delta Lake table from a folder in a data lake. These two features are especially useful for data engineers, as they make it possible to ingest data directly from a data lake folder incrementally, in an idempotent way, without needing a distributed real-time streaming data system like Kafka. In addition to significantly simplifying the Incremental ETL process, it is extremely efficient for ingesting data since it only ingests new data vs reprocessing existing data.

Now we just threw two concepts out there, idempotent and Incremental ETL, so let’s walk through what these mean:

  • Idempotent  refers to when processing the same data always results in the same outcome. For example, the buttons in an elevator are idempotent. You can hit the 11th floor button, and so can everyone else that enters the elevator after you; all these 11th floor button pushes are the same data  so it’s processed only once. But when someone hits the 3rd floor button, this is new data and will be processed as such. Regardless of who presses it, and on which floor they arrive, pressing a specific button to get to its corresponding floor always produces the same outcome.
  • Incremental ETL – Idempotency is the basis for Incremental ETL. Since only new data is processed incrementally, Incremental ETL is extremely efficient. Incremental ETL starts with idempotent ingestion then carries that ethos through multiple staging tables and transformations until landing on a gold set of tables that are easily consumed for business intelligence and machine learning.

Below is an Incremental ETL architecture. This blog focuses on methods for ingesting into tables from outside sources, as shown on the left hand side of the diagram. .

You can incrementally ingest data continuously or with a scheduled job. COPY INTO and Auto Loader cover both cases.

With Delta Lake you can incrementally ingest data continuously or with a scheduled job.

COPY INTO

COPY INTO is a SQL command that loads data from a folder location into a Delta Lake table. The following code snippet shows how easy it is to copy JSON files from the source location ingestLandingZone to a Delta Lake table at the destination location ingestCopyIntoTablePath. This command is now re-triable and idempotent, so it can be scheduled to be called by a job over and over again. When run, only new files in the source location will be processed.

Example code showing how easy it is to copy JSON files from the source location ingestLandingZone to a Delta Lake table at the destination location.

A couple of things to note:

  • COPY INTO command is perfect for scheduled or ad-hoc ingestion use cases in which the data source location has a small number of files, which we would consider in the thousands of files.
  • File formats include JSON, CSV, AVRO, ORC PARQUET, TEXT and BINARYFILE.
  • The destination can be an existing Delta Lake table in a database or the location of a Delta Lake Table, as in the example above.
  • Not only can you use COPY INTO in a notebook, but it is also the best way to ingest data in Databricks SQL.

Auto Loader

Auto Loader provides Python and Scala methods to ingest new data from a folder location into a Delta Lake table by using directory listing or file notifications. While Auto Loader is an Apache Spark™ Structured Streaming source, it does not have to run continuously. You can use the trigger once option to turn it into a job that turns itself off, which will be discussed below.  The directory listing method monitors the files in a directory and identifies new files or files that have been changed since the last time new data was processed.  This method is the default method and is preferred when file folders have a smaller number of files in them.  For other scenarios, the file notification method relies on the cloud service to send a notification when a new file appears or is changed. 

Checkpoints save the state if the ETL is stopped at any point. By leveraging checkpoints, Auto Loader can run continuously and also be a part of a periodic or scheduled job. If the Auto Loader is terminated and then restarted, it will use the checkpoint to return to its latest state and will not reprocess files that have already been processed. In the example below, the trigger once option is configured as another method to control the Auto Loader job. It runs the job only once, which means the stream starts and then stops after processing all new data that is present at the time the job is initially run. 

Below is an example of how simple it is to set up Auto Loader to ingest new data and write it out to the Delta Lake table.

Getting Started With Ingestion into Delta Lake

This one Auto Loader statement:

  • Configures the cloudFiles stream.
  • Identifies the format of the files expected.
  • Defines a location of the schema information.
  • Identifies the path to check for new data.
  • Writes the data out to a file in the specified format.
  • Triggers and runs this Auto Loader statement once, and only once.
  • Defines where to manage the checkpoints for this autoloader job.
  • Identifies the table to where new data is stored.

In the example above, the initial schema is inferred, but a defined schema can be used instead.  We’ll dive more into inferring schema, schema evolution and rescue data in the next blog of this series.

Conclusion

At Databricks, we strive to make the impossible possible and the hard easy. COPY INTO and Auto Loader make incremental ingest easy and simple for both scheduled and continuous ETL. Now that you know how to get started with COPY INTO and Auto Loader, we can’t wait to see what you build with them!


Download this notebook

--

Try Databricks for free. Get started today.

The post Getting Started With Ingestion into Delta Lake appeared first on Databricks.

Augment Your SIEM for Cybersecurity at Cloud Scale

$
0
0

Over the last decade, security incident and event management tools (SIEMs) have become a standard in enterprise security operations. SIEMs have always had their detractors. But the explosion of cloud footprints is prompting the question, are SIEMs the right strategy in the cloud-scale world? Security leaders from HSBC don’t think so. In a recent talk, Empower Splunk and Other SIEMs with the Databricks Lakehouse for Cybersecurity, HSBC highlighted the limitations of legacy SIEMs and how the Databricks Lakehouse Platform is transforming cyberdefense. With $3 trillion in assets, HSBC’s talk warrants some exploration.

In this blog post, we will discuss the changing IT and cyber-attack threat landscape, the benefits of SIEMs, the merits of the Databricks Lakehouse and why SIEM + Lakehouse is becoming the new strategy for security operations teams. Of course, we will talk about my favorite SIEM! But I warn you, this isn’t a post about critiquing “legacy technologies built for an on-prem world.” This post is about how security operations teams can arm themselves to best defend their enterprises against advanced persistent threats.

The enterprise tech footprint

Some call it cloud-first and others call it cloud-smart. Either way, it is generally accepted that every organization is involved in some sort of cloud transformation or evaluation — even in the public sector, where onboarding technology isn’t a light decision. As a result, the main US cloud service providers all rank within the top 5  largest market cap companies in the world. As tech footprints are migrating to the cloud, so are the requirements for cybersecurity teams. Detection, investigation and threat hunting practices are all challenged by the complexity of the new footprints, as well as the massive volumes of data. According to IBM, it takes 280 days on average to detect and contain a security breach. According to HSBC’s talk at Data + AI Summit, 280 days would mean over a petabyte of data — just for network and EDR (endpoint threat detection and response) data sources.

When an organization needs this much data for detection and response, what are they to do?  Many enterprises want to keep the cloud data in the cloud. But what about from one cloud to the other? I spoke to one large financial services institution this week who said, “We pay over a $1 million in egress cost to our cloud provider.” Why? Because their current SIEM tool is on one cloud service and their largest data producers are on another.  Their SIEM isn’t multi-cloud. And over the years, they have built complicated transport pipelines to get data from one cloud provider to the other. Complications like this have warped their expectations from technology. For example, they consider 5-minute delays in data to be real time. I present this here as a reality of what modern enterprises are confronted with — I am sure the group I spoke with is not the only one with this complication.

Security analytics in the cloud world

The cloud terrain is really messing with every security operations team’s m.o. What was called big data 10 years ago is puny data by today’s cloud standards. With the scale of today’s network traffic, gigabytes are now petabytes, and what used to take months to generate now happens in hours. The stacks are new and security teams are having to learn them. Mundane tasks like, “have we seen these IPs before” are turning into hours or days-long searches in SIEM and logging tools. Slightly more sophisticated contextualization tasks, like adding the user’s name to network events, are turning into near impossible ordeals. And if one wants to do streaming enrichments of external threat intelligence at terabytes of data per day — good luck — hope you have a small army and a deep pocket. And we haven’t even gotten to anomaly detection or threat hunting use cases. This is by no means a jab at SEIMs. In reality, the terrain has changed and it’s time to adapt. Security teams need the best tools for the job.

What capabilities do security teams need in the cloud world? First and foremost, an open platform that can be integrated with the IT and security tool chains and does not require you to provide your data to a proprietary data store. Another critical factor is a multi-cloud platform, so it can run on the clouds (plural) of your choice. Additionally, a scalable and highly-performant analytics platform, where compute and storage are decoupled that can support end-to-end streaming AND batch processing. And finally, a unified platform to empower data scientists, data engineers, SOC analysts and business analysts — all data people. These are the capabilities of the Databricks Lakehouse Platform.

The SaaS and auto-scaling capabilities of Databricks simplify the use of these sophisticated capabilities. Databricks security customers are crunching across petabytes of data in sub ten minutes. One customer is able to collect from 15+ million endpoints and analyze the threat indicators in under an hour. A global oil and gas producer, paranoid about ransomware, runs multiple analytics and contextualizes every single powershell execution in their environment — analysts only see high confidence alerts.

Lakehouse + SIEM : The pattern for cloud-scale security operations

George Webster, Head of Cybersecurity Sciences and Analytics at HSBC, describes  the Lakehouse + SIEM is THE pattern for security operations. It leverages the strengths of the two components: a lakehouse architecture for multicloud-native storage and analytics, and SIEM for security operations workflows. For Databricks customers, there are two general patterns for this integration. But they are both underpinned by what Webster calls, The Cybersecurity Data Lake with Lakehouse.

The first pattern: The lakehouse stores all the data for the maximum retention period. A subset of the data is sent to the SIEM and stored for a fraction of the time.  This pattern has the advantage that analysts can query near-term data using the SIEM while having the ability to do historical analysis and more sophisticated analytics in Databricks. And manage any licensing or storage costs for the SIEM deployment.

The second pattern is to send the highest volume data sources to Databricks, (e.g. cloud native logs, endpoint threat detection and response logs, DNS data and network events). Comparatively low volume data sources go to the SIEM, (e.g. alerts, email logs and vulnerability scan data). This pattern enables Tier 1 analysts to quickly handle high-priority alerts in the SIEM. Threat hunt teams and investigators can leverage the advanced analytical capabilities of Databricks. This pattern has a cost benefit of offloading processing, ingestion and storage off of the SIEM.

Integrating the Lakehouse with Splunk

What would a working example look like? Because of customer demand, the Databricks Cybersecurity SME team created the Databricks add-on for Splunk. The add-on allows security analysts to run Databricks queries and notebooks from Splunk and receive the results back into Splunk. A companion Databricks notebook enables Databricks to query Splunk, get Splunk results and forward events and results to Splunk from Databricks.

With these two capabilities, analysts on the Splunk search bar can interact with Databricks without leaving the Splunk UI. And Splunk search builders or dashboards can include Databricks as part of their searches. But what’s most exciting is that security teams can create bi-directional, analytical automation pipelines between Splunk and Databricks.  For example, if there is an alert in Splunk, Splunk can automatically search Databricks for related events, and then add the results to an alerts index or a dashboard or a subsequent search. Or conversely, a Databricks notebook code block can query Splunk and use the results as inputs to subsequent code blocks.

With this reference architecture, organizations can maintain their current processes and procedures, while modernizing their infrastructure, and become multi-cloud native to meet the cybersecurity risks of their expanding digital footprints.

With the Databricks-Splunk reference architecture, organizations can maintain their current processes and procedures, while modernizing their infrastructure, and become multi-cloud native to meet the cybersecurity risks of their expanding digital footprints.

Achieving scale, speed, security and collaboration

Since partnering with Databricks, HSBC has reduced costs, accelerated threat detection and response, and improved their security posture. Not only can the financial institution process all of their required data, but they’ve increased online query retention from just days to many months at the PB scale. The gap between an attacker’s speed and HSBC’s ability to detect malicious activity and conduct an investigation is closing. By performing advanced analytics at the pace and speed of adversaries, HSBC is closer to their goal of moving faster than bad actors.

As a result of data retention capabilities, the scope of HSBC threat hunts has expanded considerably. HSBC is now able to execute 2-3x more threat hunts per analyst, without the limitations of hardware. Through Databricks notebooks, hunts are reusable and self-documenting, which keeps historical data intact for future hunts. This information, as well as investigation and threat hunting life cycles, can now be shared between HSBC teams to iterate and automate threat detection. With efficiency, speed and machine learning/artificial intelligence innovation now available, HSBC is able to streamline costs, reallocate resources, and better protect their business-critical data.

What’s next

Watch Empower Splunk and Other SIEMs with the Databricks Lakehouse for Cybersecurity to hear directly from HSBC and Databricks about how they are addressing their cybersecurity requirements.

Learn more about the Databricks add-on for Splunk.


References

Market caps: https://www.visualcapitalist.com/the-biggest-companies-in-the-world-in-2021/

Breach lifecycle: https://www.ibm.com/security/digital-assets/cost-data-breach-report/#/

--

Try Databricks for free. Get started today.

The post Augment Your SIEM for Cybersecurity at Cloud Scale appeared first on Databricks.

Databricks Lecture Series at UC Berkeley School of Information

$
0
0

This is a collaborative post from Databricks and UC Berkeley. We thank Tia Foss, Director of Philanthropy, UC Berkeley School of Information, for her contributions.

Databricks began in the computer labs of the University of California, Berkeley, where talented computer science graduate students, such as Matei Zaharia and Reynold Xin, realized that open-source, cloud-based scalable data analytics would drive the future of machine learning (ML) and artificial intelligence (AI). The relationship between Databricks and UC Berkeley is ongoing and important to both entities — Databricks embraces the talent that the university produces, and UC Berkeley engages with Databricks to bring next-generation technology and ideas to students.

Lecture series continues!

This is why we are excited to announce the continuation of the Databricks Lecture Series at the UC Berkeley School of Information! Launched last year, this lecture series features thought leaders and practitioners from Databricks covering top-of-mind topics in data science, such as MLflow and Delta Lake use cases, software practices in data management and the business value of data-centric solutions. The audience is composed of graduate students and alumni of the UC Berkeley School of Information’s Master of Information and Data Science (MIDS) program, as well as a broad community of students, instructors, researchers and analysts throughout the UC Berkeley data science and computer science community. MIDS is an online program, so the audience is geographically diverse and many students are mid-career, full-time working professionals already well-versed in various aspects of data science, data engineering, analytics, ML, AI, deep learning and related disciplines.

Capstone student projects

In addition, Databricks will be sponsoring student capstone projects for the 5th Year MIDS program, an intensive Master in Data Science open to UC Berkeley undergrads to complete in a 5th year following graduation. The degree offers graduates a strong advantage in a competitive profession.

The Databricks-Berkeley partnership is critical to sharing ideas between industry and academia, building connections between students and industry, and enhancing education through capstone projects that prepare them for life beyond campus.

New teachers and students wanted!

If you are teaching analytics at scale, check out the Databricks University Alliance. This program helps students and professors learn and use public-cloud-based analytical tools in college classrooms virtually or in-person. Enroll now and join more than 200 universities across the globe that are building the data science workforce and data teams of tomorrow. If you are a professor or student interested in working with Databricks on using public data sets to drive social change, please contact university@databricks.com. We believe that thoughtful collaboration can make a difference!

Upon acceptance, members will get access to curated content like example data science workspaces (“notebooks”), training materials, tutorials, pre-recorded content for learning data science and data engineering tools, including Apache Spark, Delta Lake and MLflow. Students focused on individual skills development can sign up for the free Databricks Community Edition and follow along with these free one-hour hands-on workshops for aspiring data scientists, as well as access free self-paced courses from Databricks Academy, the training and certification organization within Databricks.

The Databricks University Alliance is powered by leading cloud providers such as Microsoft Azure, AWS and Google Cloud. Those educators looking for high-scale computing resources for their in-person and virtual classrooms may apply for cloud computing credits.

Programs for working data scientists

If you are a working professional and want to take your data science career to the next level, be sure to look at the UC Berkeley Master of Information and Data Science program. The rigorous and holistic curriculum prepares students to become leaders in the data science field. Its multidisciplinary curriculum, experienced faculty from top data-driven companies, accomplished network of peers, and flexibility of online learning, bring the global prestige of a UC Berkeley education to students wherever they are.

Check out the Databricks-UC Berkeley lecture series and the Databricks Unversity Alliance.

--

Try Databricks for free. Get started today.

The post Databricks Lecture Series at UC Berkeley School of Information appeared first on Databricks.

An Experimentation Pipeline for Extracting Topics From Text Data Using PySpark

$
0
0

This post is part of a series of posts on topic modeling. Topic modeling is the process of extracting topics from a set of text documents. This is useful for understanding or summarizing large collections of text documents.  A document can be a line of text, a paragraph or a chapter in a book. The abstraction of a document refers to a standalone unit of text over which we operate. A collection of documents is referred to as a corpus, and multiple corpus, a corpora.

In this work, we will extract topics from a corpus of documents using the open source Pyspark ML library and visualize the relevance of the words in the extracted topics using Plot.ly. While ideally, one would want to couple the data engineering and model development process, there are times when a  data scientist might want to experiment on model building with a certain dataset.  Therefore, it might be wasteful to run the entire ETL pipeline when the intent is to model experimentation. In this blog, we will showcase how to separate the ETL process from the data science experimentation step using the Databricks Feature Store to save the extracted features so that they can be reused for experimentation. This makes it easier to experiment using various topic modeling algorithms such as LDA  and perform hyperparameter optimization. It also makes the experimentation more systematic and reproducible since the Feature Store allows for versioning as well.

Outline of the process

In this work, we have downloaded  tweets from various political figures and stored them in the JSON format. The workflow to extract topics from these tweets consists of the following steps

  1. Read the JSON data
  2. Clean and transform the data to generate the text features
  3. Create the Feature Store database
  4. Write the generated features to the Feature Store
  5. Load the features from the Feature Store and perform topic modeling

What is the Feature Store?

The general idea behind a feature store is that it acts as a central repository to store the features for different models. The Databricks Feature Store allows you to do the same thing while being integrated into the Databricks unified platform. The Feature Store encourages feature discovery, sharing and lineage tracking.  Feature Stores are built on Delta tables, which bring ACID transactions to Spark and other processing engines,

Load and transform the data

We start by loading the data using Apache Pyspark™ and extracting the necessary fields required for extracting the topics. The duplicate tweets are removed, and the tweets are then tokenized and cleaned by removing the stopwords. While further processing is not done in this work, it is highly recommended to remove links and emoticons.

fs = feature_store.FeatureStoreClient()
df = spark.read.format("json").load("/FileStore/*.txt")
pub_extracted = df.rdd.map(lambda x: ( x['user']['screen_name'], x['id'], x['full_text']) ).toDF(['name','tweet_id','text'])
pub_sentences_unique = pub_extracted.dropDuplicates(['tweet_id'])
tokenizer = Tokenizer(inputCol="text", outputCol="words")
wordsData = tokenizer.transform(pub_sentences_unique)
remover = StopWordsRemover(inputCol="words", outputCol="filtered")
filtered = remover.transform(wordsData)

The words in the corpus are vectorized by word count and the Inverse Document Frequency is then computed (IDF). These are the extracted features in this model that can then be saved and reused in the model building process. Since the feature rawFeatures, which stores the IDF values, is a Sparse Vector type and the Feature Store does not support storing arrays, we convert this column into a string so that it can be saved in the Feature Store. We cast this back to a vector while reading it from the Feature Store since we know the schema of the feature, so we can use it in our model.

cv = CountVectorizer(inputCol="filtered", outputCol="rawFeatures", vocabSize=5000, minDF=10.0)
cvmodel = cv.fit(filtered)
vocab = cvmodel.vocabulary
featurizedData = cvmodel.transform(filtered)
idf = IDF(inputCol="rawFeatures", outputCol="features")
idfModel = idf.fit(featurizedData)
rescaledData = idfModel.transform(featurizedData)
rescaledData = rescaledData.withColumn('stringFeatures', rescaledData.rawFeatures.cast(StringType()))
rescaledData = rescaledData.withColumn('coltext', concat_ws(',', 'filtered' ))

Feature Store

Save the features

We start off by creating a database to hold our feature table. A feature store client object is created for interacting with this feature store. We create the feature store by specifying at least the name of the store, the keys and the columns to be saved. In the example below, we save four columns from the data frame generated above. Since Feature Stores are Delta tables, the features can be rewritten, and the feature values are simply version controlled so they can be retrieved later, allowing for reproducible experiments.

CREATE DATABASE IF NOT EXISTS lda_example2;
fs = feature_store.FeatureStoreClient()
fs.create_feature_table(name = "lda_example2.rescaled_features", keys = ['tweet_id', 'text', 'coltext', 'stringFeatures'], features_df = rescaledData.select('tweet_id', 'text', 'coltext', 'stringFeatures'))

Load the Feature Store

Once the features have been saved, one does not have to rerun the ETL pipeline the next time a data scientist wants to experiment with a different model, saving a considerable amount of time and compute resources. The features can simply be reloaded from the table using fs.read_table by passing the table name and, if desired, the timestamp to retrieve a specific version of the set of features.

Since the transformed IDF values were stored as a string, we need to extract the values and cast it into a Sparse Vector format. The transformation is shown below and the data frame df_new is created, which will be fed to the topic modeling algorithm.

fs = feature_store.FeatureStoreClient()
yesterday = datetime.date.today() + datetime.timedelta(seconds=36000)
# Read feature values 
lda_features_df = fs.read_table(
  name='lda_example2.rescaled_features',
  #as_of_delta_timestamp=str(yesterday)
)
df_new = lda_features_df.withColumn("s", expr("split(substr(stringFeatures,2,length(stringFeatures)-2), ',\\\\s*(?=\\\\[)')")) \
  .selectExpr("""
      concat(
        /* type = 0 for SparseVector and type = 1 for DenseVector */
        '[{"type":0,"size":',
        s[0],
        ',"indices":',
        s[1],
        ',"values":',
        s[2],
        '}]'
      ) as vec_json
   """) \
  .withColumn('features', from_json('vec_json', ArrayType(VectorUDT()))[0])

Building the topic model

Once we have set up the data frame with the extracted features, the topics can be extracted using the Latent Dirichlet Allocation (LDA) algorithm from the PySpark ML library.  LDA is defined as the following:

Latent Dirichlet Allocation (LDA) is a generative, probabilistic model for a collection of documents, which are represented as mixtures of latent topics, where each topic is characterized by a distribution over words.”

In simple terms, it means that each document is made up of a number of topics, and the proportion of these topics vary between the documents. The topics themselves are represented as a combination of words, with the distribution over the words representing their relevance to the topic. There are two hyperparameters that determine the extent of the mixture of topics. The topic concentration parameter called ‘beta’  and the document concentration parameter called ‘alpha’ is used to suggest the level of similarity between topics and documents respectively. A high alpha value will result in documents having similar topics and a low value will result in documents with fewer but different topics. At very large values of alpha, as alpha approaches infinity, all documents will consist of the same topics. Similarly, a higher value of beta will result in topics that are similar while a smaller value will result in topics that have fewer words and hence are dissimilar.

Since LDA is an unsupervised algorithm, there is no ‘ground truth’ to establish the model accuracy. The number of topics k is a hyperparameter that can often be tuned or optimized through a metric such as the model perplexity. The alpha and beta hyperparameters can be set using the parameters setDocConcentration and setTopicConcentration, respectively.

Once the model has been fit on the extracted features, we can create a topic visualization using Plot.ly.

lda_model = LDA(k=10, maxIter=20)
# learning_offset - large values downweight early iterations
# DocConcentration - optimized using setDocConcentration, e.g. setDocConcentration([0.1, 0.2])
#TopicConcentration - set using setTopicConcentration. e.g. setTopicConcentration(0.5)
model = lda_model.fit(df_new)
lda_data = model.transform(df_new)
ll = model.logLikelihood(lda_data)
lp = model.logPerplexity(lda_data)
vocab_read = spark.read.format("delta").load("/tmp/cvvocab")
vocab_read_list = vocab_read.toPandas()['vocab'].values
vocab_broadcast = sc.broadcast(vocab_read_list)
topics = model.describeTopics()

def map_termID_to_Word(termIndices):
      words = []
      for termID in termIndices:
          words.append(vocab_broadcast.value[termID])
      return words

udf_map_termID_to_Word = udf(map_termID_to_Word , ArrayType(StringType()))
ldatopics_mapped = topics.withColumn("topic_desc", udf_map_termID_to_Word(topics.termIndices))
topics_df = ldatopics_mapped.select(col("termweights"), col("topic_desc")).toPandas()
display(topics_df)

The plot below illustrates the topic distribution as sets of bar charts, where each row corresponds to a topic. The bars in a row indicate the various words associated with a topic and their relative importance to that topic. As mentioned above, the number of topics is a hyperparameter that either requires domain-level expertise or hyperparameter tuning.

Bar charts of words per topic, each row indicating a topic and the height of the bars indicating the weight of each word

Bar charts of words per topic, each row indicating a topic and the height of the bars indicating the weight of each word

Conclusion

We have seen how to load a collection of JSON files of tweets and obtain relatively clean text data. The text was then vectorized so that it could be utilized by one of several machine learning algorithms for NLP). The vectorized data was then saved as features using the Databricks Feature Store so that it can enable reuse and experimentation by the data scientist. The topics were then fed to the  PySpark LDA algorithm and the extracted topics were then visualized using Plot.ly. I would encourage you to try out the notebook and experiment with this pipeline by adjusting the hyperparameters, such as the number of topics, to see how it can work for you!


Try the Notebook

--

Try Databricks for free. Get started today.

The post An Experimentation Pipeline for Extracting Topics From Text Data Using PySpark appeared first on Databricks.

How We Built Databricks on Google Kubernetes Engine (GKE)

$
0
0

Our release of Databricks on Google Cloud Platform (GCP) was a major milestone toward a unified data, analytics and AI platform that is truly multi-cloud. Databricks on GCP, a jointly-developed service that allows you to store all of your data on a simple, open lakehouse platform, is based on standard containers running on top of Google’s Kubernetes Engine (GKE).

When we released Databricks on GCP, the feedback was “it just works!” However, some of you asked deeper questions about Databricks and Kubernetes, so we’ve decided to share reasons for using GKE, our learnings and some key implementation details.

Why Google Kubernetes Engine?

Open source software and containers

At Databricks, open source is core to who we are, which is why we’ve continued to create and contribute to major open source projects, such as Apache Spark™, MLflow,Delta Lake and Delta Sharing. As a company, we also contribute back to the community and use open source on a daily basis.

We have been using containers for many years. For example, in MLflow, users build machine learning (ML) models as Docker images, store them in a container registry and then deploy and run the model from the registry.

Another example are Databricks notebooks: version-controlled container images simplify the support for multiple Spark, Python and Scala versions, and containers lead to faster iterations in software development and more stable production systems.

Kubernetes and hyperscale

We are well aware that a container orchestration system, such as Kubernetes, brings its own challenges. The underlying concepts of Kubernetes and its abundance of features demand an experienced and knowledgeable data engineering team.

Databricks, however, has grown into a hyperscale environment within just a few years by successfully building on containers creating open source software. Our customers spin up millions of instances per day, and we are supporting hundreds of thousands of data scientists each month.

Security and simplicity

What matters most to us is delivering new features for data engineers and data scientists faster.  When it came to designing Databricks on GCP, our engineering team looked at the best options for fulfilling our security and scalability requirements. Our goal was to simplify the implementation and focus less on lower-level infrastructure, dependencies and instance life-cycle. With Kubernetes, our engineers could leverage the strong momentum from the open source community to drive infrastructure logic and security.

GKE and other Google Cloud Services

We critically evaluated the tradeoff between the operational expertise required and the benefits gained from operating a large, upstream Kubernetes environment in production and ultimately decided against using a self-managed Kubernetes cluster.

The key reasons for selecting GKE instead are the fast adoption of new Kubernetes versions and Google’s priority for infrastructure security. GKE from Google, the original creator of Kubernetes, is one of the most advanced managed Kubernetes services on the market.

On the one hand, Databricks integrates with all the key GCP cloud services like Google Cloud Storage, Google BigQuery and Google Looker. On the other hand, our implementation is running on top of GKE.

Databricks on Google Kubernetes Engine

Splitting a distributed system into a control plane and a user plane is a well-known design pattern. The task of the control plane is to manage and serve customer configuration. The data plane, which is often much larger, is for executing customer requests.

Databricks on GCP follows the same pattern. The Databricks operated control plane creates, manages and monitors the data plane in the GCP account of the customer. The data plane contains the driver and executor nodes of your Spark cluster.

GKE clusters, namespaces and custom resource declarations

When a Databricks account admin launches a new Databricks workspace, the corresponding data plane is created in the customer’s GCP account as a regional GKE cluster in a VPC (see Figure 1). There is a 1:1 relation between workspaces, GKE clusters and VPCs. Workspace users never interact with data plane resources directly. Instead, they do so indirectly via the control plane, where Databricks enforces access control and resource isolation among workspace users. Databricks also deallocates GKE compute resources intelligently based on customer usage patterns to save costs.

Databricks on Google Kubernetes Engine

Figure 1: Databricks using Google Kubernetes Engine

GKE cluster and node pools

The GKE cluster is bootstrapped with a system node pool dedicated to running workspace-wide trusted services. When launching a Databricks cluster, the user specifies the number of executor nodes, as well as the machine types for the driver node and the executor nodes. The cluster manager, which is part of the control plane, creates and maintains a GKE nodepool for each of those machine types; driver and executor nodes often run on different machine types, and therefore are served from different node pools.

Namespaces

Kubernetes offers namespaces to create virtual clusters with scoped names (hence the name). Individual Databricks clusters are separated from each other via Kubernetes namespaces in a single GKE cluster and a single Databricks workspace can contain hundreds of Databricks clusters. GCP network policies isolate the Databricks cluster network within the same GKE cluster and further improve the security. A node in a Databricks cluster can only communicate with other nodes in the same cluster (or use the NAT gateway to access the internet or other public GCP services).

Custom resource declarations

Kubernetes was designed from the ground up to allow the customization and extension of its API using Kubernetes custom resource declarations (CRD). For every Databricks cluster in a workspace, we deploy a Databricks runtime (DBR) as a Kubernetes CRD.

Nodepools, pods and sidecars

The Spark driver and executors are deployed as Kubernetes pods, which are running inside the nodes of the corresponding nodepool specified by a Kubernetes pod node selector. One GKE node is exclusively used by either a driver pod or by an executor pod. Cluster namespaces are configured with Kubernetes memory requests and limits.

On each Kubernetes node, Databricks also runs a few trusted daemon containers along with the driver or executor container. These daemons are trusted sidecar services that facilitate data access and log collection on the node. Driver or executor containers can only interact with the daemon containers on the same pod through restricted interfaces.

Frequently Asked Questions (FAQ)

Q: Can I deploy my own pods in the Databricks provided GKE cluster?

You cannot access the Databricks GKE cluster. It is restricted for maximum security and configured for minimal resource usage.

Q: Can I deploy Databricks on my own custom GKE cluster?

We don’t support this at the moment.

Q: Can I access the Databricks GKE cluster with kubectl?

Although the data plane of the GKE cluster is running in the customer account, default access restrictions and firewall settings are in place to prevent unauthorized access.

Q: Is Databricks on GKE faster, (e.g. cluster startup times), than Databricks on VMs or other clouds?

We encourage you to do your own measurements since the answer to this question depends on many factors. One benefit of the Databricks multi-cloud offering is that you can run such tests quickly. Our initial tests have shown that for a large number of concurrent workers, cold startup time was faster on GKE compared to other cloud offerings. Instances with comparable local SSDs did run certain Spark workloads slightly faster compared to some other clouds with similar compute core/memory/disk spec.

Q: Why aren’t you using one GKE cluster per Databricks cluster?

For efficiency reasons. Databricks clusters are created frequently, and some of them are short-lived (e.g. with short-running jobs).

Q: How long does it take to start up a cluster with 100 nodes?

Startup – even for large clusters of more than 100 nodes – happens in parallel, and thus the startup time does not depend on the cluster size. We recommend you measure the startup time for your individual setup and settings.

Q: How can I optimize how pods are assigned to a node for cost efficiency? I want to schedule several Spark executor pods to a larger node. 

Pods are optimally configured by Databricks for their respective usage (driver or worker nodes).

Q: Can I bring my own VPC for the GKE cluster?

Please contact your Databricks account manager for our future roadmap if you are interested in this feature.

Q: Is it safe that Databricks is running multiple Databricks clusters within a single GKE cluster?

Databricks clusters are fully isolated against each other using Kubernetes namespaces and GCP network policies. Only Databricks clusters from the same Databricks workspace share a GKE cluster for reduced cost and faster provisioning. If you have several workspaces they will be running on their own GKE cluster.

Q: Doesn’t GKE add extra network overhead compared to just having VMs? 

Our initial tests on GCP with the iperf3 benchmarks on n1-standard-4 instances in us-west2/1 showed excellent inter-pod throughput of more than 9 Gbps. GCP in general provides a high throughput connection to the internet with very low latencies.

Q: Now that Databricks is fully containerized, can I pull the Databricks images and use them myself, (e.g. on my local Kubernetes cluster)?

Databricks does not currently support this.

Q: Does Databricks on GCP limit us to one AZ within a region? How does node allocation to GKE actually work?

A GKE cluster uses all the AZs in a region.

Q: What features does Databricks on GCP include?

Please check out this link for up-to-date information.

The authors would like to thank Silviu Tofan for his valuable input and support.

 
Try Databricks on GCP for free!

The post How We Built Databricks on Google Kubernetes Engine (GKE) appeared first on Databricks.

5 Key Steps to Successfully Migrate From Hadoop to the Lakehouse Architecture

$
0
0

The decision to migrate from Hadoop to a modern cloud-based architecture like the lakehouse architecture is a business decision, not a technology decision. In a previous blog, we dug into the reasons why every organization must re-evaluate its relationship with Hadoop. Once stakeholders from technology, data, and the business make the decision to move the enterprise off of Hadoop, there are several considerations that need to be taken into account before starting the actual transition. In this blog, we’ll specifically focus on the actual migration process itself. You’ll learn about the key steps for a successful migration and the role the lakehouse architecture plays in sparking the next wave of data-driven innovation.

The migration steps

Let’s call it like it is. Migrations are never easy. However, migrations can be structured to minimize adverse impact, ensure business continuity and manage costs effectively. To do this, we suggest breaking your migration off of Hadoop down into these five key steps:

  • Administration
  • Data Migration
  • Data Processing
  • Security and Governance
  • SQL and BI Layer

Step 1: Administration

Let’s review some of the essential concepts in Hadoop from an administration perspective, and how they compare and contrast with Databricks.

Hadoop is essentially a monolithic distributed storage and compute platform. It consists of multiple nodes and servers, each with their own storage, CPU and memory.

Hadoop is essentially a monolithic distributed storage and compute platform. It consists of multiple nodes and servers, each with their own storage, CPU and memory. Work is distributed across all these nodes. Resource Management is done via YARN, which attempts best efforts to ensure that workloads get their share of compute.

Hadoop also consists of metadata information. There is a Hive metastore, which contains structured information around your assets that are stored in HDFS. You can leverage Sentry or Ranger for controlling access to the data. From a data access perspective, users and applications can either access data directly through HDFS (or the corresponding CLI/API’s) or via a SQL type interface. The SQL interface, in turn, can be over a JDBC/ODBC connection using Hive for generic SQL (or in some cases ETL Scripts) or Hive on Impala or Tez for interactive queries. Hadoop also provides an HBase API and related data source services. More on the Hadoop ecosystem here.

Next, let’s discuss how these services are mapped to or dealt with in the  Databricks Lakehouse Platform. In Databricks, one of the first differences to note is that you’re looking at multiple clusters in a Databricks environment. Each cluster could be used for a specific use case, a specific project, business unit, team or development group. More importantly, these clusters are meant to be ephemeral. For job clusters, the clusters’ life span is meant to last for the duration of the workflow. It will execute the workflow, and once it’s complete, the environment is torn down automatically. Likewise, if you think of an interactive use case, where you have a compute environment that’s shared across developers, this environment can be spun up at the beginning of the workday, with developers running their code throughout the day. During periods of inactivity, Databricks will automatically tear it down via the (configurable) auto-terminate functionality that’s built into the platform.

Unlike Hadoop, Databricks does not provide data storage services like HBase or SOLR. Your data resides in your file storage, within object storage. A lot of the services like HBase or SOLR have alternatives or equivalent technology offerings in the cloud. It might be a cloud-native or an ISV solution.

Each cluster node in Databricks is completely isolated from one another and corresponds to either a Spark driver or a worker, allowing for strict SLAs to be met for specific projects and use cases.

As you can see in the diagram above, each cluster node in Databricks corresponds to either Spark driver or a worker. The key thing here is that the different Databricks clusters are completely isolated from each other. This allows you to ensure that strict SLAs can be met for specific projects and use cases. You can truly isolate streaming or real-time use cases from other, batch oriented workloads, and you don’t have to worry about manually isolating long running jobs that could hog cluster resources for a long time. You can just spin up new clusters as compute for different use cases. Databricks also decouples storage from compute, and allows you to leverage existing cloud storage such as AWS S3, Azure Blob Storage and Azure Data Lake Store (ADLS).

Databricks also has a default managed Hive metastore, which stores structured information about data assets that reside in cloud storage. It also supports using an external metastore, such as AWS Glue, Azure SQL Server or Azure Purview. You can also specify security control such as Table ACLs within Databricks, as well as object storage permissions.

When it comes to data access, Databricks offer similar capabilities to Hadoop in terms of how your users interact with the data. Data stored in cloud storage, can be accessed through multiple paths in the Databricks environment. Users can use SQL Endpoints and Databricks SQL for interactive queries and analytics. They can also use the Databricks notebooks for Data Engineering and Machine Learning capabilities on the data stored in cloud storage. HBase in Hadoop maps to Azure CosmosDB, or AWS DynamoDB/Keyspaces, which can be leveraged as a serving layer for downstream applications.

Step 2:  Data migration

Coming from a Hadoop background, I’ll assume most of the audience would already be familiar with HDFS. HDFS is the storage file system used with Hadoop deployments that leverages disks on the nodes of the Hadoop cluster. So, when you scale HDFS, you need to add capacity to the cluster as a whole (i.e. you need to scale compute and storage together). If this involves procurement and installation of additional hardware, there can be a significant amount of time and effort involved.

In the cloud, you have nearly limitless storage capacity in the form of cloud storage such as AWS S3, Azure Data Lake Storage or Blob Storage or Google Storage. There are no maintenance or health checks needed, and it offers built-in redundancy and high levels of durability and availability from the moment it is deployed. We recommend using native cloud services to migrate your data, and to ease the migration there are several partners/ISVs.

So, how do you get started? The most commonly recommended route is to start with a dual ingestion strategy (i.e. add a feed that uploads data into cloud storage in addition to your on-premise environment). This allows you to get started with new use cases (that leverage new data) in the cloud without impacting your existing setup. If you’re looking for buy-in from other groups within the organization, you can position this as a backup strategy to begin with. HDFS traditionally has been a challenge to back up due to the sheer size and effort involved, so backing up data into the cloud can be a productive initiative anyway.

In most cases, you can leverage existing data delivery tools to fork the feed and write not just to Hadoop but to cloud storage as well. For example, if you’re using tools/frameworks like Informatica and Talend to process and write data to Hadoop, it’s very easy to add the additional step and have them write to cloud storage. Once the data is in the cloud, there are many ways to work with that data.

In terms of data direction, the data either be pulled from on-premise to the cloud, or pushed to the cloud from on-premise. Some of the tools that can be leveraged to push the data into the cloud are cloud native solutions (Azure Data Box, AWS Snow Family, etc.), DistCP (a Hadoop tool), other third party tools, as well as any in-house frameworks. The push option is usually easier in terms of getting the required approvals from the security teams.

For pulling the data to the cloud, you can use Spark/Kafka Streaming or Batch ingestion pipelines that are triggered from the cloud. For batch, you can either ingest files directly or use JDBC connectors to connect to the relevant upstream technology platforms and pull the data. There are, of course, third party tools available for this as well. The push option is the more widely accepted and understood of the two, so let’s dive a little bit deeper into the pull approach.

The first thing you’ll need is to set up connectivity between your on-premises environment and the cloud. This can be achieved with an internet connection and a gateway. You can also leverage dedicated connectivity options such as AWS Direct Connect, Azure ExpressRoute, etc. In some cases, if your organization is not new to the cloud, this may have already been set up so you can reuse it for your Hadoop migration project.

Another consideration is the security within the Hadoop environment. If it is a Kerberized environment, it can be accommodated from the Databricks side. You can configure Databricks initialization scripts that run on cluster startup, install and configure the necessary kerberos client, access the krb5.conf and keytab files, which are stored in a cloud storage location, and ultimately execute the kinit() function, which will allow the Databricks cluster to interact directly with your Hadoop environment.

Finally, you will also need an external shared metastore. While Databricks does have a metastore service that is deployed by default, it also supports using an external one. The external metastore will be shared by Hadoop and Databricks, and can be deployed either on-premises (in your Hadoop environment) or the cloud. For example, if you have existing ETL processes running in Hadoop and you cannot migrate them to Databricks yet, you can leverage this setup with the existing on-premises metastore, to have Databricks consume the final curated dataset from Hadoop.

Step 3: Data Processing

The main thing to keep in mind is that from a data processing perspective, everything in Databricks leverages Apache Spark. All Hadoop programming languages, such as MapReduce, Pig, Hive QL and Java, can be converted to run on Spark, whether it be via Pyspark, Scala, Spark SQL or even R. With regards to the code and IDE, both Apache Zeppelin and Jupyter notebooks can be converted to Databricks notebooks, but it’s a bit easier to import Jupyter notebooks. Zeppelin notebooks will need to be converted to Jupyter or Ipython before they can be imported. If your data science team would like to continue to code in Zeppelin or Jupyter, they can use Databricks Connect, which allows you to leverage your local IDE (Jupyter, Zeppelin or even IntelliJ, VScode, RStudio, etc.) to run code on Databricks.

When it comes to migrating Apache Spark™ jobs, the biggest consideration is Spark versions. Your on-premises Hadoop cluster may be running an older version of Spark, and you can use the Spark migration guide to identify what changes were made to see any impacts on your code. Another area to consider is converting RDDs to dataframes. RDDs were commonly used with Spark versions up to 2.x, and while they can still be used with Spark 3.x, doing so can prevent you from leveraging the full capabilities of the Spark optimizer. We recommend that you change your RDDs to dataframes wherever possible.

Last but not least, one of the common gotchas we’ve come across with customers during migration is hard-coded references to the local Hadoop environment. These will, of course, need to be updated, without which the code will break in the new setup.

Next, let’s talk about converting non-Spark workloads, which for the most part involve rewriting code. For MapReduce, in some cases, if you’re using shared logic in the form of a Java library, the code can be leveraged by Spark. However, you may still need to re-write some parts of the code to run in a Spark environment as opposed to MapReduce. Sqoop is relatively easy to migrate since in the new environments you’re running a set of Spark commands(as opposed to MapReduce commands) using a JDBC source. You can specify parameters in Spark code in the same way that you specify them in Sqoop. For Flume, most of the use cases we’ve seen are around consuming data from Kafka and writing to HDFS. This is a task that can be easily accomplished using Spark streaming. The main task with migrating Flume is that you have to convert the config file-based approach into a more programmatic approach in Spark. Lastly, we have Nifi, which is mostly used outside Hadoop, mostly as a drag and drop, self-service ingestion tool. Nifi can be leveraged in the cloud as well, but we see many customers using the opportunity to migrate to the cloud to replace Nifi with other, newer tools available in the cloud.

Migrating HiveQL is perhaps the easiest task of all. There is a high degree of compatibility between Hive and Spark SQL, and most queries should be able to run on Spark SQL as-is. There are some minor changes in DDL between HiveQL and Spark SQL, such as the fact that Spark SQL uses the “USING” clause vs HiveQL’s “FORMAT” clause. We do recommend changing the code to use the Spark SQL format, as it allows the optimizer to prepare the best possible execution plan for your code in Databricks. You can still leverage Hive Serdes and UDFs, which makes life even easier when it comes to migrating HiveQL to Databricks.

With respect to workflow orchestration, you have to consider potential changes to how your jobs will be submitted. You can continue to leverage Spark submit semantics, but there are also other, faster and more seamlessly integrated options available. You can leverage Databricks jobs and Delta Live Tables for code-free ETL to replace Oozie jobs, and define end-to-end data pipelines within Databricks. For workflows involving external processing dependencies, you’ll have to create the equivalent workflows/pipelines in technologies like Apache Airflow, Azure Data Factory, etc. for automation/scheduling. With Databricks’ REST APIs, nearly any scheduling platform can be integrated and configured to work with Databricks.

There is also an automated tool called MLens (created by KnowledgeLens), which can help migrate your workloads from Hadoop to Databricks. MLens can help migrate PySpark code and HiveQL, including translation of some of the Hive specifics into Spark SQL so that you can take advantage of the full functionality and performance benefits of the Spark SQL optimizer. They are also planning to soon support migrating Oozie workflows to Airflow, Azure Data Factory, etc.

Step 4: Security and governance

Let’s take a look at security and governance. In the Hadoop world, we have LDAP integration for connectivity to admin consoles like Ambari or Cloudera Manager, or even Impala or Solr. Hadoop also has Kerberos, which is used for authentication with other services. From an authorization perspective, Ranger and Sentry are the most commonly used tools.

With Databricks, Single Sign On (SSO) integration is available with any Identity Provider that supports SAML 2.0. This includes Azure Active Directory, Google Workspace SSO, AWS SSO and Microsoft Active Directory. For Authorization, Databricks provides ACLs (Access Control Lists) for Databricks objects, which allows you to set permissions on entities like notebooks, jobs, clusters. For data permissions and access control, you can define table ACLs and views to limit column and row access, as well as leverage something like credential passthrough, with which Databricks passes on your workspace login credentials to the storage layer (S3, ADLS, Blob Storage.) to determine if you are authorized to access the data. If you need capabilities like attribute-based controls or data masking, you can leverage partner tools like Immuta and Privacera. From an enterprise governance perspective, you can connect Databricks to an enterprise data catalog such as AWS Glue, Informatica Data Catalog, Alation and Collibra.

Step 5: SQL & BI layer

In Hadoop, as discussed earlier, you have Hive and Impala as interfaces to do ETL as well as ad-hoc queries and analytics. In Databricks, you have similar capabilities via Databricks SQL. Databricks SQL also offers extreme performance via the Delta engine, as well as support for high-concurrency use cases with auto-scaling clusters. Delta engine also includes Photon, which is a new MPP engine built from scratch in C++ and is vectorized to exploit both data level and instruction-level parallelism.

Databricks provides native integration with BI tools such as Tableau, PowerBI, Qlik andlooker, as well as highly-optimized JDBC/ODBC connectors that can be leveraged by those tools. The new JDBC/ODBC drivers have a very small overhead (¼ sec) and a 50% higher transfer rate using Apache Arrow, as well as several metadata operations that support significantly faster metadata retrieval operations. Databricks also supports SSO for PowerBI, with support for SSO with other BI/dashboarding tools coming soon.

Databricks has a built-in SQL UX in addition to the notebook experience mentioned above, which gives your SQL users their own lens with a SQL workbench, as well as light dashboarding and alerting capabilities. This allows for SQL-based data transformations and exploratory analytics on data within the data lake, without the need to move it downstream to a data warehouse or other platforms.

Next steps

As you think about your migration journey to a modern cloud architecture like the lakehouse architecture, here are two things to remember:

  1. Remember to bring the key business stakeholders along on the journey. This is as much of a technology decision as it is a business decision and you need your business stakeholders bought into the journey and its end state.
  2. Also remember you’re not alone, and there are skilled resources across Databricks and our partners who have done this enough to build out repeatable best practices, saving organizations, time, money, resources, and reducing overall stress.

To learn more about how Databricks increases business value and start planning your migration off of Hadoop, visit databricks.com/migration.

--

Try Databricks for free. Get started today.

The post 5 Key Steps to Successfully Migrate From Hadoop to the Lakehouse Architecture appeared first on Databricks.

Introducing Support for gp3, Amazon’s New General Purpose SSD Volume

$
0
0

Databricks clusters on AWS now support gp3 volumes, the latest generation of Amazon Elastic Block Storage (EBS) general purpose SSDs. gp3 volumes offer consistent performance, cost savings and the ability to configure the volume’s iops, throughput and volume size separately. Databricks on AWS customers can now easily switch to gp3 for the better price/performance storage of up to 20% per AWS.

If you add additional SSDs to your Databricks cluster instances then we recommend that you switch to gp3 (from gp2).

Follow these instructions to enable gp3.

For advanced use cases when you require additional control over the SSD volume’s iops and throughput, after enabling gp3, you can use the Databricks Clusters API. By default, the Databricks configuration will set the gp3 volume’s IOPs and throughput IOPS to match the maximum performance of a gp2 volume with the same volume size.

gp3 support will roll out to all Databricks on AWS regions by mid-August, 2021.

--

Try Databricks for free. Get started today.

The post Introducing Support for gp3, Amazon’s New General Purpose SSD Volume appeared first on Databricks.


How We Achieved High-bandwidth Connectivity With BI Tools

$
0
0

Business Intelligence (BI) tools such as Tableau and Microsoft Power BI are notoriously slow at extracting large query results from traditional data warehouses because they typically fetch the data in a single thread through a SQL endpoint that becomes a data transfer bottleneck. Data analytics can connect their BI tools to Databricks SQL endpoints to query data in tables through an ODBC/JDBC protocol integrated in our Simba drivers. With Cloud Fetch, which we released in Databricks Runtime 8.3 and Simba ODBC 2.6.17 driver, we introduce a new mechanism for fetching data in parallel via cloud storage such as AWS S3 and Azure Data Lake Storage to bring the data faster to BI tools. In our experiments using Cloud Fetch, we observed a 10x speed-up in extract performance due to parallelism.

Motivation and challenges

BI tools have become increasingly popular in large organizations, as they provide great data visualizations to data analysts  running analytics applications while hiding the intricacies of query execution. The BI tool communicates with the SQL endpoint through a standard ODBC/JDBC protocol to execute queries and extract results. Before introducing Cloud Fetch, Databricks employed a similar approach to that used by Apache Spark™. In this setting, the end-to-end extract performance is usually dominated by the time it takes the single-threaded SQL endpoint to transfer results back to your BI tool.

Prior to Cloud Fetch, the data flow depicted in Figure 1 was rather simple. The BI tool connects to a SQL endpoint backed by a cluster where the query executes in parallel on compute slots. Query results are all collected on the SQL endpoint, which acts as a coordinator node in the communication between the clients and the cluster. To serve large amounts of data without hitting the resource limits of the SQL endpoints, we enable disk-spilling on the SQL endpoint so that results larger than 100 MB are stored on a local disk. When all results have been collected and potentially disk-spilled, the SQL endpoint is ready to serve results back to the BI clients requesting it. The server doesn’t return the entire data at once, but instead it slices it into multiple smaller chunks.

n overview of the data flow for single-thread BI extracts from a typical data warehouse.

Figure 1. An overview of the data flow for single-thread BI extracts from a typical data warehouse.

We identify two main scalability issues that make this data flow inefficient, and put the SQL endpoint at risk of becoming a bottleneck when extracting hundreds of MB:

  • Multi-tenancy. The limited egress bandwidth may be shared by multiple users accessing the same SQL endpoint. As the number of concurrent users increases, each of them will be extracting data with degraded performance.
  • Lack of parallelism. Even though the cluster executes the query in parallel, collecting the query results from executors and returning them to the BI tool are performed in a single-thread. While the client fetches results sequentially in chunks of a few MB each, the storing and serving the results are bottlenecked by a single thread on the SQL endpoint.

Cloud Fetch architecture

To address these limitations, we reworked the data extract architecture in such a way that both the writing and reading of results are done in parallel. At a high-level, each query is split into multiple tasks running across all available compute resources, with each of these tasks writing their results to Azure Data Lake Storage, AWS S3, or Google Cloud Storage. The SQL endpoint sends a list of files as pre-signed URLs to the client, so that the client can download data in parallel directly from cloud storage.

An overview of the parallel data extract with the Cloud Fetch architecture

Figure 2. An overview of the parallel data extract with the Cloud Fetch architecture.


Data layout. Query tasks process individual partitions of the input dataset and generate Arrow serialized results. Apache Arrow has recently become the de-facto standard for columnar in-memory data analytics, and is already adopted by a plethora of open-source projects. Each query task writes data to cloud storage in 20 MB chunks using the Arrow streaming format. Inside each file, there may be multiple Arrow batches that consist of a fixed number of rows and bytes. We further apply LZ4 compression to the uploaded chunks to address users fetching in bandwidth constrained setups.

Result collection. Instead of collecting MBs or GBs of query results, the SQL endpoint is now storing links to cloud storage, so that the memory footprint and the disk-spilling overhead are significantly reduced. Our experiments show that Cloud Fetch delivers more than 2x throughput improvement for query result sizes that are larger than 1 MB. However, uploading results that are smaller than 1 MB to the cloud store is prone to suffer from non-negligible latency. Therefore, we designed a hybrid fetch mechanism that allows us either to inline results and avoid latency on small query results or to upload results and improve throughput for large query results. We identify three possible scenarios when collecting the results on the SQL endpoint:

  1. All tasks return Arrow batches and their total size is smaller than 1 MB. This is a case of very short queries that are latency-sensitive and for which fetching via the cloud store is not ideal. We return these results directly to the client via the single-threaded mechanism described above.
  2. All tasks return Arrow batches and their total size is higher than 1 MB or tasks return a mix of Arrow batches and cloud files. In this case we upload the remaining Arrow batches to the cloud store from the SQL endpoint using the same data layout as the tasks and store the resulting list of files.
  3. All tasks return links to cloud files. In this case, we store the cloud links in-memory and return them to the client upon fetch requests.

Fetch requests. When the data is available on the SQL endpoint, BI tools can start fetching it by sequentially requesting small chunks. Upon a fetch request, the SQL Endpoint takes the file corresponding to the current offset and returns a set of pre-signed URLs to the client. Such URLs are convenient for BI clients because they are agnostic of the cloud provider and can be downloaded using a basic HTTP client. The BI tool downloads the returned files in parallel, decompresses their content, and extracts the individual rows from the Arrow batches.

Experimental results. We performed data extract experiments with a synthetic dataset consisting of 20 columns and 4 million rows for a total amount of 3.42 GB. With cloud fetch enabled we observed a 12x improvement in the extract throughput when compared to the single-threaded baseline.

The extract throughput of Cloud Fetch versus the single-threaded baseline.

Figure 3. The extract throughput of Cloud Fetch versus the single-threaded baseline.

Get started

Want to speed up your data extracts? Get started with Cloud Fetch by downloading and installing the latest ODBC driver. The feature is available in Databricks SQL and interactive Databricks clusters deployed with Databricks Runtime 8.3 or higher both on Azure Databricks and Amazon. We incorporated the Cloud Fetch mechanism in the latest version of the Simba ODBC driver 2.6.17 and in the forthcoming Simba JDBC driver 2.6.18.

--

Try Databricks for free. Get started today.

The post How We Achieved High-bandwidth Connectivity With BI Tools appeared first on Databricks.

Announcing the Databricks Beacons Program

$
0
0

With roots in academia and open source, we know much of Databricks’ success is due to the community- the data scientists, data engineers, developers, data architects, data analysts, open-source contributors and data evangelists alike. Today, we are proud to introduce Databricks Beacons, a global program that is our way to thank and celebrate those who go above and beyond to uplift the data and AI community.

Databricks Beacons, a global program that is our way to thank and celebrate those who go above and beyond to uplift the data and AI community.

Beacons are located all over the world from Halifax, Canada to Tokyo, Japan, Zurich, Switzerland to Hangzhou, China and are committed to actively sharing their knowledge both online and offline. “I feel privileged to be a part of this community, to give back and learn from others,” Lorenz Walthert wrote about being a part of the program.


We chose the name Beacon, because these individuals light our way, they serve as guides. Like the North Star or a lighthouse, beacons help others navigate their journey. Polaris – or the pole star- is the anchor of the northern sky that helps those who follow to determine direction as it glows brightly to guide and lead toward a purposeful destination.

Beacons are first and foremost practitioners whose technology focus includes MLflow, Delta Lake, Apache Spark™, Databricks and related ecosystem technologies. They are leaders in their communities who demonstrate a commitment to sharing their knowledge with others. “I’m excited to join the Databricks Beacons program,” Adi Polak shares, “because I strongly believe in knowledge sharing, learning, and growing together.” Whether they are speaking at conferences, leading workshops, teaching, mentoring, blogging, writing books, creating tutorials, offering support in forums or organizing meetups, they inspire others and encourage knowledge sharing – all while helping to solve tough data problems. Check out each profile page to take a deeper dive.

Community is like a family. It’s important to take care of and empower each other – the stronger the community, the better to spark new ideas among like-minded souls. – Databricks Beacon, Jacek Laskowski

The first class of Beacons were nominated by Databricks engineering and OSS leaders and they were selected based on exemplary contributions and engagement with the community. Benefits of the program include peer networking and sharing through a private Slack channel, access to Databricks and OSS subject matter experts, recognition on the Databricks website and social channels, program swag and sponsorship to attend events and organize meetups. Moving forward, we welcome and encourage external nominations from the community. More details on how to submit a nomination are available here.

Reach out

Beacons are eager to bring their technical expertise to new audiences around the world. Look out for them at upcoming virtual meetups and conferences like Data + AI Summit and in the meantime, head over to databricks.com/discover/beacons to meet all of the Databricks Beacons.

Interested in requesting a Databricks Beacon to speak at your local meetup or create a tutorial in machine learning, data analytics, SQL or other data science specialization? First, check out their profile pages; each member has listed their areas of expertise and availability. Email us at beacons@databricks.com, and we can find a Beacon with matching interests.

--

Try Databricks for free. Get started today.

The post Announcing the Databricks Beacons Program appeared first on Databricks.

How Building Apache Zeppelin Led Me to Databricks

$
0
0

Today, I am excited to announce that I have officially joined Databricks as an Engineer on the Data Science team. This move comes after over a year of founding and running Staroid, a cloud-based platform that simplifies the delivery and deployment of open source projects at the enterprise level. I have been a heavy Apache SparkTM user since version 0.6, and prior to starting a company, I created Apache Zeppelin, an open-source data science notebook. My history with Spark and obvious passion for open source makes joining Databricks feel like a natural progression

The journey to Databricks

So, why Databricks? At a technology level, Databricks has always been committed to open source and contributing to the broader community. In addition to Spark, the company has developed four other major open-source projects: Delta Lake, MLflow, Koalas and Delta Sharing. The Databricks Lakehouse Platform was even founded with “open” as one of its core principles.

At the “human” level, what drew me to Databricks was the leadership and very personable relationships we built from the get-go. The first time I interacted with Ali Ghodsi was when I first started Apache Zeppelin and working on my own startup, called Zepl (previously NFLabs)l, in South Korea. Ali contacted me about joining Databricks (I specifically remember shouting “Oh, yeah!” to myself – to give you an idea of my excitement). Since I had just founded a company, the timing wasn’t right, but it definitely piqued my interest.

After Zepl was acquired and I had started Staroid, Reynold Xin and Patrick Wendell once again asked if I would be interested in joining Databricks. My interest grew. This reminded me of Three visits to the cottage (三顾茅庐), a famous story from the period of the Three Kingdoms of China. Liu Bei, who founded one of the kingdoms, visited the cottage of Kongmin, a statesman, three times personally to meet him. It was only after the third visit that Kongmin accepted his service. He would later become one of the greatest talents of the Kingdoms. While I cannot compare myself to the talent of Kongmin, the story is an analogy to my own experience with the company and made me aware of how much Databricks prioritized its people.

What’s next

Databricks has been leading the industry ever since the creation of Spark, and Delta Lake and the Lakehouse platform enable data use cases — even at the largest enterprises — to unseen levels.

I’m very excited about the opportunity ahead. In my new role, one of the aspects I’m looking forward to the most is furthering development on Databricks Notebooks. While I’ve worked on standalone notebooks before, Databricks has really transformed the extent to what data science notebooks can do…and I think a lot more lies ahead. Nothing overrides my excitement for the people I’ll be working with. As I learned from starting a company: your product, business model and innovation are only as good as the talent and relationships behind it.

--

Try Databricks for free. Get started today.

The post How Building Apache Zeppelin Led Me to Databricks appeared first on Databricks.

Getting to Know Databricks India

$
0
0

India is a vast country with extreme variations. A one-size-fits-all workplace does not do it justice. Although continued urbanization, transportation, and infrastructure are the foundation for connectedness, adaptability to these changes is key for successfully bringing teams together. When we first launched our India HQ in 2017, we were equally focused on building a culture and work environment that empowered the brightest minds from every region. Although our teams connect virtually these days due to COVID-19, we’ve continued to find new ways to foster our team culture.

Over the last five years, it’s been incredible to see the growth and exceptional talent fostered within our India HQ. Our India team first started off with a small technical solutions group; since then, we have expanded to a full-fledged office composed of customer success, talent acquisition, data engineering, and solution engineering teams. Together, our data teams apply their technical experience to support 5,000+ global customers in solving some of their biggest challenges while continuing to attract the best talent to Databricks.

Creating a culture of togetherness

Bangalore has always been at the forefront of technology and modernization. It started as a testbed for outsourcing and backend services for global companies but quickly moved to be the center for startups, fintech and smartphone software development. Even with its rapid growth, the deep-rooted culture of India continued to shape the tech industry and many corporations’ presence in Bangalore.

India is an incredible place. The embodiment of togetherness, its diverse culture with 22 major languages and a deep appreciation of its diversity are what drew me to move to India after being in the US for over three decades. The mantra that “the group is bigger than the individual” especially chimes well with me. But besides that, if you’re someone who likes to be part of a brand with an uber-cool workspace, free chai and games, and to work with collaborative teams from all around the world — the Databricks India office may just be the place for you.

We’re continuing to add new innovations and activities for our employees; here are some of the biggest highlights so far:

Fostering togetherness with Chai

Chai is religion and life in India. At the Databricks Bangalore center, you will always be greeted by a smiling face and a masala chai round the clock. Some of the best ideas and conversations come over a steaming cup of chai! Even amidst the pandemic, we’re finding ways to stay connected and build a culture of togetherness. That’s why we are planning to launch virtual Chai Chat Fridays to help us learn more about each other and stay connected.

Workplace environment

Databricks believes that the best work happens when employees feel comfortable and aren’t burnt out from heavy commutes. Cities like Bangalore are sprawling with people and commuting is tough with the heavy traffic. To help with that, we offer flexible working hours and also plan to have several WeWork office locations in Bangalore, which have centers in major locations throughout the city.

With our current office, we chose a place that has wide windows with lots of light and greenery — a sentiment that reminds me of the principles of vastu, which means the interplay of nature acting through the five elements ( earth, water, fire, air and space) and four directions (east, west, north and south). When our teams are in the office, we often take our lunch down to the lobby to eat together and have a cup of chai. There are many food options around the office — some highlights include Italian (with a taste of Indian spices) or traditional Indian food in the next building. The workplace entrance is decorated with ethnic bright colors, including a traditional palang (bench) to sip your chai. The ambiance of the center and the game room makes it a desirable place for innovative work.

Different areas of the Databricks Bangalore Center

Different areas of the Databricks Bangalore Center

Growing our team

At Databricks, we are hiring for roles across India — ranging from sales, data engineering, customer support and more. We also believe in investing in the next generation of Databricks employees and providing meaningful opportunities to students who want to learn about Databricks and plan to join us in the future. Recently, we started planning for our first student trainee program in India.

In addition to having students apply directly, we hosted an informal virtual talk with a few members of our Women’s Network ERG. This group is part of our broader Employee Resource Group (ERG) network at Databricks, where all employees are encouraged to connect and participate in. Noopur, Kavya, Annapurna and Manisha participated in this talk and shared stories about their day-to-day experience as solutions engineers. The purpose of this talk was to help students learn not only about the technical work here but also the culture and supportive environment as they start their careers. Later we learned that this panel was a big influence on why some of the students decided to join Databricks!

Thanks to the hard work of our teams, we are now excited to welcome our first cohort of student trainees — some who have already started. We hope that this pilot is just the beginning of our continuous investment and development in the community of university students.

Offering support during the pandemic

In addition to growing our teams, we also want to ensure our existing employees are being supported throughout the ever-changing world circumstances. India saw an unprecedented increase in COVID-19 cases this year, which significantly impacted everyone in our office and beyond in multiple ways. The leadership at Databricks felt it was incredibly important to support our staff in any way possible during this time. Initiatives included offering vaccination drives, acknowledging employees who went above and beyond, and providing unlimited time off to take care of loved ones and building contingency plans.

Staying (virtually) connected

Throughout my career, I have discovered that what you do at work is only one component of success. Building relationships, collaboration and teamwork — as cheesy as it may sound — are equally important to driving company goals and fostering career growth. With this in mind, we experimented with virtual dinners, where we could learn more about each other as people, not just teammates. One of my favorite moments this year was the talent show (a special shout-out to Darshan, who can play guitar like no other). Now, we are ready to launch Fun Friday events to relax and unwind after a long work week.

As Databricks continues to solve the world’s toughest data problems with innovative products, it is equally important to raise the bar on hiring and provide skills to engineers through internal development. We are all here to make a difference, and there is no better way to achieve that than by doing incredible work while developing close relationships over a cup of chai.

If you’re interested in learning more, check out our Life in APJ
LinkedIn Page
or view open roles on our careers page.

--

Try Databricks for free. Get started today.

The post Getting to Know Databricks India appeared first on Databricks.

Mastering the Next Level: Leveraging Data and AI in the Gaming Sector

$
0
0

How do you take 10k events per second from 30M users to create a better gamer experience?

How can a small data team build more automated workflows to grow impact across all business units, from finance to game development  to marketing?

In a recent virtual roundtable, we heard from the data teams at industry innovators SEGA Europe and Kolibri Games about how they have transformed data engineering and data science to create better, more personalized gameplay and gamer experiences.

As gaming becomes increasingly sophisticated and consumer expectations soar, game developers are looking for more effective ways to optimize and personalize the gaming experience for their users, as well as new monetization opportunities for their their products. This can all be achieved by leveraging game analytics. Intelligence can be fed back directly into the game design and development process, to maximize innovation and ensure that new products and features meet the demands and aspirations of their players.

At SEGA Europe, player behavior and other key in-game metrics and KPIs are  collected from more than 30 million customers, with over 10,000 events being processed every second through its data pipeline. The sheer magnitude of this data, which comes from a multitude of different data sources, has required a complete transformation of how data is managed in the business. By implementing the Databricks Lakehouse Platform, SEGA can store data in one location that provides each data team with access to what they need in near real time. It has also facilitated more effective collaboration between data scientists, engineers and analysts, regardless of the language they are using. Furthermore, due to the encryption process, the data is fully GDPR-compliant.

How is the data employed? Key use cases include tracking the volume of users and geographic location, customer churn, game balancing, pirate versus legitimate usage, evaluation of new features, personalisation, and customised CRM campaigns with A/B testing. Data is also used to power community activities in real time, allowing SEGA to engage more closely with players, track player behaviour, and release new downloadable content, for example. Importantly, Databricks has accelerated the use of data science and machine learning at the company, ultimately driving faster, more efficient development of new games and features.

Kolibri Games is an innovative startup built on a data-driven culture, which has allowed it to secure a strong competitive advantage within a short time span. Part of this journey has involved a strong investment in data architecture. The cloud-based structure of the Databricks platform has enabled Kolibri’s data teams to access and process data at the exact rate they need it, which has also helped them to save costs. New features have provided access to advanced technologies such as MLflow, Databricks SQL and Spark SQL – enabling a small team to achieve much more than previously considered possible. Databricks has also permitted more collaboration between teams, allowing users to work on notebooks together, and set up clusters with the same package, so everyone is operating in the same environment. It has also facilitated more co-development, standardized production language, and ensured scalability to the precise requirements of each user or team.

Large volumes of data are ingested each day, and teams are able to manage clusters and jobs directly within Databricks. A/B testing has been simplified and automated, allowing the teams to ensure that changes made to games always result in added value – for both the company and the players. Kolibri has also built an ML engine using MLflow to enable predictive modelling, which has become critical to product development. The next stage of its data strategy is to build a dynamic recommendation engine, which will help maximize enjoyment and heighten the experience for the brand’s one million daily players. With ML technology, offers can be completely customized, enabling Kolibri to automatically recommend game types and personalized experiences to customers, for example.

Watch the Data and AI in the Gaming Sector Webcast

Mastering the Next Level: Leveraging Data and AI in the Gaming Sector

WATCH NOW

Guest speakers:

  • Felix Baker, Data Services Manager, SEGA Europe
  • Chris Ling, Director of Data Platform and Analytics, Kolibri Games

Host:

  • Steve Sobel, Media and Entertainment Industry Leader, Databricks

More gaming resources

--

Try Databricks for free. Get started today.

The post Mastering the Next Level: Leveraging Data and AI in the Gaming Sector appeared first on Databricks.

Viewing all 1873 articles
Browse latest View live