Quantcast
Channel: Databricks
Viewing all 1873 articles
Browse latest View live

Make Your RStudio on Databricks More Durable and Resilient

$
0
0

One of the questions that we often hear from our customers these days is, “Should I develop my solution in Python or R?” There is no right or wrong answer to this question, as it largely depends on the available talent pool, functional requirements, availability of packages that fit the problem domain and many other factors.

It is a valid question, and we believe the answer is actually not to choose, but to embrace the power of being a polyglot data practitioner.

If we elevate our consideration from the individual level to the organizational level, it’s clear that most organizations have a talent pool of experts in Python, R, Scala, Java and other languages. So the question is not which language to choose, but how can data teams support all of them in the most flexible way.

The talent pool of R experts is vast, especially among data scientists, and the pool has matured into an essential component of many solutions; this is why the R language is integral to Databricks as a platform.

In this blog, we will cover the durability of R code in RStudio on Databricks and how to achieve automated code backups to battle potential disastrous code losses.

A gateway or a roadblock?

Why is RStudio so important? For many individuals, this tool is a favorite coding environment when it comes to R. If properly positioned in your architecture,  RStudio can be the first step for users’ onboarding onto the platform – but it can be a roadblock to cloud adoption if not properly strategized. Through the adoption of cloud concepts, such as SparkR or Sparklyr, users can become more comfortable with using notebooks (and alternative tools) and better equiped for the cloud journey ahead.

However, RStudio can create challenges around code efficiency.  It is often mentioned that other coding languages can run faster, but training your talent on another language, hiring new talent and migrating solutions between two code bases can all easily diminish any efficiency gains produced by a language that executes faster.

Another angle to the matter is that of intellectual property. Many organizations throughout the years have accumulated priceless knowledge in custom-built R packages that embed a huge amount of domain expertise. Migration of such IP would be costly and inefficient.

With these considerations in mind, we can only conclude: R is here to stay!

RStudio on Databricks

R is a first-class language in Databrick and is supported both in Databricks notebooks and via RStudio on Databricks deployment. Databricks integrates with RStudio Server, which is a popular integrated development environment (IDE) for R. Databricks Runtime ML comes with RStudio Server version 1.2 out of the box.

RStudio on Databricks deployment

RStudio Server runs on a driver node of a Databricks Apache Spark cluster. This means that the driver node of the cluster will act as your virtual laptop. This approach is flexible and allows for considerations that physical PCs do not allow for. Many users can easily share the same cluster and maximize utilisation of resources, and it is fairly easy to upgrade the driver node by provisioning a more performant instance. RStudio comes with integrated Git support, and you can easily pull all your code, which makes migration from physical machine to cloud seamless.

One of the greatest advantages of RStudio on Databricks is its out-of-the-box integration with Spark. RStudio on Databricks supports SparkR and Sparklyr packages that can scale your R code over Apache Spark clusters. This will bring the power of dozens, hundreds or even thousands of machines to your fingertips. This particular feature will supercharge and modernize data science capabilities while decoupling data from compute in a cloud-first solution on a cloud provider of your choice: Microsoft Azure, Google Cloud Platform or AWS. Oh, and the best part? You’re not just restricted to one provider.

Where has my code gone? 

Of course, even the best solutions aren’t perfect, so let’s dive into some of the challenges. One of the main problems with this deployment is resilience and durability. The clusters that have RStudio running on them require auto-termination to be disabled (more on requisites of RStudio here), and the reason is simple. All of the user data that is created in RStudio is stored on the driver node.

In this deployment, the driver node contains data for each authenticated user; this data includes their R code, ssh keys used for authentication with Git providers and personal access tokens generated during the first access to RStudio (clicking on “Set up RStudio” button).

Setting up RStudio on Databricks

Auto-termination is off: Am I safe or not? Not exactly. By disabling auto-termination, you can ensure that the cluster won’t terminate while you’re away from your code. When back in RStudio, you can save your code and back it up against your Git remote repository. However, this is not the only danger to the durability of our code; the admins can potentially terminate clusters, depending on how you are managing permissions. For the sake of this blog, we won’t go into details about how to properly structure permissions and entitlements. We will assume that there is a user that can terminate the cluster.

If there is such a user that can terminate the cluster at any given point of time, this increases the fragility of your R code developed in RStudio. The only way to make sure your code will survive such an event is to back up your code against the Git remote repository. This is a manual action that can easily be forgotten.

One other event that can cause loss of work is a catastrophic failure of the driver node, for example, if a user tries to bring an inappropriate amount of data into the driver’s memory. In such cases, the driver node can go down and the cluster will require a restart. In practical terms, any event in code that overutilizes allocated heap memory can lead to the termination of the driver node. If you have not explicitly backed up your data and your code, you can lose substantial amounts of valuable work. Let’s walk through some solutions to this problem.

Databricks RStudio Guardian 

Given the importance of RStudio in your overall technology ecosystem, we have come up with a solution that can drastically reduce the chances of losing work in RStudio on Databricks: a guardian job.

We propose a guardian job running in the background of the RStudio with a predefined frequency that will take a snapshot of the project files for each onboarded user, and back it up on DBFS (Databricks File System) location or a dedicated mount on your storage layer. While DBFS can be used for a small amount of users’ data, a dedicated mount would be a preferred solution.  For details on how to set up a job in Databricks, please refer to the documentation.

Each user has a directory created on the driver node under /home/ directory. This directory contains all the relevant RStudio files. An example of such folder structure is shown below:

/home/first_name.last_name@your_org.com
---.Rhistory
---R
---.rstudio
---my-project
---another-project
---shared-project
---.ssh

In this list,you can identify three different project directories. In addition, there are several other important directories, most notably the .ssh directory containing your ssh key pair.

For brevity’s sake, this blog focuses on the project directories and .ssh directory, but the below approach can easily be extended to other directories of interest. We treat project directories as a set of documents that can simply be copied to a dedicated directory in your DBFS. We advise that the location to which you are backing up the code only be accessible to an admin account and that the job associated with the backup process is run by that admin account. This will reduce the chance of undesired access to any R code that is stored in the backup. The full code required for such a process is shared in the notebooks attached to this blog.

Logical design of the RStudio on Databricks solution

On the other hand, the .ssh directory requires a slightly different approach. Inside the .ssh directory, both users’ public and private keys are stored. While the public key does not require any further care than that of any other file, the private key is considered sensitive data and does require proper care. Enter scene Databricks CLI and Databricks Secrets. With Databricks CLI, we get an easy way to interact programmatically with Databricks Secrets and via secrets a way to securely store sensitive data. We can easily install Databricks CLI on a cluster by running:

%pip install databricks-cli

This allows to run the following command in shell:

databricks secrets put --scope rstudio_backup --key unique_username --binary-file /path/to/private_key

There are few considerations to keep in mind. Ssh keys generated by RStudio will implement the RSA algorithm, with a default private key size of 2048 bits. Secrets do have a limit on how much data can be stored in a single scope; up to a 1000 individual secrets can be stored in a single scope. Furthermore, each secret must be 128KB of data or less. Given these considerations and constraints, we propose one secret per user that contains any sensitive data. This would require storing data as a JSON string in case of multiple sensitive values:

{
   ‘private_key’: ‘key_payload’,
   ‘another_secret’: ‘xxxxxxxxxxxxxxx.xx’
   ‘access_token’: ‘xxxxxxxxxxxxxxxxxxxxxxxxxxxxxxxxxx’
}

The previous example illustrates how to construct a JSON string containing a private key payload together with the two additional secrets required for the user to carry out their work. This approach can be extended to contain any number of sensitive values as long as their combined size fits within the 128KB limit. An alternative approach would be to have a separate secret for each stored value; this would reduce the maximum number of users per RStudio cluster that can be backed up to 1000/N users, where N is the number of stored secrets per user.

In the case where more than 1000 users are accessing the same RStudio instance and require automatic backups (or 333 users if we keep 3 separate secrets per user), you can create multiple secret scopes and iterate through scopes per each 1000 user batch.

Restoring the state

Now that backups are being created, in case of termination of RStudio cluster, we can easily restore the last known previous state of the cluster’s home directory and all the important users’ data that we have backed up, including ssh keys. Backing up ssh keys is important from an automation perspective, if we chose not to store ssh keys, each time we have RStudio cluster restarted, we would require a recreation of such keys and reintegration of such keys with the settings of our account on our Git provider. Storing ssh keys inside a dedicated secret scope removes this burden from the end user.

Databricks has created a second notebook that restores all backed up R projects for all RStudio users and their code. This notebook should be run on demand once the RStudio has been created and warmed up.

This functionality unlocks several different aspects of the platform; the code is now more durable and automatically backed up. If the cluster requires reconfiguration, the last known state can be easily restored and is no longer conditioned on everyone manually pushing their code to a Git repository. Note that storing your code against Git frequently is still the best practice, and our solution intends to augment such best practices – not replace them.

Get started

To implement this solution please use the following notebooks as a baseline for the automated backup and on-demand restore procedure.

--

Try Databricks for free. Get started today.

The post Make Your RStudio on Databricks More Durable and Resilient appeared first on Databricks.


Solution Accelerator: Multi-touch Attribution

$
0
0

Behind the growth of every consumer-facing product is the acquisition and retention of an engaged user base. When it comes to customer acquisition, the goal is to attract high-quality users as cost effectively as possible. With marketing dollars dispersed across a wide array of different touchpoints — campaigns, channels, and creatives — measuring effectiveness is a challenge. In other words, it’s difficult to know how best to assign credit. This is where multi-touch attribution comes into play.

Introducing the Multi-touch Attribution Solution Accelerator from Databricks

Based on best practices from our work with leading global brands across all industries, we’ve developed solution accelerators for common analytics and machine learning (ML) use cases to save weeks or months of development time for your data engineers and data scientists.

Marketers and ad agencies are being held responsible to 1) demonstrate return on investment of their marketing dollars and 2) optimize marketing channel spend to drive sales. This solution accelerator complements our Sales Forecasting & Ad Attribution Solution Accelerator by helping to optimize marketing spend via accurately assigning credit to marketing channels using multi-touch attribution.

Using a synthetic dataset that consists of ad impressions and conversions, this solution accelerator:

  • introduces a new multi-touch attribution model, with a collection of methods used to optimize ad spend across multiple customer channels.
  • compares and contrasts heuristic-based attribution methods, such as first-touch and last-touch attribution models, as well as data-driven methods, such as markov chains.
  • implements first-touch, last-touch, and markov chain attribution models.
  • walks through the steps required to productionalize multi-touch attribution on your existing Databricks Lakehouse.
  • creates a dashboard that marketers can use to optimize their spend across various channels.

By deploying this use case on Databricks, you can easily incorporate any type of data — whether batch or streaming, raw or curated — and then surface your results through your BI tool of choice.

Databricks Multi-touch Attribution reference architecture

Fig 1: Multi-touch Attribution Reference Architecture

About attribution modeling

A customer can have dozens of interactions with a brand before making a purchase. In this scenario, should we simply assign credit for the purchase to the ad that the customer converted on, or should we assign some portion of the credit to each and every interaction? If the latter, how should we decide how much credit to assign each interaction?

This is the problem that attribution modeling helps solve.

Attribution modeling is an approach to assigning credit to various touchpoints in a conversion path. It helps marketers visualize and understand the customer journey, trends, and how prospects move through the sales cycle. At a high level, credit assignment is typically done using one of two methods: heuristic or data-driven. Heuristic methods are rule-based, whereas data-driven methods use probabilities and statistics to assign credit.

Commonly used heuristic-based methods include the following:

  • First-touch attribution model is a single-touch method that assigns full credit to the first channel that a customer interacts with prior to a conversion.
  • Last-touch attribution is a single-touch method that assigns full credit to the last channel that a customer interacts with prior to a conversion.
  • Linear attribution model is a multi-touch method that assigns credit uniformly across all channels.
  • Time decay model is a multi-touch method that assigns an increasing amount of credit to channels that appear closer in time to a conversion event.

Heuristic methods are relatively easy to implement but are less accurate than data-driven methods. With marketing dollars at stake, data-driven methods are highly recommended.

Commonly used data-driven methods include the following:=

  • Markov chains: this approach generates a probabilistic graph between all marketing channels by taking into account each customer’s journey, in sequential order. Once this probabilistic graph is generated, credit is assigned by calculating the ‘removal effect’ for each and every channel.
  • Shapley: this approach takes into account each customer’s journey as well but disregards the sequence in which interactions take place.

Using multi-touch attribution in production

To realize the full value of multi-touch attribution, it’s critical that the output is used to guide how marketing spend is allocated on an ongoing basis. For example, suppose you start a campaign by allocating your spend equally across five digital marketing channels. After your marketing campaign has been live for some time, you find that your affiliates channel is extremely efficient, accounting for 39% of attribution with just 20% of total spend. With this insight, you could then adjust your spend allocation accordingly and yield a higher return on ad spend (ROAS).

Data-driven budget allocation

Fig 2: Data Driven Budget Allocation

Getting started

The purpose of this solution accelerator is to demonstrate how to assign conversion credit to marketing channels using multi-touch attribution. Get started today by importing this solution accelerator into your Databricks workspace.

 
Try the Notebook

--

Try Databricks for free. Get started today.

The post Solution Accelerator: Multi-touch Attribution appeared first on Databricks.

Improving On-Shelf Availability for Items with AI Out of Stock Modeling

$
0
0

This post was written in collaboration with Databricks partner Tredence. We thank Rich Williams, Vice President Data Engineering, and Morgan Seybert, Chief Business Officer, of Tredence for their contributions.

 
Retailers are missing out on nearly $1 trillion in global sales because they don’t have on-hand what customers want to buy in their stores. Adding to the challenge, a  study of 600 households and several retailers by research firm IHL Group details that shoppers encounter out-of-stocks (OOS) as often as one in three shopping trips, according to the report. And a study by IRI found that 20% of all out-of-stocks remain unresolved for more than 3 days.

Overall, studies show that the average OOS rate is about 8%. That means that one out of 13 products is not purchasable at the exact moment the customer wants to get it in the store. OOS is one of the biggest problems in retail, but thankfully it can be solved with real-time data and analytics.

In this write-up, we showcase the new Tredence-Databricks combined On-Shelf Availability Solution Accelerator. The accelerator is a robust quick-start guide that is the foundation for a full Out of Stock or Supply Chain solution. We outline how to approach out-of-stocks with the Databricks Lakehouse to solve for  on-shelf availability in real-time.

And the impact of solving this problem? A 2% improvement in on-shelf availability is worth 1% in increased sales for retailers.

Growth in e-commerce makes item availability more important

The significance of this problem has been amplified by the availability of e-commerce for delivery and curbside pickup orders. While customers that face an out-of-stock at the store level may just not purchase that item, they are likely to purchase other items in the store. Buying online means that they may just switch to a different retailer.

The impact is not just limited to a bottom line  loss in revenue. Research from NielsenIQ shows that 30% of shoppers will visit new stores when they can’t find the product they are looking for, leading to a loss in long-term loyalty.  Members of e-commerce membership programs are most likely to switch retailers in the event of an out of stock. IHL estimates that “upwards of 24% of Amazon’s current retail revenue comes from customers who first tried to buy the product in-store.”

Retailers have responded to this with a variety of tactics including over-ordering of items, which increases carrying costs and lowers margins when they are forced to sell excess inventory at a discount. In some instances, retailers and distributors will rush order products or use intra-delivery “hot shots” for additional deliveries which come at an additional cost. Some retailers have invested in robotics, but many pull  out of their pilots citing costs. And other retailers are experimenting with computer vision, although these approaches merely notify when an item is unavailable and don’t predict item availability.

70% of shoppers will switch brands if their preferred product is not available in store.

It’s not just retailers that are impacted by OOS.  Retailers, consumer goods companies, distributors, brokers and other firms each invest in third-party audits, which typically involve employees visiting stores to identify gaps on the shelf. On any given day, tens of thousands of individuals are visiting stores to validate item availability. Is this really the best use of time and resources?

Why hasn’t technology solved out-of-stocks yet?

Out-of-stock issues have been around for decades, so why hasn’t the retail industry been able to solve an issue of this magnitude that impacts shoppers, retailers and brands alike?  The seemingly simple solution is to require employees to manually count the items on hand. But with potentially hundreds of thousands of individual SKUs distributed across a large format retail location that may be servicing customers nearly 24-hours a day, this simply isn’t a realistic task to perform on a regular basis.

Individual stores   do perform inventory counts periodically and then rely on point-of-sale (POS) and inventory management software to track changes that drive unit counts up and down. But with so much activity within a store location, some of the day-to-day recordkeeping falls through the cracks, not to mention the impact of shrinkage, which can be hard to detect, on in-store supplies.

So the industry falls back on modeling. But given fundamental problems in data accuracy, these approaches can drive a combination of false positives and false negatives that make model predictions difficult to employ. Time sensitivities further exacerbate the problem, as the large volume of data that often must be crunched in order to arrive at model predictions must be handled fast enough for the results to be actionable. The problem of building a reliable system for stockout prediction and alerting is not as straightforward as it might appear.

Introducing the On-shelf Availability Solution Accelerator

Our partners at Tredence approached us with the idea of publishing a Solution Accelerator that they’ve created as the core of a broader Supply Chain Control Tower offering. Tredence works with the largest retailers on the planet and understands the nuances of modeling OOS and knew that Databricks’ processing and their advanced data science capabilities were a winning combination.

While the OSA solution focuses on driving sales through improved stock availability on the shelves, the broader Retail Supply Chain Control Tower solves for multiple adjacent merchandising problems – inventory design for the stores, efficient store replenishments, design of store network for omnichannel operations, etc. Knowing how big a problem this is in retail, we immediately took them up on their offer.

The first step in addressing OSA challenges is to examine their occurrence in the historical data. Past occurrences point to systemic issues with suppliers and internal processes, which will continue to cause problems if not addressed.

To support this analysis, Tredence made available a set of historical inventory and sales data.  These data sets were simulated given the obvious sensitivities any retailer would have around this information, but were created in a manner that frequently observed OSA challenges manifested in the data.  These challenges were:

  1. Phantom inventory
  2. Safety stock violations
  3. Zero-sales events
  4. On-shelf availability

Phantom inventory

In a phantom inventory scenario, the units reported to be on-hand do not align with units expected based on reported sales and replenishment.

The misalignment of reported inventory with inventory expected based on sales and replenishment creating phantom inventory

Figure 1. The misalignment of reported inventory with inventory expected based on sales and replenishment creating phantom inventory


Poor tracking of replenishment units, unreported or undetected shrinkage, and out-of-band processes coupled with infrequent and sometimes inaccurate inventory counts create a situation where retailers believe they have more units on hand than they actually do. If large enough, this phantom inventory may delay or even prevent the ordering of replenishment units leading to an out-of-stock scenario.

Safety stock violations

Most organizations establish a threshold for a given product’s inventory below, which replenishment orders are triggered. If set too low, inadequate lead times or even minor disruptions to the supply chain may lead to an out-of-stock scenario while new units are moving through the replenishment pipeline.

Safety stock levels not providing adequate lead time to prevent out-of-stock issues

Figure 2. Safety stock levels not providing adequate lead time to prevent out-of-stock issues

The flip side of this is that if set too high, retailers risk overstocking products that may expire, risk damage or theft or otherwise consume space and capital that may be better employed in other areas. Finding the right safety stock level for a product in a specific location is a critical task for effective inventory management.

Zero-sales events

Phantom inventory and safety stock violations are the two most common causes of out-of-stocks. Regardless of the cause, out-of-stock events manifest themselves in periods when no units of a product are sold.

Not every occurrence of a zero-sales event reflects an out-of-stock concern. Some products don’t sell every day, and for some slow-moving products, multiple days may go by within which zero units are sold while the product remains adequately stocked.

Examining the cumulative probability of consecutive zero-sales events to identify potential out-of-stock issues

Figure 3. Examining the cumulative probability of consecutive zero-sales events to identify potential out-of-stock issues

The trick for scrutinizing zero-sales events at the item level is to understand the probability with which at least one unit of a product sells on a given day and to then to set a cumulative probability threshold for consecutive days reflecting zero-sales. When the cumulative probability of back-to-back zero-sales events exceeds the threshold, it’s time for the inventory of that product to be examined.

On-shelf availability

While understanding scenarios in which items are not in-stock is critical, it’s equally important to recognize when products are technically available for sale but underperforming because of non-optimal inventory management practices. These merchandising problems may be due to poor placement of displays within the store, the stocking of products deep within a shelf, the slow transfer of product from the backroom to shelves, or a myriad of other scenarios in which inventory is adequate to meet demand but customers cannot easily view or access them.

SA -- Improving On-shelf Availability W_ AI

Figure 4. Depressed sales due to poor product placement leading to an on-shelf availability problem.

To detect these kinds of problems, it is helpful to compare actual sales to those forecasted for the period. While not every missed sales goal indicates an on-shelf availability problem, a sustained miss might signal a problem that requires further attention.

How we approach out-of-stocks with the Databricks Lakehouse Platform

The evaluation of phantom inventories, safety stock violations, zero sales events and on-shelf availability problems requires a platform capable of performing a wide range of tasks. Inventory and sales data must be aggregated and reconciled at a per-period level. Complex logic must be applied across these data to examine aggregate and series patterns. Forecasts may need to be generated for a wide range of products across numerous locations. And the results of all this work must be made accessible to the business analysts responsible for scrutinizing the findings before soliciting action from those in the field.

Databricks provides a single platform capable of all this work. The elastic scalability of the platform ensures that the processing of large volumes of data can be performed in an efficient and timely manner. The flexibility of its development environment allows data engineers to pivot between common languages, such as SQL and Python, to perform data analysis in a variety of modes.

Pre-integrated libraries provide support for classic time series forecasting algorithms and techniques, and easy programmatic installations of alternative libraries such as Facebook Prophet allow data scientists to deliver the right forecast for the business’s needs. Scalable patterns ensure data science tasks are also tackled in an efficient and timely manner with little deviation from the standard approaches data scientists typically employ.

And the SQL Analytics interface, as well as robust integrations with Tableau and PowerBI, allows analysts to consume the results of the data scientists’ and data engineers’ work without having to first port the data to alternative platforms.

Getting started

Be sure to check out and download the notebooks for Out-of-Stock modeling. As with any of our Solution Accelerators, these are a foundation for a full solution. If you would like help with implementing a full Out-of-Stock or Supply Chain solution, go visit our friends at Tredence.

To see these features in action, please check out the following notebooks demonstrating how Tredence tackled out-of-stocks on the Databricks platform:


--

Try Databricks for free. Get started today.

The post Improving On-Shelf Availability for Items with AI Out of Stock Modeling appeared first on Databricks.
How to Manage End-to-end Deep Learning Pipelines w/ Databricks

$
0
0

Deep Learning (DL) models are being applied to use cases across all industries — fraud detection in financial services, personalization in media, image recognition in healthcare and more. With this growing breadth of applications, using DL technology today has become much easier than just a few short years ago. Popular DL frameworks such as Tensorflow and Pytorch have matured to the point where they perform well and with a great deal of precision.  Machine Learning (ML) environments like Databricks’ Lakehouse Platform with managed MLflow have made it very easy to run DL in a distributed fashion, using tools like Horovod and Pandas UDFs.  

Challenges

One of the key challenges remaining today is how to best automate and operationalize DL machine learning pipelines in a controlled and repeatable fashion. Technologies such as Kubeflow provide a solution, but they are often heavyweight, require a good amount of specific knowledge, and there are few managed services available — which means that engineers have to manage these complex environments on their own. It would be much simpler to have the management of the DL pipeline integrated into the data and analytics platform itself.

This blog post will outline how to easily manage DL pipelines within the Databricks environment by utilizing Databricks Jobs Orchestration, which is currently a public preview feature. Jobs Orchestration makes managing multi-step ML pipelines, including deep learning pipelines, easy to build, test and run on a set schedule. Please note that all code is available in this GitHub repo. For instructions on how to access it, please see the final section of this blog.

Let’s look at a real-world business use case. CoolFundCo is a (fictional) investment company that analyses tens of thousands of images every day in order to identify what they represent and categorize the content. CoolFundCo uses this technique in a variety of ways: for example, to look at pictures from malls around the country to determine short-term economic trends. The company then uses this as one of the data points for investments. The data scientists and ML engineers at CoolFundCo spend a lot of time and effort managing this process. CoolFundCo has a large stock of existing images, and every day they get a large batch of new images sent to their cloud object storage (in this example Microsoft Azure Data Lake Storage (ADLS)), but it could also be AWS S3 or Google Cloud Storage (GCS).

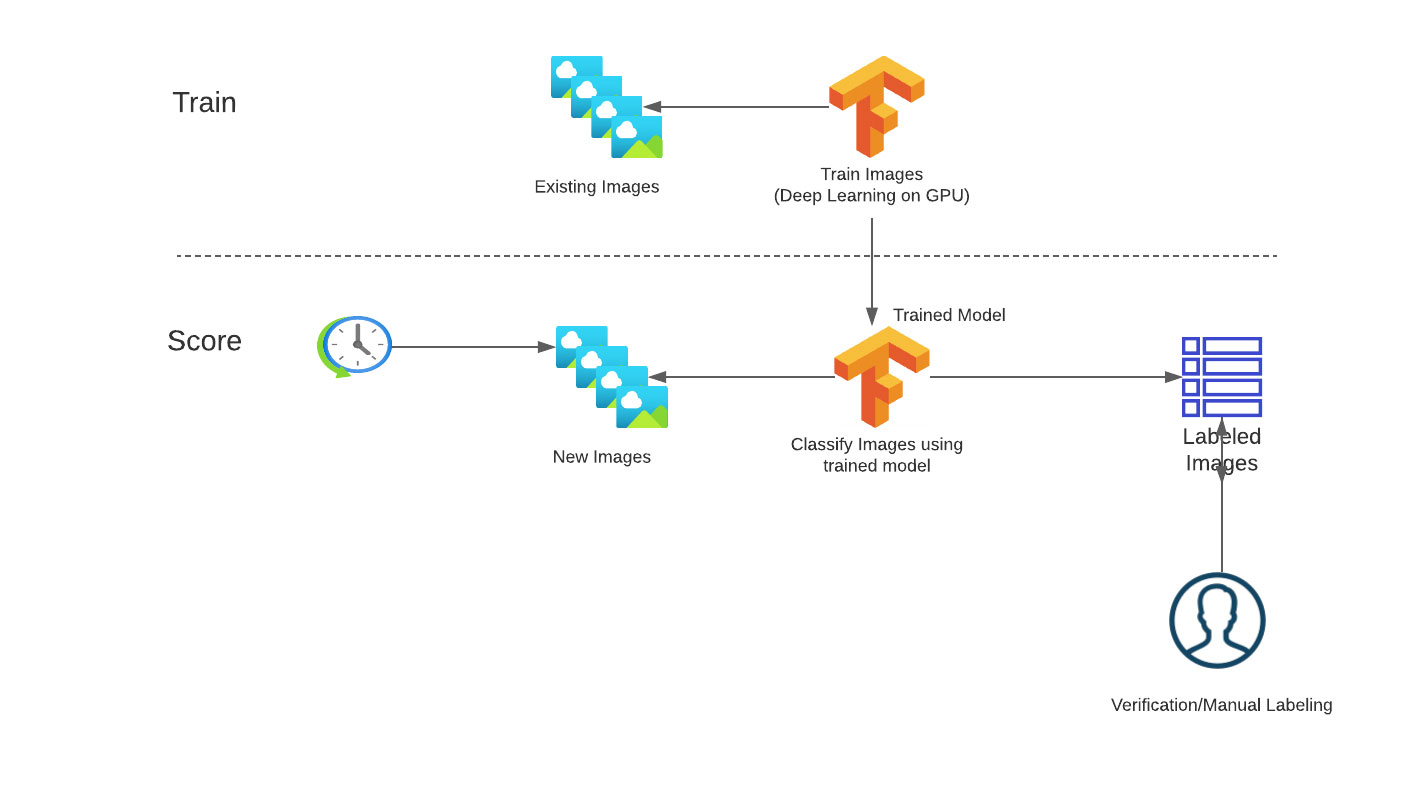
Typical image classification machine learning workflow

Figure 1: Typical Image Classification Workflow

Currently, managing that process is a nightmare. Every day, their engineers copy the images, run their deep learning model to predict the image categories, and then share the results by saving the output of the model in a CSV file. The DL models have to be verified and re-trained on a regular basis to ensure that the quality of the image recognition is maintained, which is also currently a manual process conducted by the team in their own development environments. They often lose track of the latest and best versions of the underlying ML models and which images they used to train the current production model. The execution of the pipelines happens in an external tool, and they have to manage different environments to control the end-to-end flow.

Solution

In order to bring order to the chaos, CoolFundCo is adopting Databricks to automate the process. As a start, they separate the process into a training and scoring workflow.

In the training workflow, they need to:

  1. Ingest labeled images from cloud storage into the centralized lakehouse
  2. Use existing labeled images to train the machine learning model
  3. Register the newly trained model in a centralized repository

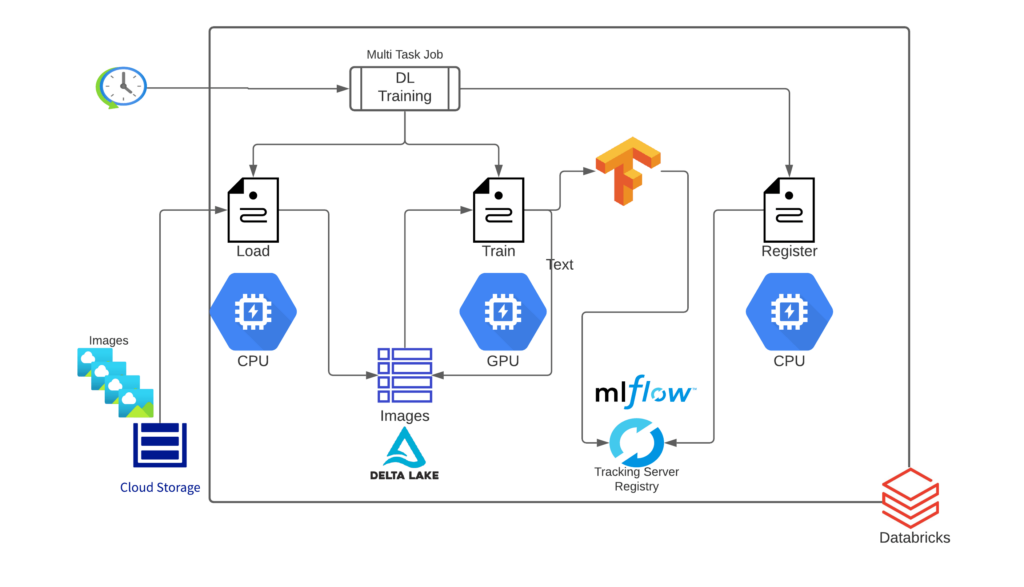
End-to-end Architecture for the DL Training Pipeline

Figure 2: End-to-end Architecture for the DL Training Pipeline


Each of their workflows consists of a set of tasks to achieve the desired outcome. Each task uses different sets of tools and functionality and therefore requires different resource configurations (cluster size, instance type, CPU vs. GPU, etc.). They decide to implement each of these tasks in a separate Databricks notebook. The resolution architecture is depicted in Figure 2:

The scoring workflow is made up of the following steps:

  1. Ingest new images from cloud storage into the centralized lakehouse
  2. Score each image using the latest model from the repository as fast as possible
  3. Store the scoring results in the centralized lakehouse
  4. Send a subset of the images to a manual labeling service to verify the accuracy

DL training pipeline

Let’s take a look at each task of the training pipeline individually :

  1. Ingest labeled images from cloud storage into the centralized data lake  [Desired Infrastructure: Large CPU Cluster]

The first step in the process is to load the image data into a usable format for the model training. They load all of the training data (i.e., the new images) using Databricks Auto Loader, which  incrementally and efficiently processes new data files as they arrive in cloud storage.  The Auto Loader feature helps data management and automatically handles continuously arriving new images. CoolFundCo’s team decides to use Auto Loader’s ‘trigger once’ functionality, which allows the Auto Loader streaming job to start,  detect any new image files since the last training job ran, load only those new files and then turn off the stream.  They load all of the images using Apache Spark’s™  binaryFile reader and parse the label from the file name and store that as its own column. The binaryFile reader converts each image file into a single record in a DataFrame that contains the raw content, as well as metadata of the file. The DataFrame will have the following columns:

  • path (StringType): The path of the file.
  • modificationTime (TimestampType): The modification time of the file. In some Hadoop FileSystem implementations, this parameter might be unavailable, and the value would be set to a default value.
  • length (LongType): The length of the file in bytes.

content (BinaryType): The contents of the file.

raw_image_df = spark.readStream.format("cloudFiles") \
              .option("cloudFiles.format", "binaryFile") \
              .option("recursiveFileLookup", "true") \
              .option("pathGlobFilter", "*.jpg") \
              .load(caltech_256_path)


image_df = raw_image_df.withColumn("label", substring(element_at(split(raw_image_df['path'], '/'), -2),1,3).cast(IntegerType())) \
                       .withColumn("load_date", current_date())

They then write all of the data into a Delta Lake table, which they can access and update throughout the rest of their training and scoring pipelines. Delta Lake adds reliability, scalability, security and performance to data lakes and allows for data warehouse- like access using standard SQL queries — which is why this type of architecture is also referred to as a lakehouse. Delta Tables automatically add version control, so each time the table is updated, a new version will indicate which images have been added.

  1. Use existing labeled images to train the machine learning model  [Desired Infrastructure: GPU Cluster]

The second step in the process is to use their pre-labeled data to train the model. They can use Petastorm,  an open source data access library that allows for the training of deep learning models directly from Parquet files and Spark DataFrames. They read the  Delta table of images directly into a Spark Dataframe, process each image to the correct shape and format and then use Petastorm’s Spark Converter to generate the input features for their model.

converter_train = make_spark_converter(df_train)
converter_val = make_spark_converter(df_val)

def transform_row(pd_batch):
  pd_batch['features'] = pd_batch['content'].map(lambda x: preprocess(x))
  pd_batch = pd_batch.drop(labels='content', axis=1)
  return pd_batch

transform_spec_fn = TransformSpec(
  transform_row, 
  edit_fields=[('features', np.float32, IMG_SHAPE, False)], 
  selected_fields=['features', 'label']
)

 with converter_train.make_tf_dataset(transform_spec=transform_spec_fn, 
                                       cur_shard=hvd.rank(), shard_count=hvd.size(),
                                       batch_size=BATCH_SIZE) as train_reader, \
       converter_val.make_tf_dataset(transform_spec=transform_spec_fn, 
                                     cur_shard=hvd.rank(), shard_count=hvd.size(),
                                     batch_size=BATCH_SIZE) as test_reader:
     # tf.keras only accept tuples, not namedtuples
      train_dataset = train_reader.map(lambda x: (x.features, x.label))
      steps_per_epoch = len(converter_train) // (BATCH_SIZE * hvd.size())

      test_dataset = test_reader.map(lambda x: (x.features, x.label))

In order to scale deep learning training, they want to take advantage of not just a single large GPU, but a cluster of GPUs. On Databricks, this can be done simply by importing and using HorovodRunner, a general API to run distributed deep learning workloads on a Spark Cluster using Uber’s Horovod framework.

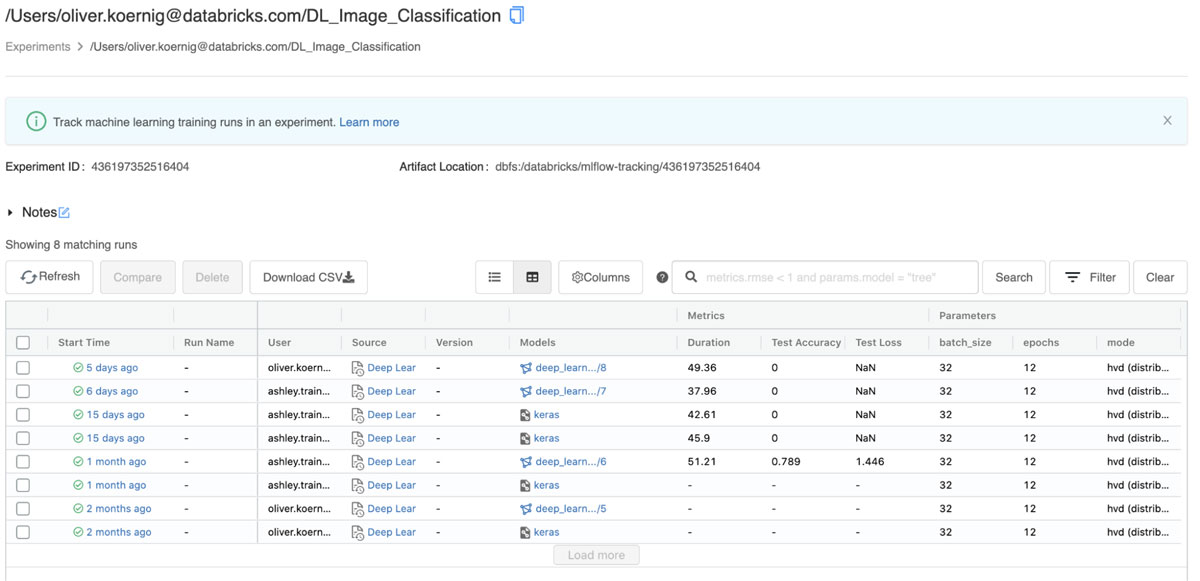
Using MLflow, the team is able to track the entire model training process, including hyperparameters, training duration, loss and accuracy metrics, and the model artifact itself, to an MLflow experiment. The MLflow API has auto-logging functionality for the most common ML libraries, including Spark MLlib, Keras, Tensorflow, SKlearn and XGBoost. This feature automatically logs model-specific metrics, parameters and model artifacts. On Databricks, when using a Delta training data source, auto-logging also tracks the version of data being used to train the model, which allows for easy reproducibility of any training run on the original dataset.

Databricks managed MLflow Experiment UI

Figure 4:Databricks managed MLflow Experiment UI

  1. Register the newly trained model in the MLflow Registry – [Desired Infrastructure: Single Node CPU Cluster]

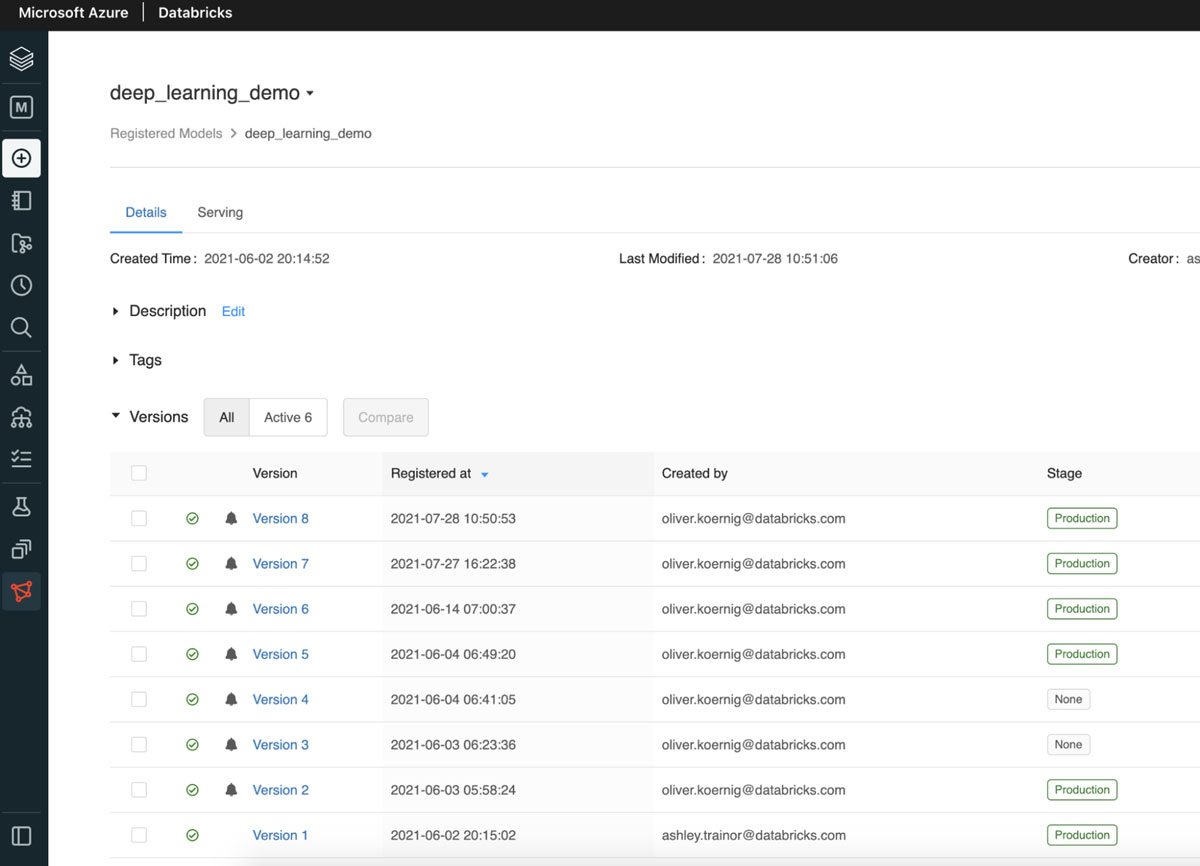
The final step in their model training pipeline is to register the newly trained model in the Databricks Model Registry. Using the artifact stored in the previous training step, they can create a new version of their image classifier. As the model is transitioned from a new model version to staging and then production, they can develop and run other tasks that can validate model performance, scalability and more.  The Databricks Models UI shows the latest status of the model (see below).

Databricks MLflow Models UI showing the latest production level ml model

Figure 5: Models UI showing the latest production level model

Scoring pipeline

Next, we can look at the steps in CoolFundCo’s scoring pipeline:

  1. Ingest new unlabeled images from cloud storage into the centralized data lake [Desired Infrastructure: Large CPU Cluster]

The first step in the scoring process is to load the newly landed image data into a usable format for the model to classify. They load all of the new images using Databricks Auto Loader. CoolFundCo’s team again decides to use Auto Loader’s trigger once functionality, which allows the Auto Loader streaming job to start, detect any new image files since the last scoring job ran,  load only those new files and then  turn off the stream. In the future, they can opt to change this job to run as a continuous stream. In that case, new images that are landed in their cloud storage will be picked up and sent to the model for scoring as soon as they arrive.

As the last step, all the unlabeled images are stored in a Delta Lake table, which can be accessed and updated throughout the rest of their scoring pipeline.

  1. Score new images and update their predicted labels in the Delta table [Desired Infrastructure: GPU Cluster]

Once the new images are loaded into our Delta table, they can run our model scoring notebook. This notebook takes all of the records (images) in the table that do not have a label or predicted label yet, loads the production version of the classifier model that was trained in our training pipeline, uses the model to classify each image and then updates the Delta table with the predicted labels. Because we are using the Delta format, we can use the MERGE INTO command to update all records in the table that have new predictions.

%sql
MERGE INTO image_data i
    USING preds p
    ON i.path = p.path
    WHEN MATCHED THEN UPDATE SET *
    WHEN NOT MATCHED THEN INSERT *
  1. Send images to be manually labeled by Azure [Desired Infrastructure: Single Node CPU]

CoolFundCo uses the Azure Machine Learning labeling service  to manually label a subset of new images. Specifically, they sample the images for which the DL model can’t make a very confident decision — less than 95% certain about the label. They can then select those images easily from the Delta table, where all of the images, image metadata and label predictions are being stored as a result of the scoring pipeline. Those images are then written to a location being used as the labeling service’s datastore. With the labeling service’s incremental refresh, the images to be labeled are found by the labeling project and labeled. The output of the labeling service can then be reprocessed by Databricks and MERGED into the Delta table, populating the label field for the image.

Setting Up the Azure Data Labeling Service

Figure 6:Setting Up the Azure Data Labeling Service

Workflow deployment

Once the training, scoring, and labeling task notebooks have been tested successfully, they can be put into the production pipelines. These pipelines will run the training, scoring and labeling processes in regular intervals (e.g., daily, weekly, bi-weekly or monthly) based on the team’s desired schedule. For this functionality, Databricks’ new Jobs Orchestration feature is the ideal solution, as it enables you to reliably schedule and trigger sequences of Jobs that contain multiple tasks with dependencies. Each notebook is a task, and their overall training pipeline, therefore, creates a Directed Acyclic Graph (DAG). This is a similar concept to what open source tools like Apache Airflow create; however, the benefit is that the entire end-to-end process is completely embedded within the Databricks environment, and thus makes it very easy to manage, execute and monitor these processes in one place.

Setting up a task

Each step or “task” in the workflow has its own assigned Databricks Notebook and cluster configuration. This allows each step in the workflow to be executed on a different cluster with a different number of instances, instance types (memory vs compute optimized, CPU vs. GPU), pre-installed libraries, auto-scaling setting and so forth. It also allows for parameters to be configured and passed to individual tasks.

In order to use the Jobs Orchestration public preview feature, it has to be enabled in the Databricks Workspace by a workspace  admin.  It will replace the existing (single task) jobs feature and cannot be reversed. Therefore it’s best to try this in a separate Databricks workspace if possible as there could potentially be compatibility issues with previously defined single tasks jobs.

Training pipeline in Databricks Jobs Orchestration The workflows are defined in JSON format and can be stored and replicated as such. This is an example of what the training workflow JSON file looks like:

Figure 7: Training Pipeline in Databricks Jobs Orchestration

{
    "email_notifications": {},
    "name": "Pipeline_DL_Image_Train",
    "max_concurrent_runs": 1,
    "tasks": [
        {
            "existing_cluster_id": "0512-123048-hares793",
            "notebook_task": {
                "notebook_path": "/Repos/oliver.koernig/databricks_dl_demo/Deep Learning Image Prep - Initial Data Load",
                "base_parameters": {
                    "image_path": "/tmp/256_ObjectCategories/"
                }
            },
            "email_notifications": {},
            "task_key": "Load_Images_for_Training"
        },
…
}

The image scoring workflow is a separate Jobs Orchestration pipeline that will be executed once a day. As GPUs may not provide enough of an advantage for image scoring, all the nodes use regular CPU-based Compute clusters.

Scoring Pipeline in Databricks Jobs Orchestration

Figure 8: Scoring Pipeline in Databricks Jobs Orchestration

Lastly, in order to further improve and validate the accuracy of the classification, the scoring workflow picks a subset of the images and makes them available to a manual image labeling service. In this example, we are using Azure ML’s manual labeling services. Other cloud providers offer similar services.

Executing and monitoring the Jobs Orchestration pipelines

When Jobs Orchestration pipelines are executed, users can  view progress in real time in the Jobs viewer.  This allows for an easy check if the pipelines are running correctly and how much time has passed.

For more info on how to manage Jobs Orchestration pipelines, please refer to the online documentation.

Executing the Scoring pipeline in Databricks Jobs Orchestration

Figure 9: Executing the Scoring Pipeline in Databricks Jobs Orchestration

Conclusion

After implementing the DL pipelines in Databricks, CoolFundCo was able to solve their key challenges:

  • All images and their labels are stored in a centralized and managed location and are easy to access for engineers, data scientists and analysts alike.
  • New and improved versions of the model are managed and accessible in a central repository (MLflow registry).  There is no more confusion about which models are properly tested or are the most current and which ones can be used in production.
  • Different pipelines (training and scoring) can run at different times while using different compute resources, even within the same workflow.
  • By using Databricks Jobs Orchestration, the execution of the pipelines happens in the same Databricks environment and is easy to schedule, monitor and manage.

Using this new and improved process, the data scientists and ML engineers can now focus on what’s truly important – gaining deep insights to – rather than waste time wrangling ML Ops-related issues.

Getting started

All the code from this blog can be found in the following GitHub repository

​​https://GitHub.com/koernigo/databricks_dl_demo

Simply clone the repo into your workspace by using the Databricks Repos feature.


Notes

The images used in the demo are based on the Caltech256 dataset, which can be accessed using Kaggle e.g. the dataset is stored in the Databricks File System (DBFS) under /tmp/256_ObjectCategories/.  An example of how to download and install the dataset using a Databricks Notebook is provided in the repo:
https://github.com/koernigo/databricks_dl_demo/blob/main/Create%20Sample%20Images.py

There is a setup notebook that is also provided in the repo.  It contains the DDL for the Delta table used throughout the pipelines. It also separates a subset of our image data downloaded from Kaggle in the step above into a separate scoring folder. This folder is at the DBFS location /tmp/unlabeled_images/256_ObjectCategories/ and will represent a location where unlabeled images land when they need to be scored by the model

This notebook can be found in the repo here:
https://github.com/koernigo/databricks_dl_demo/blob/main/setup.py

The training and scoring jobs are also included in the repo, represented as JSON files.

The Jobs Orchestration UI currently does not allow the creation of the job via JSON using the UI. If you would like to use the JSON from the repo, you will need to install the Databricks CLI.

Once the CLI is  installed and configured, please follow these steps to replicate the jobs in your Databricks workspace:

  1. Clone repo locally (command line):
    git clone https://github.com/koernigo/databricks_dl_demo
    cd databricks_dl_demo
  2. Create GPU and non-gpu (CPU clusters:
    For this demo, we use a GPUenabled cluster and a CPUbased one.  Please create two clusters. Example cluster specs can be found here:
    https://github.com/koernigo/databricks_dl_demo/blob/main/dl_demo_cpu.json
    https://github.com/koernigo/databricks_dl_demo/blob/main/dl_demo_ml_gpu.json
    Please note that certain features in this cluster spec are Azure Databricks specific (e.g., node types). If you are running the code on AWS or GCP, you will need to use equivalent GPU/CPU node types.
  3. Edit the  JSON job spec
    Select the job JSON spec you want to create, e.g., the training pipeline (https://github.com/koernigo/databricks_dl_demo/blob/main/Pipeline_DL_Image_train.json). You need to replace the cluster-ids of all the clusters with the clusters you created in the previous step (CPU and  GPU)
  4. Edit the Notebook path
    In the existing JSON the repo path is /Repos/oliver.koernig@databricks.com/… Please find and replace them with the repos path in your workspace  (usually /Repos/<your_e_mail_address)/…
  5. Create the job using the Databricks CLI
    databricks jobs create –json-file Pipeline_DL_Image_train.json –profile <your CLI profile name>
  6. Verify in the Jobs UI that your job was created successfully

Example of how Databricks’ US makes it easy to verify that your DL pipeline job was created successfully.

--

Try Databricks for free. Get started today.

The post How to Manage End-to-end Deep Learning Pipelines w/ Databricks appeared first on Databricks.
Announcing Databricks Autologging for Automated ML Experiment Tracking

$
0
0

Machine learning teams require the ability to reproduce and explain their results–whether for regulatory, debugging or other purposes. This means every production model must have a record of its lineage and performance characteristics. While some ML practitioners diligently version their source code, hyperparameters and performance metrics, others find it cumbersome or distracting from their rapid prototyping. As a result, data teams encounter three primary challenges when recording this information: (1) standardizing machine learning artifacts tracked across ML teams, (2) ensuring reproducibility and auditability across a diverse set of ML problems and (3) maintaining readable code across many logging calls.

Ensure reproducibility of ML models


Databricks Autologging automatically tracks model training sessions from a variety of ML frameworks, as demonstrated in this scikit-learn example. Tracked information is displayed in the Experiment Runs sidebar and in the MLflow UI.

To address these challenges, we are happy to announce Databricks Autologging, a no-code solution that leverages Managed MLflow to provide automatic experiment tracking for all ML models across an organization. With Databricks Autologging, model parameters, metrics, files and lineage information are captured when users run training code in a notebook – without needing to import MLflow or write lines of logging instrumentation.

Training sessions are recorded as MLflow Tracking Runs for models from a variety of popular ML libraries, including scikit-learn, PySpark MLlib and TensorFlow. Model files are also tracked for seamless registration with the MLflow Model Registry and deployment for real-time scoring with MLflow Model Serving.

Use Databricks Autologging

To use Databricks Autologging, simply train a model in a supported framework of your choice via an interactive Databricks Python notebook. All relevant model parameters, metrics, files and lineage information are collected automatically and can be viewed on the Experiment page. This makes it easy for data scientists to compare various training runs to guide and influence experimentation. Databricks Autologging also tracks hyperparameter tuning sessions in order to help you define appropriate search spaces with UI visualizations, such as the MLflow parallel coordinates plot.

You can customize the behavior of Databricks Autologging using API calls. The mlflow.autolog() API provides configuration parameters to control model logging, collection of input examples from training data, recording of model signature information and more use cases. Finally, you can use the MLflow Tracking API to add supplemental parameters, tags, metrics and other information to model training sessions recorded by Databricks Autologging.

Manage MLflow runs

All model training information tracked with Autologging is stored in Managed MLflow on Databricks and secured by MLflow Experiment permissions. You can share, modify or delete model training information using the MLflow Tracking API or UI.

Next steps

Databricks Autologging will begin rolling out to select Databricks workspaces in Public Preview, beginning with version 9.0 of the Databricks Machine Learning Runtime, and will become broadly available over the next several months. To learn more about feature availability, see the Databricks Autologging documentation.

--

Try Databricks for free. Get started today.

The post Announcing Databricks Autologging for Automated ML Experiment Tracking appeared first on Databricks.
Announcing Databricks Serverless SQL

$
0
0

Databricks SQL already provides a first-class user experience for BI and SQL directly on the data lake, and today, we are excited to announce another step in making data and AI simple with Databricks Serverless SQL. This new capability for Databricks SQL provides instant compute to users for their BI and SQL workloads, with minimal management required and capacity optimizations that can lower overall cost by an average of 40%. This makes it even easier for organizations to expand adoption of the lakehouse for business analysts who are looking to access the rich, real-time datasets of the lakehouse with a simple and performant solution.

Under the hood of this capability is an active server fleet, fully managed by Databricks, that can transfer compute capacity to user queries, typically in about 15 seconds. The best part? You only pay for Serverless SQL when users start running reports or queries.

Organizations with business analysts who want to analyze data in the data lake with their favorite BI tools will benefit from this capability. First, connecting BI tools to Serverless SQL is easy, especially with built-in connectors using optimized JDBC/ODBC drivers for easy authentication support and high performance.

Databricks SQL native connectors makes it easy to connect your data lake to your favorite BI or SQL tool.

Connect your favorite BI or SQL tool

Second, Serverless SQL was built for the modern business analyst, who works on their own schedules and wants instant compute available to process their queries without waiting for clusters to start up or scale out. Administrators are the ones battling to stay ahead of these user workloads with manual configurations and cluster startups/shutdown schedules, but it’s imperfect at best and incurs extra costs for over-provisioning and excess idle time.

Use the Databricks SQL console to enable Serverless SQL with 1-click.

Enable Serverless SQL
with 1-click

This is where Serverless SQL shines with instant compute availability for all users. It only takes one click to enable, there is no performance tuning, and patching and upgrades are managed automatically. By default, if at any point the cluster is idle for 10 minutes, Serverless SQL will automatically shut it down, remove the resources and prepare to start the instant compute process over again for the next query. This is how Serverless SQL helps lower overall costs – by matching capacity to usage that avoids over-provisioning and idle capacity when users are inactive.

Customers have already started using Serverless SQL and seen the benefits:

“Having the ability to fetch data ad-hoc with compute available within seconds helps our teams get answers quickly. Being able to autoscale up and down aggressively given the fast startup time makes our spiky workloads with BI and reporting tools easier to manage.”
Anup Segu, Data Engineering Tech Lead, YipitData

“Serverless SQL is easy to use and allows us to unlock more performance at the same price point. We already see improved query performance and lower costs using this feature for our spiky BI workloads.”
Ben Thwaites, Sr. Data Engineer, Intelematics

Inside Serverless SQL

At the core of Serverless SQL is a compute platform that operates a pool of servers, located in Databricks’ account, running Kubernetes containers that can be assigned to a user within seconds.

At the core of Databricks Serverless SQL is a compute platform that operates a pool of servers, located in Databricks’ account, running Kubernetes containers that can be assigned to a user within seconds.

Serverless SQL compute platform

When many users are running reports or queries at the same time, the compute platform adds more servers to the cluster (again, within seconds) to handle the concurrent load. Databricks manages the entire configuration of the server and automatically performs the patching and upgrades as needed.

Each server is running a secure configuration and all processing is secured by three layers of isolation – the Kubernetes container hosting the runtime, the virtual machine (VM) hosting the container and the virtual network for the workspace. Each layer is isolated to one workspace with no sharing or cross-network traffic allowed. The containers use hardened configurations, VMs are shut down and not reused, and network traffic is restricted to nodes in the same cluster.

Comparing startup time, execution time and cost

We ran a set of internal tests to compare Databricks Serverless SQL to the current Databricks SQL and several traditional cloud data warehouses. We found Serverless SQL to be the most cost-efficient and performant environment to run SQL workloads when considering cluster startup time, query execution time and overall cost.

Internal testing found Databricks Serverless SQL to be the most cost-efficient and performant environment to run SQL workloads when considering cluster startup time, query execution time, and overall cost.

2021 Cloud Data Warehouse Benchmark Report: Databricks research

Getting started

Databricks Serverless SQL is another step in making BI and SQL on the Lakehouse simple. Customers benefit from the instant compute, minimal management and lower cost from a high-performance platform that is accessible to their favorite BI and SQL tools. Users will love the boost to their productivity, while administrators have peace of mind knowing their users are productive without blowing the budget from over-provisioning capacity or wasted idle compute. Everybody wins!

Serverless SQL is available today in public preview on AWS; please use the below form to request access.

Sign Up for Access to Databricks Serverless SQL

The post Announcing Databricks Serverless SQL appeared first on Databricks.

Frequently Asked Questions About the Data Lakehouse

$
0
0

Question Index

What is a Data Lakehouse?
How is a Data Lakehouse different from a Data Warehouse?
How is the Lakehouse different from a Data Lake?
How easy is it for data analysts to use a Data Lakehouse?
How do Lakehouse systems compare in performance and cost to data warehouses?
What data governance functionality do Data Lakehouse systems support?
Does the Lakehouse have to be centralized or can it be decentralized into a Data Mesh?
How does the Data Mesh relate to the Lakehouse?


What is a Data Lakehouse?

In short, a Data Lakehouse is an architecture that enables efficient and secure Artificial Intelligence (AI) and Business Intelligence (BI) directly on vast amounts of data stored in Data Lakes.

Today, the vast majority of enterprise data lands in data lakes, low-cost storage systems that can manage any type of data (structured or unstructured) and have an open interface that any processing tool can run against. These data lakes are where most data transformation and advanced analytics workloads (such as AI) run to take advantage of the full set of data in the organization. Separately, for Business Intelligence (BI) use cases, proprietary data warehouse systems are used on a much smaller subset of the data that is structured. These data warehouses primarily support BI, answering historical analytical questions about the past using SQL (e.g., what was my revenue last quarter), while the data lake stores a much larger amount of data and supports analytics using both SQL and non-SQL interfaces, including predictive analytics and AI (e.g. which of my customers will likely churn, or what coupons to offer at what time to my customers). Historically, to accomplish both AI and BI, you would have to have multiple copies of the data and move it between data lakes and data warehouses.

The Data Lakehouse enables storing all your data once in a data lake and doing AI and BI on that data directly. It has specific capabilities to efficiently enable both AI and BI on all the enterprise’s data at a massive scale. Namely, it has the SQL and performance capabilities (indexing, caching, MPP processing) to make BI work fast on data lakes. It also has direct file access and direct native support for Python, data science, and AI frameworks without ever forcing it through a SQL-based data warehouse. The key technologies used to implement Data Lakehouses are open source, such as Delta Lake, Hudi, and Iceberg. Vendors who focus on Data Lakehouses include, but are not limited to Databricks, AWS, Dremio, and Starburst. Vendors who provide Data Warehouses include, but are not limited to, Teradata, Snowflake, and Oracle.

Recently, Bill Inmon, widely considered the father of data warehousing, published a blog post on the Evolution of the Data Lakehouse explaining the unique ability of the lakehouse to manage data in an open environment while combining the data science focus of the data lake with the end-user analytics of the data warehouse.

How is a Data Lakehouse different from a Data Warehouse?

The lakehouse builds on top of existing data lakes, which often contain more than 90% of the data in the enterprise. While most data warehouses support “external table” functionality to access that data, they have severe functionality limitations (e.g., only supporting read operations) and performance limitations when doing so. Lakehouse instead adds traditional data warehousing capabilities to existing data lakes, including ACID transactions, fine-grained data security, low-cost updates and deletes, first-class SQL support, optimized performance for SQL queries, and BI style reporting. By building on top of a data lake, the Lakehouse stores and manages all existing data in a data lake, including all varieties of data, such as text, audio and video, in addition to structured data in tables. Lakehouse also natively supports data science and machine learning use cases by providing direct access to data using open APIs and supporting various ML and Python/R libraries, such as PyTorch, Tensorflow or XGBoost, unlike data warehouses. Thus, Lakehouse provides a single system to manage all of an enterprise’s data while supporting the range of analytics from BI and AI.

On the other hand, data warehouses are proprietary data systems that are purpose-built for SQL-based analytics on structured data, and certain types of semi-structured data. Data warehouses have limited support for machine learning and cannot support running popular open source tools natively without first exporting the data (either through ODBC/JDBC or to a data lake). Today, no data warehouse system has native support for all the existing audio, image, and video data that is already stored in data lakes.

How is the Lakehouse different from a Data Lake?

The most common complaint about data lakes is that they can become data swamps. Anybody can dump any data into a data lake; there is no structure or governance to the data in the lake. Performance is poor, as data is not organized with performance in mind, resulting in limited analytics on data lakes. As a result, most organizations use data lakes as a landing zone for most of their data due to the underlying low-cost object storage data lakes use and then move the data to different downstream systems such as data warehouses to extract value.

Lakehouse tackles the fundamental issues that make data swamps out of data lakes. It adds ACID transactions to ensure consistency as multiple parties concurrently read or write data. It supports DW schema architectures like star/snowflake-schemas and provides robust governance and auditing mechanisms directly on the data lake. It also leverages various performance optimization techniques, such as caching, multi-dimensional clustering, and data skipping, using file statistics and data compaction to right-size the files enabling fast analytics. And it adds fine-grained security and auditing capabilities for data governance. By adding data management and performance optimizations to the open data lake, lakehouse can natively support BI and ML applications.

How easy is it for data analysts to use a Data Lakehouse?

Data lakehouse systems implement the same SQL interface as traditional data warehouses, so analysts can connect to them in existing BI and SQL tools without changing their workflows. For example, leading BI products such as Tableau, PowerBI, Qlik, and Looker can all connect to data lakehouse systems, data engineering tools like Fivetran and dbt can run against them, and analysts can export data into desktop tools such as Microsoft Excel. Lakehouse’s support for ANSI SQL, fine-grained access control, and ACID transactions enables administrators to manage them the same way as data warehouse systems but cover all the data in their organization in one system.

One important advantage of Lakehouse systems in simplicity is that they manage all the data in the organization, so data analysts can be granted access to work with raw and historical data as it arrives instead of only the subset of data loaded into a data warehouse system. An analyst can therefore easily ask questions that span multiple historical datasets or establish a new pipeline for working with a new dataset without blocking on a database administrator or data engineer to load the appropriate data. Built-in support for AI also makes it easy for analysts to run AI models built by a machine learning team on any data.

How do Lakehouse systems compare in performance and cost to data warehouses?

Data Lakehouse systems are built around separate, elastically scaling compute and storage to minimize their cost of operation and maximize performance. Recent systems provide comparable or even better performance per dollar to traditional data warehouses for SQL workloads, using the same optimization techniques inside their engines (e.g., query compilation and storage layout optimizations). In addition, Lakehouse systems often take advantage of cloud provider cost-saving features such as spot instance pricing (which requires the system to tolerate losing worker nodes mid-query) and reduced prices for infrequently accessed storage, which traditional data warehouse engines have usually not been designed to support.

What data governance functionality do Data Lakehouse systems support?

By adding a management interface on top of data lake storage, Lakehouse systems provide a uniform way to manage access control, data quality, and compliance across all of an organization’s data using standard interfaces similar to those in data warehouses. Modern Lakehouse systems support fine-grained (row, column, and view level) access control via SQL, query auditing, attribute-based access control, data versioning, and data quality constraints and monitoring. These features are generally provided using standard interfaces familiar to database administrators (for example, SQL GRANT commands) to allow existing personnel to manage all the data in an organization in a uniform way. Centralizing all the data in a Lakehouse system with a single management interface also reduces the administrative burden and potential for error that comes with managing multiple separate systems.

Does the Lakehouse have to be centralized or can it be decentralized into a Data Mesh?

No, organizations do not need to centralize all their data in one Lakehouse. Many organizations using the Lakehouse architecture take a decentralized approach to store and process data but take a centralized approach to security, governance, and discovery. Depending on organizational structure and business needs, we see a few common approaches:

  • Each business unit builds its own Lakehouse to capture its business’ complete view – from product development to customer acquisition to customer service.
  • Each functional area, such as product manufacturing, supply chain, sales, and marketing, could build its own Lakehouse to optimize operations within its business area.
  • Some organizations also spin up a new Lakehouse to tackle new cross-functional strategic initiatives such as customer 360 or unexpected crises like the COVID pandemic to drive fast, decisive action.


The unified nature of the Lakehouse architecture enables data architects to build simpler data architectures that align with the business needs without complex orchestration of data movement across siloed data stacks for BI and ML. Furthermore, the openness of the Lakehouse architecture enables organizations to leverage the growing ecosystem of open technologies without fear of lock-in to addressing the unique needs of the different business units or functional areas. Because Lakehouse systems are usually built on separated, scalable cloud storage, it is also simple and efficient to let multiple teams access each lakehouse. Recently,
Delta Sharing proposed an open and standard mechanism for data sharing across Lakehouses with support from many different vendors.

How does the Data Mesh relate to the Lakehouse?

Zhamak Dehghani has outlined four fundamental organizational principles that embody any data mesh implementation. The Lakehouse architecture can be used to implement these organizational principles:

  • Domain-oriented decentralized data ownership and architecture: As discussed in the previous section, the lakehouse architecture takes a decentralized approach to data ownership. Organizations can create many different lakehouses to serve the individual needs of the business groups. Based on their needs, they can store and manage various data – images, video, text, structured tabular data, and related data assets such as machine learning models and associated code to reproduce transformations and insights.
  • Data as a product: The lakehouse architecture helps organizations manage data as a product by providing different data team members in domain-specific teams complete control over the data lifecycle. Data team comprising of a data owner, data engineers, analysts, and data scientists can manage data (structured, semi-structured, and unstructured with proper lineage and security controls), code (ETL, data science notebooks, ML training, and deployment), and supporting infrastructure (storage, compute, cluster policies, and various analytics and ML engines). Lakehouse platform features such as ACID transactions, data versioning, and zero-copy cloning make it easy for these teams to publish and maintain their data as a product.
  • Self-serve data infrastructure as a platform: The lakehouse architecture provides an end-to-end data platform for data management, data engineering, analytics, data science, and machine learning with integrations to a broad ecosystem of tools. Adding data management on top of existing data lakes simplifies data access and sharing – anyone can request access, the requester pays for cheap blob storage and gets immediate secure access. In addition, using open data formats and enabling direct file access, data teams can use best-of-breed analytics and ML frameworks on the data.
  • Federated computational governance: The governance in the lakehouse architecture is implemented by a centralized catalog with fine-grained access controls (row/column level), enabling easy discovery of data and other artifacts like code and ML models. Organizations can assign different administrators to different parts of the catalog to decentralize control and management of data assets. This hybrid approach of a centralized catalog with federated control preserves the independence and agility of the local domain-specific teams while ensuring data asset reuse across these teams and enforcing a common security and governance model globally.

--

Try Databricks for free. Get started today.

The post Frequently Asked Questions About the Data Lakehouse appeared first on Databricks.
How Incremental ETL Makes Life Simpler With Data Lakes

$
0
0

Incremental ETL (Extract, Transform and Load) in a conventional data warehouse has become commonplace with CDC (change data capture) sources, but scale, cost, accounting for state and the lack of machine learning access make it less than ideal. In contrast, incremental ETL in a data lake hasn’t been possible due to factors such as the inability to update data and identify changed data in a big data table. Well, it hasn’t been possible until now. The incremental ETL process has many benefits including that it is efficient, simple and produces a flexible data architecture that both data scientists and data analysts can use. This blog walks through these advantages of incremental ETL and the data architectures that support this modern approach.

Let’s first dive into what exactly incremental ETL is. At a high level, it is the movement of data between source and destination – but only when moving new or changed data. The data moved through incremental ETL can be virtually anything – web traffic events or IoT sensor readings (in the case of append data) or changes in enterprise databases (in the case of CDC). Incremental ETL can either be scheduled as a job or run continuously for low-latency access to new data, such as that for business intelligence (BI) use cases. The architecture below shows how incremental data can move and transform through multiple tables, each of which can be used for different purposes.

The Databricks incremental ETL process makes the medallion table architecture possible and efficient so that all consumers of data can have the correct curated data sets for their needs.

Advantages of incremental ETL with data lakes

There are many reasons to leverage incremental ETL. Open source big data technologies, such as Delta Lake and Apache Spark™, make it even more seamless to do this work at scale, cost-efficiently and without needing to worry about vendor lock-in. The top advantages of taking this approach include:

  • Inexpensive big data storage: Using big data storage as opposed to data warehousing makes it possible to separate storage from compute and retain all historical data in a way that is not cost prohibitive, giving you the flexibility to go back and run different transformations that are unforeseen at design time.
  • Efficiency: With incremental ETL, you can process only data that needs to be processed, either new data or changed data. This makes the ETL efficient, reducing costs and processing time.
  • Multiple datasets and use cases: Each landed dataset in the process serves a different purpose and can be consumed by different end-user personas. For example, the refined and aggregated datasets (gold tables) are used by data analysts for reporting, and the refined event-level data is used by data scientists to build ML models. This is where the medallion table architecture can really help get more from your data.
  • Atomic and always available data: The incremental nature of the processing makes the data usable at any time since you are not blowing away or re-processing data. This makes the intermediate and also end state tables available to different personas at any given point in time. Atomicity of the data means that, at a row level, either the row will wholly succeed or fail, and this makes it possible to read data as it is committed. Until now, in big data technologies, atomicity at a row level has not been possible. Incremental ETL changes that.
  • Stateful changes: Knowing where the ETL is at any given point is the state. State can be very hard to track in ETL, but the features in incremental ETL track the state by default, which makes coding ETL significantly easier. This helps for both scheduled jobs and when there is an error to pick up where you left off.
  • Latency: Easily drop the cadence of the jobs from daily to hourly to continual in incremental ETL. Latency is the time difference between when data is available to process and when it is processed, which can be reduced by dropping the cadence of a job.
  • Historic datasets/reproducibility: The sequence of data and how it comes in is kept in order so that if there is an error or the ETL needs to be reproduced, it can be done.

If incremental ETL is so great, why are we not already doing it?

You may be asking yourself this question. You are probably familiar with parts of the architecture or how this would work in a data warehouse, where it can be prohibitively expensive. Let’s explore some of the reasons why in the past, such an architecture would be hard to pull off before exploring the big data technologies that make it possible.

  • Cost: The idea of CDC/event-driven ETL is not new to the data warehousing world, but it can be cost prohibitive to keep all historical data in a data warehouse, as well as having multiple tables available as the data moves through the architecture. Not to mention the cost and resource allocation in the case of continuously running incremental ETL processes or ELT in a data warehouse. ELT is Extract, Load and THEN Transform, which is commonly used in a data warehouse architecture.
  • Updating data: It sounds trivial, but until recently, updating the data in a data lake has been extremely difficult, and sometimes not possible, especially at scale or when the data is being read simultaneously.
  • State: Incrementally knowing where the last ETL job left off and where to pick up can be tough if you are accounting for state ad hoc, but now there are technologies that make it easy to pick up where you left off. This problem can be compounded when a process stops unexpectedly because of an exception.
  • Inefficient: Dealing with more than just changes can take considerably longer and more resources.
  • Big data table as an incremental data source: This is now possible because of the atomic nature of specific big data tables such as Delta Lake. It makes the intermediate table architecture possible.

What are the technologies that help get us to incremental ETL nirvana?

I’m glad you asked! Many of the innovations in Apache Spark™ and Delta Lake make it possible and easy to build data architecture built on incremental ETL. Here are the technologies that make it possible:

  • ACID Transactions in Delta Lake: Delta Lake provides ACID (atomicity, consistency, isolation, durability) transactions, which is novel to big data architectures and essential in data lakehouses. The ACID transactions make updating at a row level, as well as identifying row level changes, in source/intermediate Delta Lake tables possible. The MERGE operation makes upserts (row level inserts and updates in one operation) very easy.
  • Checkpoints: Checkpoints in Spark Structured Streaming allow for easy state management so that the state of where an ETL job left off is inherently accounted for in the architecture.
  • Trigger.Once: Trigger.Once is a feature of Spark Structured Streaming that turns continuous use cases, like reading from Apache Kafka, into a scheduled job. This means that if continuous/low latency ETL is out of scope, you can still employ many of the features. It also gives you the flexibility to drop the cadence of the scheduled jobs and eventually go to a continuous use case without changing your architecture.

Now that incremental ETL is possible using big data and open source technologies, you should evaluate how it could be used in your organization so that you can build all the curated data sets you need as efficiently and easily as possible!

To read more about the open source technologies that make incremental ETL possible, check out delta.io and spark.apache.org

--

Try Databricks for free. Get started today.

The post How Incremental ETL Makes Life Simpler With Data Lakes appeared first on Databricks.
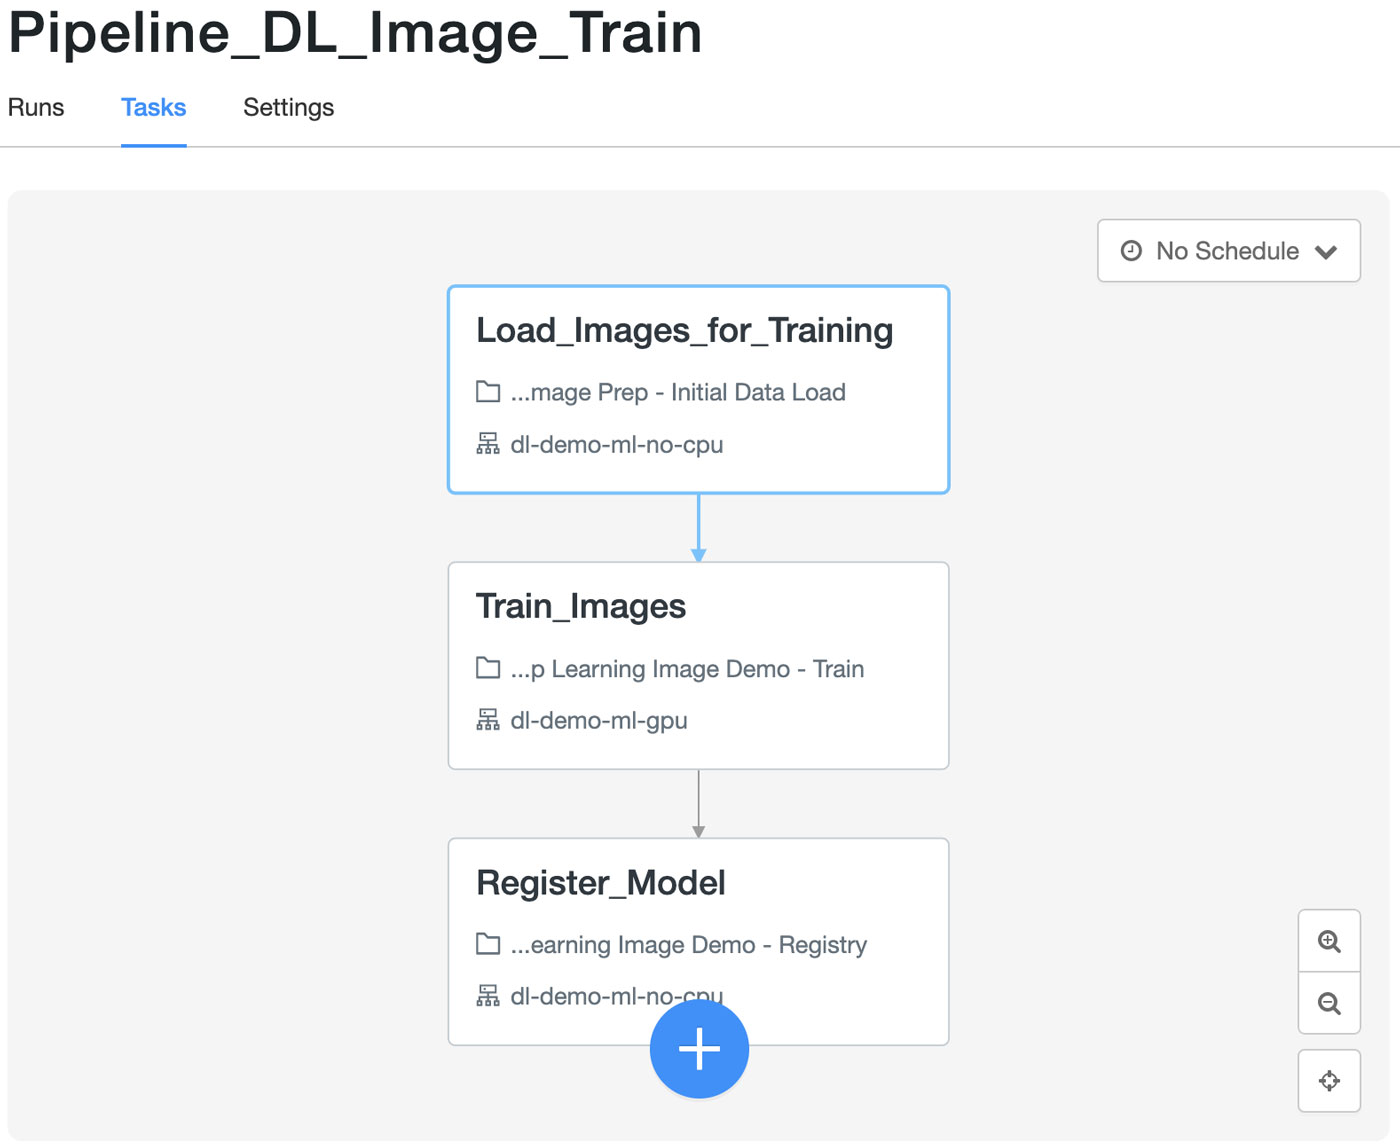

Infrastructure Design for Real-time Machine Learning Inference

$
0
0

This is a guest authored post by Yu Chen, Senior Software Engineer, Headspace.

 
Headspace’s core products are iOS, Android and web-based apps that focus on improving the health and happiness of its users through mindfulness, meditation, sleep, exercise and focus content. Machine learning (ML) models are core to our user experiences by offering recommendations that engage users with new relevant, personalized content that builds consistent habits in their lifelong journey.

Data fed to ML models is often most valuable when it can be immediately leveraged to make decisions in the moment, but, traditionally, consumer data is ingested, transformed, persisted and sits dormant for lengthy periods of time before machine learning and data analytics teams leverage it.

Finding a way to leverage user data to generate real-time insights and decisions means that consumer-facing products like the Headspace app can dramatically shorten the end-to-end user feedback loop: actions that users perform just moments prior can be incorporated into the product to generate more relevant, personalized and context-specific content recommendation for the user.

This means our ML models could incorporate dynamic features that update throughout the course of a user’s day, or even an individual session. Examples of these features include:

  • Current session bounce rates for sleep content
  • Semantic embeddings for recent user search terms. For instance, if a user recently searched for “preparing for big exam”, the ML model can assign more weight to Focus-themed meditations that fit this goal.
  • Users’ biometric data (e.g., if step counts and heart rate are increasing over the last 10 minutes, we can recommend Move or Exercise content)

With the user experience in mind, the Headspace Machine Learning team architected a solution by decomposing the infrastructure systems into modular Publishing, Receiver, Orchestration and Serving layers. The approach leverages Apache Spark™, Structured Streaming on Databricks, AWS SQS, Lambda and Sagemaker to deliver real-time inference capabilities for our ML models.

In this blog post, we provide a technical deep dive into our architecture.  After describing our requirements for real-time inference, we discuss challenges adapting traditional, offline ML workflows to meet our requirements.  We then give an architecture overview before discussing details of key architectural components.

Real-time inference requirements

In order to facilitate real-time inference that personalizes users’ content recommendations, we need to

  • Ingest, process, and forward along the relevant events (actions) that our users perform on our client apps (iOS, Android, web)
  • Quickly compute, store and fetch online features (millisecond latency) that enrich the feature set used by a real-time inference model
  • Serve and reload the real-time inference model in a way that synchronizes the served model with online feature stores while minimizing (and ideally avoiding) any downtime.

Our ballpark end-to-end latency target (from user event forwarded to Kinesis stream to real-time inference prediction available) was 30 seconds.

Challenges adapting the traditional ML model workflow

The above requirements are problems that are often not solved (and don’t need to be solved) with offline models that serve daily batch predictions. ML models that make inferences from records pulled and transformed from an ELT / ETL data pipeline usually have lead times of multiple hours for raw event data. Traditionally, an ML model’s training and serving workflow would involve the following steps, executed via periodic jobs that run every few hours or daily:

  • Pull relevant raw data from upstream data stores: For Headspace, this involves using Spark SQL to query from the upstream data lake maintained by our Data Engineering team.
    • For real-time inference: We experience up to thousands of prediction requests per second, so using SQL to query from a backend database introduces unacceptable latency. While model training requires pulling complete data sets, real-time inference often involves small, individual user subset slices of this same data. Therefore, we use AWS Sagemaker Online Feature Groups, which is capable of fetching and writing individual user features with single-digit millisecond response times (Step 3 in diagram).
  • Perform data preprocessing (feature engineering, feature extraction, etc.) using a mix of SQL and Python.
    • For real-time inference: We enrich Spark Structured Streaming micro-batches of raw event data with real-time features from Sagemaker Feature Store Groups.
  • Train the model and log relevant experiment metrics: With MLflow, we register models and then log their performance across different experiment runs from within the Databricks Notebook interface.
  • Persist the model to disk: When MLflow logs a model, it serializes the model using the ML library’s native format. For instance, scikit-learn models are serialized using the pickle library.
  • Make predictions on the relevant inference dataset: In this case, we use our newly-trained recommendation model to generate fresh content recommendations for our user base.
  • Persist the predictions to be served to users. This depends on the access patterns in production to deliver a ML prediction to an end user.
    • For real-time inference: We can register predictions to our Prediction Service so that end users who navigate to ML-powered tabs can pull down predictions. Alternatively, we can forward the predictions to another SQS queue, which will send content recommendations via push iOS/Android notifications.
  • Orchestration: Traditional batch-inference models utilize tools like Airflow to schedule and coordinate the different stages/steps.
    • For real-time inference: We use lightweight Lambda functions to unpack/pack data in the appropriate messaging formats, invoke the actual Sagemaker endpoints and perform any required post-processing and persistence.

High-level overview for Headspace’s RT ML inference architecture.

Users generate events by performing actions inside of their Headspace app — these are ultimately forwarded to our Kinesis Streams to be processed by Spark Structured Streaming. User apps fetch the near real-time predictions by making RESTful HTTP requests to our backend services, passing along their user IDs and feature flags to indicate which type of ML recommendations to send back. The other components of the architecture will be described in more detail below.

The publishing and serving layer: model training and deployment lifecycle

ML models are developed in Databricks Notebooks and evaluated via MLflow experiments on core offline metrics such as recall at k for recommendation systems. The Headspace ML team has written wrapper classes that extend the base Python Function Model Flavor class in MLflow:

# this MLflow context manager allows experiment runs (parameters and metrics) to be tracked and easily queryable
with MLModel.mlflow.start_run() as run:
    # data transformations and feature pre-processing code omitted (boiler-plate code)
    ...

    # model construction
    lr = ElasticNet(alpha=alpha, l1_ratio=l1_ratio, random_state=42)

    # training
    lr.fit(train_x, train_y)

    # evaluate the model performance
    predicted_qualities = lr.predict(test_x)
    (rmse, mae, r2) = eval_metrics(test_y, predicted_qualities)

# Wrap the model in our custom wrapper class
model = ScikitLearnModel(lr)
model.log_params(...)
model.log_metrics(...)  # record the results of the run in ML Tracking Server

# optionally save model artifacts to object store and register model (give it a semantic version)
# so it can be built into a Sagemaker-servable Docker image
model.save(register=True)

View on github

The Headspace ML team’s model wrapper class invokes MLflow’s own save_model method to perform much of the implementation logic, creating a directory in our ML Models S3 bucket that contains the metadata, dependencies and model artifacts needed to build an MLflow model Docker image:

Infrastructure Design for Real-time Machine Learning Inference

We can then create a formal Github Release that points to the model we just saved in S3. This can be picked up by CI/CD tools such as CircleCI that test and build MLflow model images that are ultimately pushed to AWS ECR, where they are deployed onto Sagemaker model endpoints.

Updating and reloading real-time models

We retrain our models frequently, but updating a real-time inference model in production is tricky. AWS has a variety of deployment patterns (gradual rollout, canary, etc.) that we can leverage to update the actual served Sagemaker model. However, real-time models also require in-sync online feature stores, which — given the size of Headspace’s user base, can take up to 30 minutes to fully update. Given that we do not want downtime each time we update our model images, we need to be careful to ensure we synchronize our feature store with our model image.

Take, for example, a model that maps a Headspace user ID to a user sequence ID as part of a collaborative filtering model — our feature stores must contain the most updated mapping of user ID to sequence ID. Unless user populations remain completely static, if we only update the model, our user IDs will be mapped to stale sequence ID at inference time, resulting in the model generating a prediction for a random user instead of the target user.

Blue-green architecture

To address this issue, we can adopt a blue-green architecture that follows from the DevOps practice of blue-green deployments. The workflow is illustrated below:

High-level overview for Headspace’s RT ML inference architecture.

  • Maintain two parallel pieces of infrastructure (two copies of feature stores, in this case).
  • Designate one as the production environment (let’s call it the “green” environment, to start) and route requests for features and predictions towards it via our Lambda.
  • Every time we wish to update our model, we use a batch process/script to update the complementary infrastructure (the “blue” environment) with the latest features. Once this update is complete, switch the Lambda to point towards the blue production environment for features/predictions.
  • Repeat this each time we want to update the model (and its corresponding feature store).

The receiver layer: event stream ingestion with Apache Spark Structured Streaming scheduled job

Headspace user event actions (logging into the app, playing a specific piece of content, renewing a subscription, searching for content, etc.) are aggregated and forwarded onto Kinesis Data Streams (Step 1 in diagram). We leverage the Spark Structured Streaming framework on top of Databricks to consume from these Kinesis Streams. There are several benefits to Structured Streaming, including that it:

  • Leverages the same unified language (Python/Scala) and framework (Apache Spark) shared by data scientists, data engineers and analysts, allowing multiple Headspace teams to reason about user data using familiar Dataset / DataFrame APIs and abstractions.
  • Allows our teams to implement custom micro-batching logic to meet business requirements. For example, we could trigger and define micro-batches based on custom event-time windows and session watermarks logic on a per-user basis.
  • Comes with existing Databricks infrastructure tools that significantly reduce the infrastructure administration burden on ML engineers. These tools include Scheduled Jobs, automatic retries, efficient DBU credit pricing, email notifications for process failure events, built-in Spark Streaming dashboards and the ability to quickly auto-scale to meet spikes in user app event activity.

Structured Streaming uses micro-batching to break up the continuous stream of events into discrete chunks, processing incoming events in small micro-batch dataframes.

Streaming data pipelines must differentiate between event-time (when the event actually occurs on the client device) and processing-time (when the data is seen by servers).  Network partitions, client-side buffering and a whole host of other issues can introduce non-trivial discrepancies between these two timestamps. The Structured Streaming API allows simple customization of logic to handle these discrepancies:

   df.withWatermark("eventTime", "10 minutes") \
    .groupBy(
      "userId",
      window("eventTime", "10 minutes", "5 minutes"))

View on github

We configure the Structured Streaming Job with the following parameters:

  • 1 Maximum Concurrent Runs
  • Unlimited retries
  • New Scheduled Job clusters (as opposed to an All-Purpose cluster)

Using Scheduled Job clusters significantly reduces compute DBU costs while also mitigating the likelihood of correlated infrastructure failures. Jobs that run on a faulty cluster—perhaps with missing/incorrect dependencies, instance profiles or overloaded availability zones—will fail until the underlying cluster issue is fixed, but separating jobs across clusters prevents interference.

We then point the stream query to read from a specially configured Amazon Kinesis Stream that aggregates user client-side events (Step 2 of diagram). The stream query can be configured using the following logic:

processor = RealTimeInferenceProcessor()

query = df.writeStream \
    .option(“checkpointLocation”, “dbfs://pathToYourCheckpoint”) \
    .foreachBatch(processor.process_batch) \
    .outputMode("append") \
    .start()

View on github

Here, outputMode defines the policy for how data is written to a streaming sink and can take on three values: append, complete and update. Since our Structured Streaming Job is concerned with handling incoming events, we select append to only process “new” rows.

It is a good idea to configure a checkpoint location to gracefully restart a failed streaming query, allowing “replays” which pick back up processing just before the failure.

Depending on the business use case, we can also choose to reduce latency by setting the argument to processingTime = “0 seconds”, which starts each micro-batch as soon as possible:

 query = df.writeStream \
    .option(“checkpointLocation”, “dbfs://pathToYourCheckpoint”) \
    .foreachBatch(process_batch) \
    .outputMode("append") \
    .trigger(processingTime = “0 seconds”) \
    .start()

View on github

In addition, our Spark Structured Streaming job cluster assumes a special EC2 Instance Profile with the appropriate IAM policies to interact with AWS Sagemaker Feature Groups and put messages onto our prediction job SQS queue.

Ultimately, since each Structured Streaming job incorporates different business logic, we will need to implement different micro-batch processing functions that will be invoked once per micro-batch.

In our case, we’ve implemented a process_batch method that first computes/updates online features on AWS Sagemaker Feature Store, and then forwards user events to the job queue (Step 3):

from pyspark.sql.dataframe import DataFrame as SparkFrame

class RealTimeInferenceProcessor(Processor):

    def __init__(self):
        self.feature_store = initialize_feature_store()

    def process_batch(self, df: SparkFrame, epochID: str) -> None:
        """
        Concrete implementation of the stream query’s micro batch processing logic.

        Args:
            df (SparkFrame): The micro-batch Spark DataFrame to process.
            epochID (str): An identifier for the batch.
        """
        compute_online_features(df, self.feature_store)

        forward_micro_batch_to_job_queue(df)

View on github

The orchestration layer: decoupled event queues and Lambdas as feature transformers

Headspace users produce events that our real-time inference models consume downstream to make fresh recommendations. However, user event activity volume is not uniformly distributed. There are various peaks and valleys — our users are often most active during specific times of day.

The orchestration layer: decoupled event queues and Lambdas as feature transformers

Messages that are placed into the SQS prediction job queue are processed by AWS Lambda functions (Step 4 in diagram), which performs the following steps:

  • Unpack the message and fetch the corresponding online and offline features for the user whom we want to make a recommendation for (Step 5 in diagram). For instance, we may augment the event’s temporal/session-based features with attributes such as the user tenure level, gender and locale.
  • Perform any final pre-processing business logic. One example is the mapping of Headspace user IDs to user sequence IDs usable by collaborative filtering models.
  • Select the appropriate served Sagemaker model and invoke it with the input features (Step 6 in diagram).
  • Forward along the recommendation to its downstream destination (Step 7 in diagram). The actual location depends on whether we want users to pull down content recommendations or push recommendations out to users:

Pull: This method involves persisting the final recommended content to our internal Prediction Service, which is responsible for ultimately supplying users with their updated personalized content for many of the Headspace app’s tabs upon client app request. Below is an example experiment using real-time inference infrastructure that allows users to fetch personalized recommendations from the app’s Today tab:

Examples Headspace in-app modal push recommendations triggered from a user recent search for sleep content

Push: This method involves placing the recommendation onto another SQS queue for push notifications or in-app modal content recommendations. See the images below for examples of (above) in-app modal push recommendations triggered from a user recent search for sleep content and (below) iOS push notification from a recent user content completion:

Example Headspace in-app modal push recommendations triggered from a user recent search for sleep content

Within minutes of completing a specific meditation or performing a search, these push notifications can serve a relevant next piece of content while the context is still top of mind for the user.

In addition, utilizing this event queue allows prediction job requests to be retried — a small visibility timeout window (10-15 seconds) for the SQS queue can be set so that if a prediction job is not completed within that time window, another Lambda function is invoked to retry.

Summary

From an infrastructure and architecture perspective, a key learning is prioritizing designing flexible hand-off points between different services — in our case, the Publishing, Receiver, Orchestrator, and Serving layers. For instance,

  • What format should the message payload that our Structured Stream jobs send to the prediction SQS queue use?
  • What is in the model signature and HTTP POST payload that each Sagemaker model expects?
  • How do we synchronize the model image and the online feature stores so that we can safely and reliably update retrained models once in production?

Proactively addressing these questions will help decouple the various components of a complex ML architecture into smaller, modular sets of infrastructure.

The Headspace ML team is still rolling out production use cases for this infrastructure, but initial A/B tests and experiments have seen strong lifts in content start rates, content completion rates and direct/total push open rates relative to both other Headspace initiatives and industry benchmarks.

By leveraging models capable of real-time inference, Headspace significantly reduces the end-to-end lead time between user actions and personalized content recommendations. Events stream — recent searches, content starts/exits/pauses, in-app navigation actions, even biometric data — within the current session can all be leveraged to constantly update the recommendations we serve to users while they are still interacting with the Headspace application.

To learn more about Databricks Machine Learning, listen to the Data+AI Summit 2021 keynotes for excellent overviews, and find more resources on the Databricks ML homepage.

Learn more about Headspace at www.headspace.com.

--

Try Databricks for free. Get started today.

The post Infrastructure Design for Real-time Machine Learning Inference appeared first on Databricks.
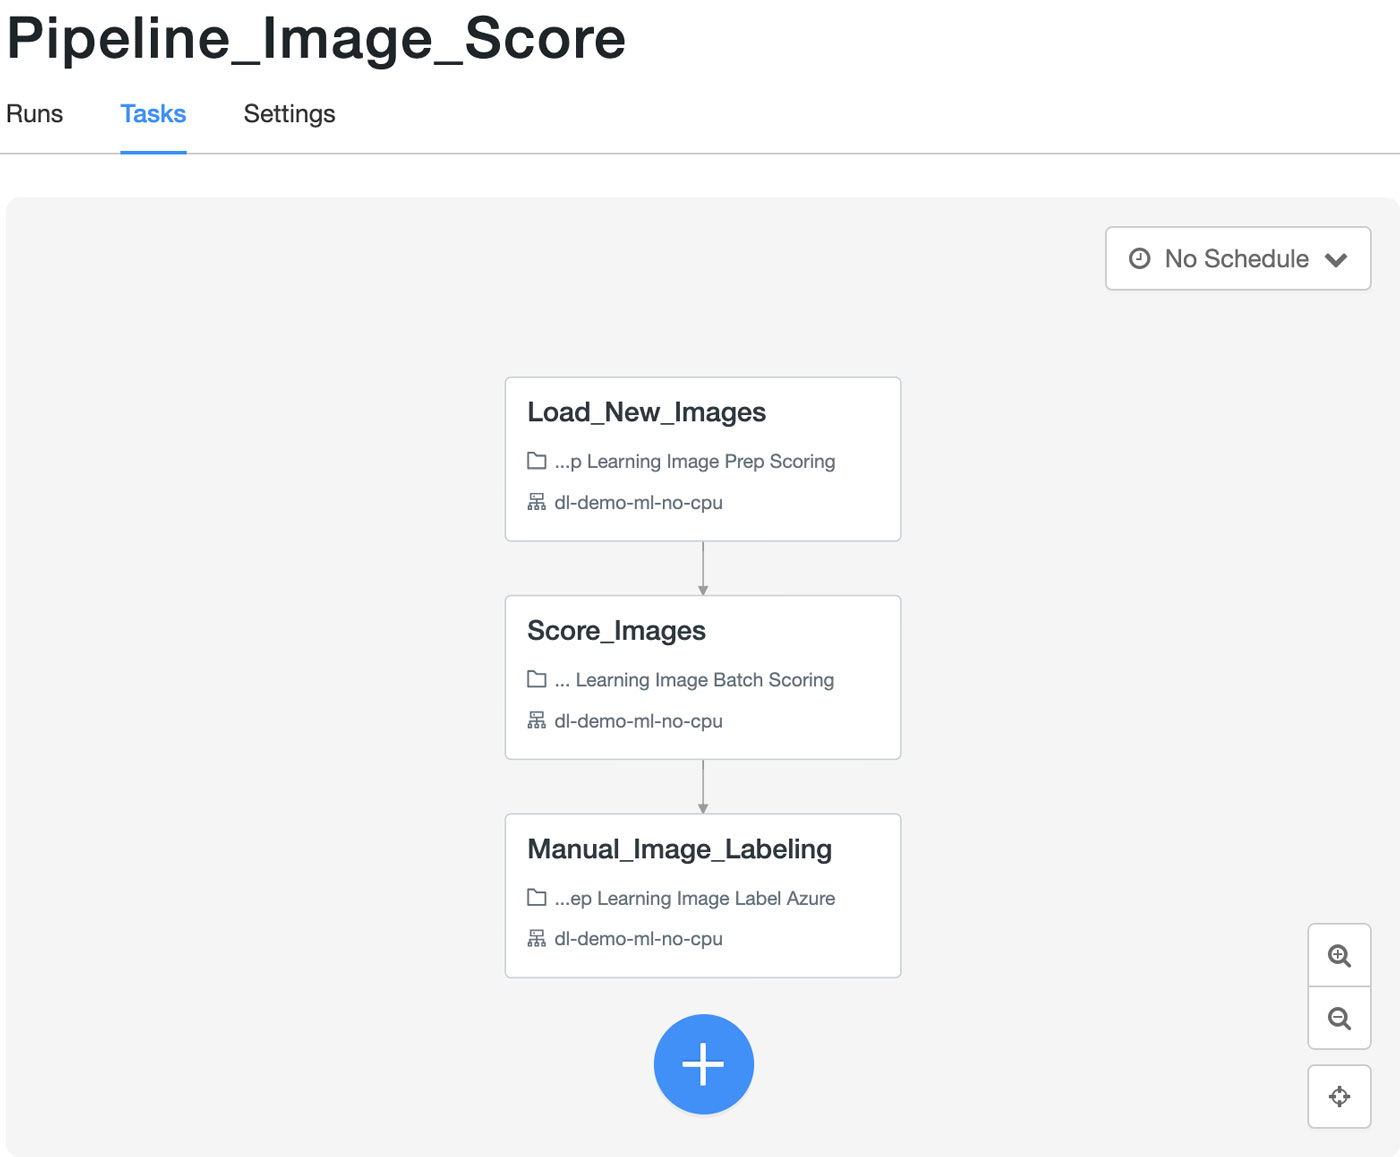
Announcing the Launch of Delta Live Tables on Google Cloud

$
0
0

Today, we are excited to announce the availability of Delta Live Tables (DLT) on Google Cloud. With this launch, enterprises can now use DLT to easily build and deploy SQL and Python pipelines and run ETL workloads directly on their lakehouse on Google Cloud.

In order to power analytics, data science and machine learning, data engineers need to turn raw data into fresh, high-quality, structured data. DLT provides Databricks customers a first-class experience that simplifies this data transformation on Delta Lake on top of Google Cloud Storage. DLT helps teams do ETL development and management with declarative pipeline building, improved data reliability and cloud-scale production operations that help build the lakehouse foundation.

This launch further strengthens the partnership between Databricks and Google Cloud, bringing together the powerful Databricks Lakehouse capabilities customers love with the data analytics solutions and global scale available from Google Cloud.

What Delta Live Tables brings to Google Cloud:

  1. Easy pipeline development and management – use declarative tools to build and manage data pipelines – in both batch and streaming.
  2. Built-in data quality – prevent bad data from flowing into pipelines and avoid and address data quality errors with predefined policies and data quality monitoring.
  3. Simplified operations – Gain deep visibility into pipeline operations with tools to visually track operational stats and data lineage and automatic error handling.

Getting started

Delta Live Tables is currently in Gated Public Preview for Databricks on Google Cloud. Customers can request access to start developing DLT pipelines here. Visit our Demo Hub to see a demo of DLT or read the DLT documentation to learn more.

As this is a gated preview, we will onboard customers on a case-by-case basis to guarantee a smooth preview process. We have limited slots for preview and hope to include as many customers as possible. If we are unable to onboard you during the gated preview, we will reach out and update you when we are ready to roll out broadly.

Request access to Delta Live Tables

--

Try Databricks for free. Get started today.

The post Announcing the Launch of Delta Live Tables on Google Cloud appeared first on Databricks.
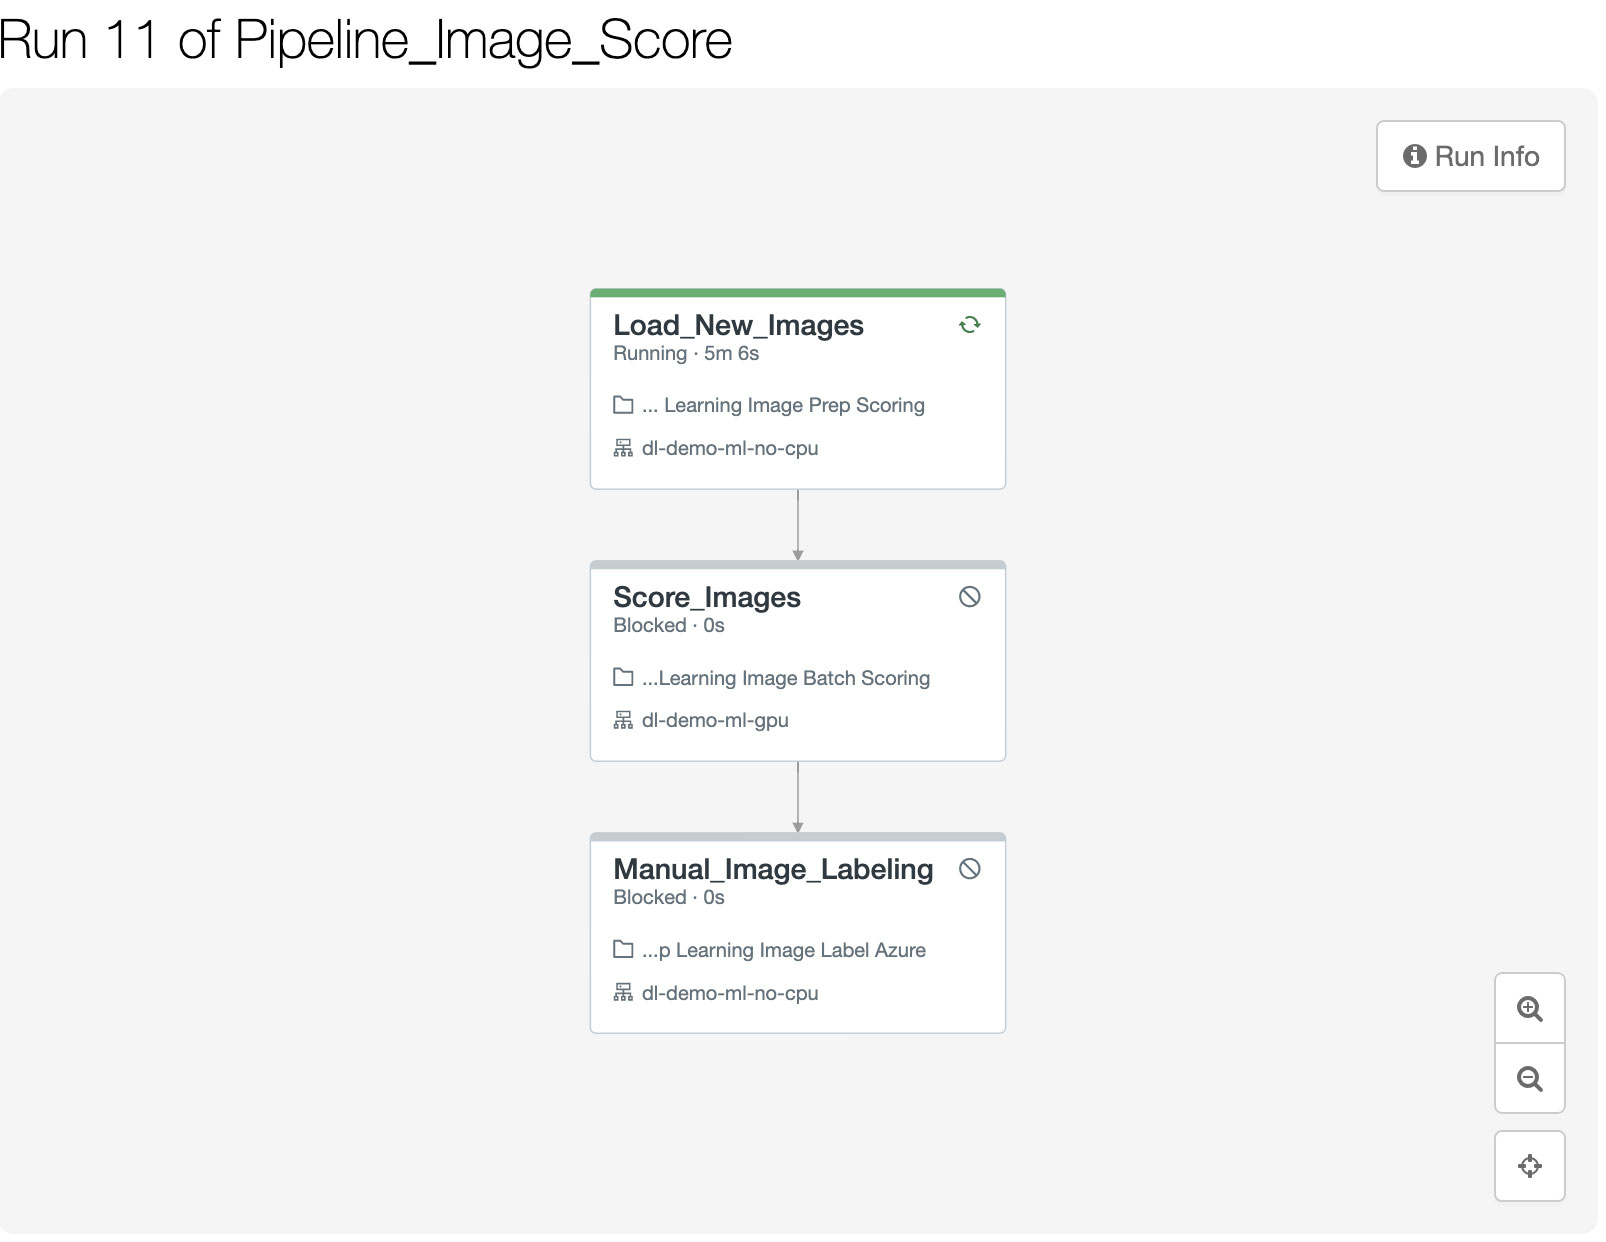
Implementing More Effective FAIR Scientific Data Management With a Lakehouse

$
0
0

Data powers scientific discovery and innovation. But data is only as good as its data management strategy, the key factor in ensuring data quality, accessibility, and reproducibility of results – all requirements of reliable scientific evidence.

As large datasets have become more and more important and accessible to scientists across disciplines, the problems of big data in the past decade — unruly, untamed, uncontrolled, and unreproducible data workflows — have become increasingly relevant to scientific organizations.

This led to industry experts to develop a framework for “good data management and stewardship,” initially introduced in a 2016 article in  Nature,  with “long-term care of valuable digital assets” at the core of it. These principles, now widely known as FAIR, consist of four main tenets: Findability, Accessibility, Interoperability, and Reuse of digital assets. Through its framework, FAIR helps to address these issues by emphasizing machine-actionability and the capacity of computational systems to find, access, interoperate and reuse data with no or minimal human intervention.

Nearly every scientific workflow — from performing detailed data quality controls to advanced analytics —  relies on de-novo statistical methods to tackle a particular problem. Therefore any data architecture designed to address good data governance should also have support for the development and application of advanced analytics tools on the data. These characteristics are inherently limited in legacy two-tier data architectures and don’t support modern data and advanced analytics use cases. That’s where a lakehouse architecture can help.

Over the past few years, the lakehouse paradigm, which unifies the benefits of data warehouses and data lakes into a new data platform architecture, has become increasingly prevalent across industries. As the next generation of enterprise-scale data architectures emerges, the lakehouse has proven to be a versatile structure that can support traditional analytics and machine learning use cases. Key to much of this versatility is Delta Lake, an open-source data management layer for your data lake, that provides warehouse-style consistency and transactionality with the scale, flexibility, and cost savings of a data lake.

In this post, we’ll take a closer look at how a lakehouse built on top of Delta Lake enables a FAIR data system architecture within organizations pursuing scientific research.

How to Create an R&D Lakehouse Based on Fair Data Principles


While their value is apparent, objectives like these have given data teams fits for years. Take, for example, the data lake; no part of a system is more accessible than a data lake, but while it has brought great promise to the world of data organization, it has simultaneously created great disarray. The cloud, for all of its benefits, has made this challenge even more difficult: plummeting storage costs and everywhere-all-the-time data access equals data proliferation. With all the pressures of this growth, lofty stewardship principles such as FAIR often get deprioritized.

Inevitably, the downsides of an uncontrolled cloud rear their heads – cost explodes, utilization plummets and risk becomes untenable due to lack of governance. This rings especially true in the scientific world, where uncertainty and change are present in every cell, subject, and trial. So why introduce more unknowns with a new data platform, when a laptop works perfectly fine? In this light, data disorganization is the enemy of innovation, and FAIR aims to make an organization a reproducible process. So, to the real question: “How do I put FAIR into practice?”

Fortunately, recent developments in cloud architecture make this question easier to answer than ever before. Specifically, let’s take a look at how a lakehouse built on top of Delta Lake addresses each of the FAIR guiding principles.

how a lakehouse built on top of Delta Lake addresses each of the core FAIR guiding principles


Findability: How do users find data in an automated, repeatable way?

Data findability is the first hurdle of any experiment, pipeline or process. It is also one of the main victims of data proliferation. With petabytes of data smattered across dozens of disconnected systems, how can even the savviest users (let alone the poor souls uninitiated to the company’s tribal knowledge) possibly navigate the data landscape? Bringing disparate data from multiple systems into a single location is a core principle of the data lake. The lakehouse expands this concept even further by building the other principles of FAIR on top, but the core idea stays the same: when done right, unifying data in a single layer makes every other architecture decision easier.

The FAIR standards for Findability are broken down into several sub-objectives:

  • F1: (Meta) data is assigned globally unique and persistent identifiers.
  • F2: Data is described with rich metadata.
  • F3: Metadata clearly and explicitly includes the identifier of the data they describe.
  • F4: (Meta)data is registered or indexed in a searchable resource.

Each of these points lines up with a Delta-based lakehouse. For example, with Delta Lake, metadata includes the standard information, such as schema, as well as versioning, schema evolution over time and user-based lineage. There is also never any ambiguity about which data any given metadata describes, since data and metadata are co-located, and as a best practice, the lakehouse includes a central, high-accessible metastore to provide easy searchability. All of these result in highly-findable data in the lakehouse paradigm.

As one example of how the lakehouse enables data findability, consider the following:

Example of how the lakehouse enables data findability.


Here, we have ingestion from many systems — imaging systems, on-prem and cloud data warehouses, Electronic Health Record (EHR) systems, etc. Regardless of the source, they are deposited into a “bronze” layer within the underlying data lake, and then automatically fed through refinement processes that might include de-identification, normalization and filtering. Finally, data is deposited into a “gold” layer, which includes only high-quality data; users (or automated feeds) need only look in one place to find the latest version of usable data. Even data science or ML processes that might require less-refined data can leverage the silver or bronze layers; these processes know where the data resides and what each layer contains. As we’ll see, this makes every other principle of FAIR easier to implement and track.

Accessibility: How do users access the data once it has been found?

According to the FAIR principles, accessible data is “retrievable… using a standardised communications protocol” and “accessible even when the data are no longer available.” Traditionally, this is where the data lake model would begin to break down; almost by definition, a data lake has an arbitrary number of schemas, file types and formats and versions of data. While this makes findability simple, it makes for an accessibility nightmare; even more, what is in the lake one day may either change, move or completely disappear the next. This was one of the primary failings of the data lake — and where the lakehouse begins to diverge.

A well-architected lakehouse requires a layer to facilitate accessibility in between the underlying data lake and consumers; there are several tools that provide such a layer today, but the most widely used is Delta Lake. Delta brings a huge number of benefits (ACID transactions, unified batch/streaming, cloud-optimized performance, etc.), but two are of particular importance in relation to FAIR. First, Delta Lake is an open-source format governed by the Linux Foundation, meaning that it is a standardized, nonproprietary and inherently multi-cloud protocol. Regardless of which vendor(s) is used, data that is written in Delta will always be openly accessible. Second, Delta provides a transaction log that is distinct from the data itself; this log allows actions such as versioning, which are essential to reproducibility, and also means that even if the data itself is deleted, the metadata (and in many cases, with appropriate versioning, even the data) can be recovered. This is an essential piece of the accessibility tenet of FAIR — if stability over time cannot be guaranteed, data may as well not exist to begin with.

As an example of how Delta Lake enables accessibility, consider the following scenario in which we begin with a table of patient information, add some new data and then accidentally make some unintentional changes.

An example of how Delta Lake enables accessibility, by ensuring data stability, even if data is inadvertently changed or deleted.

Because Delta persists our metadata and keeps a log of changes, we are able to access our previous state even for data deleted accidentally — this applies even if the whole table is deleted! This is a simple example but should give a flavor of how a lakehouse built on top of Delta Lake can bring stability and accessibility to your data. This is especially valuable in any organization in which reproducibility is imperative. Delta Lake can lighten the load on data teams while allowing scientists to freely innovate and explore.

And finally, Delta Lake provides Delta Sharing, an open protocol for secure data sharing. This makes it simple for scientific researchers to share research data directly with other researchers and organizations, regardless of which computing platforms they use, in an easy-to-manage and open format.

Interoperability: How are data systems integrated? 

There is no shortage of data formats today. Once the familiar formats of CSV and Excel spreadsheets provided all the functionality we could ever need, but today there are thousands of domain-specific healthcare formats, from BAM and SAM to HL7. This is, of course, before we even get to unstructured data such as DICOM images, big data standards like Apache Parquet, and the truly limitless number of vendor-specific proprietary formats. Throw all of this together in a data lake, and you’ve created a truly frightening cocktail of data. An effective interoperable system, and one that meets the FAIR principles, must be machine-readable in every format that it is fed — a feat that is difficult at best, and impossible at worst, when it comes to the huge variety of data formats used in HLS.

In the lakehouse paradigm, we tackle this issue using Delta Lake. We first land the data in its raw format, keeping an as-is copy for historical and data-mining purposes; we then transform all data to the Delta format, meaning that downstream systems need only understand a single format in order to function.

The lakehouse solves the FAIR principle of being machine-readable by transforming all data to the Delta Lake format.

Additionally, the lakehouse promotes a single, centralized metadata catalog; this means that no matter where or how the original and transformed data is stored, there is one point of reference to access and use it. Furthermore, this means that there is a single point of control for sensitive PHI or HIPAA-compliant data, enhancing the governance and control of data flow.

One common question is how to actually convert all of these disparate formats; after all, although downstream systems must only understand Delta, something in the lakehouse must understand the upstream data. At Databricks, we’ve worked with industry experts and partners to create solutions that handle some of the most commonly encountered formats. A few examples of these in healthcare and life sciences include:

  • GLOW, a joint collaboration between Databricks and Regeneron Genetic Center, that makes ingestion and processing of common genomics formats scalable and easy, and is designed to make it easy to integrate genomics workflows within a broader data and AI ecosystem.
  • SMOLDER is a scalable, Spark-based framework for ingestion and processing of HL7 data; it provides an easy-to-use interface for what is often a difficult and mutable format. It provides native readers and plugins so that consuming HL7 data is just as easy as consuming a CSV file.

Reusability: How can data be reused across multiple scenarios?

Reusability is a fickle subject; even companies who are already building on a lakehouse architecture are prone to missing out on this pillar. This is mostly because reusability is more than a technical problem — it cuts to the core of the business, and forces us to ask hard questions. Is the business siloed? Is there a strong culture of cross-functional collaboration and teamwork? Do the leaders of R&D know how data is being used in manufacturing, and vice versa? A strong lakehouse cannot answer these questions or fix the structural issues that may underlie them, but it can provide a strong foundation to build upon.

Much of the value of the lakehouse is derived not from the ability to ingest, store, version or clean data — rather, it comes from the ability to provide a single, centralized platform where all data, regardless of use case, can be processed, accessed and understood. The underlying pieces — the data lake, Delta Lake, Delta Engine and catalog — all serve to enable these use cases. Without strong use cases, no data platform, no matter how well-architected, will bring value.

We can’t possibly cover every data use case here, but hopefully this blog has given a brief overview of how Databricks enables more effective scientific data management and community standards. As a primer to some solutions we’ve seen on the lakehouse, here are some resources:

Learn how Biogen is using the Databricks Lakehouse Platform to advance the development of novel disease therapies

Every business will be unique in this aspect, but at Databricks, we have seen a wide range of use cases in healthcare and life sciences customers, from healthcare and hospital systems to pharmaceutical companies to device manufacturers.

--

Try Databricks for free. Get started today.

The post Implementing More Effective FAIR Scientific Data Management With a Lakehouse appeared first on Databricks.
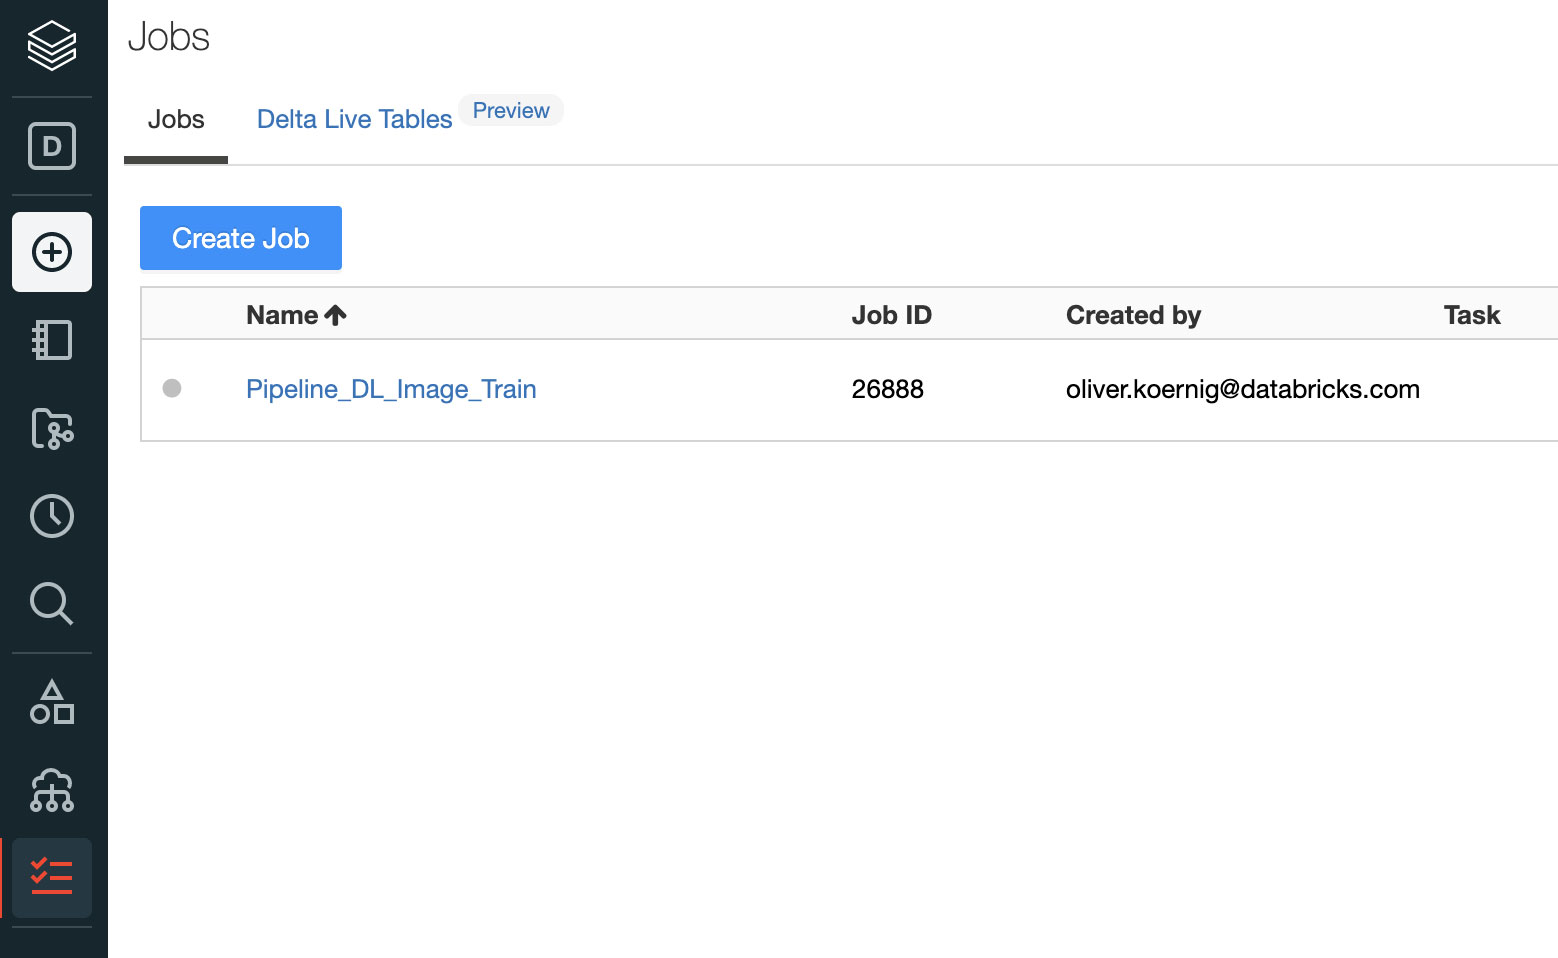
New Performance Improvements in Databricks SQL

$
0
0

Originally announced at Data + AI Summit 2020 Europe, Databricks SQL lets you operate a multi-cloud lakehouse architecture that provides data warehousing performance at data lake economics. Our vision is to give data analysts a simple yet delightful tool for obtaining and sharing insights from their lakehouse using a purpose-built SQL UI and world-class support for popular BI tools.

This blog is the first of a series on Databricks SQL that aims at covering the innovations we constantly bring to achieve this vision: performance, ease of use and governance. This blog will cover recent performance optimizations as part of Databricks SQL for:

  • Highly concurrent analytics workloads
  • Intelligent workload management
  • Highly parallel reads
  • Improving business intelligence (BI) results retrieval with Cloud Fetch

Real-life performance beyond large queries

The initial release of Databricks SQL started off with significant performance benefits — up to 6x price/performance — compared to traditional cloud data warehouses as per the TPC-DS 30 TB scale benchmark below. Considering that the TPC-DS is an industry standard benchmark defined by data warehousing vendors, we are really proud of these results.

The initial release of Databricks SQL offered significant performance benefits -- up to 6x price/performance -- compared to traditional cloud data warehouses as per the TPC-DS 30 TB scale benchmark

30TB TPC-DS Price/Performance (Lower is better)

While this benchmark simulates large queries such as ETL workloads or deep analytical workloads well, it does not cover everything our customers run. That’s why we’ve worked closely with hundreds of customers in recent months to provide fast and predictable performance for real-life data analysis workloads and SQL data queries.

As we officially ungate the preview today, we are very excited to share some of the results and performance gains we’ve achieved to date.

Scenario 1: Highly concurrent analytics workloads

In working with customers, we noticed that it is common for highly concurrent analytics workloads to execute over small datasets. Intuitively, this makes sense – analysts usually apply filters and tend to work with recent data more than historical data. We decided to make this common use-case faster. To optimize concurrency, we used the same TPC-DS benchmark with a much smaller scale factor (10GB) and 32 concurrent streams. So, we have 32 bots submitting queries continuously to the system, which actually simulates a much larger number of real users because bots don’t rest between running queries.

We analyzed the results to identify and remove bottlenecks, and repeated this process multiple times. Hundreds of optimizations later, we improved concurrency by 3X! Databricks SQL now outperforms some of the best cloud data warehouses for both large queries and small queries with lots of users.

Databricks SQL outperforms some of the best cloud data warehouses, not only for large queries, but small queries with lots of users.

10 GB TPC-DS Queries/Hr at 32 Concurrent Streams (Higher is better)

Scenario 2: Intelligent workload management

Real-world workloads, however, are not just about either large or small queries. They typically include a mix of small and large queries. Therefore the queuing and load balancing capabilities of Databricks SQL need to account for that too. That’s why Databricks SQL uses a dual queuing system that prioritizes small queries over large, as analysts typically care more about the latency of short queries versus large.

Databricks SQL uses a dual queuing system that prioritizes small queries over large, as analysts typically care more about the latency of short queries versus large.

Queuing and load balancing mixed queries with dual queues

Scenario 3: Highly parallel reads

It is common for some tables in a lakehouse to be composed of many files e.g. in streaming scenarios such as IoT ingest when data arrives continuously. In legacy systems, the execution engine can spend far more time listing these files than actually executing the query! Our customers also told us they do not want to sacrifice performance for data freshness.

We are proud to announce the inclusion of async and highly parallel IO in Databricks SQL. When you execute a query, Databricks automatically reads the next blocks of data from cloud storage while the current block is being processed. This considerably increases overall query performance on small files (by 12x for 1MB files) and “cold data” (data that is not cached) use cases as well.

Databricks designed a new scan technique that can automatically read the next blocks of data while the current block is being processed, considerably increasing overall query performance on small files.

Highly parallel reads scenario benchmark on small files(# rows scanned/sec) (Higher is better)

Scenario 4: Improving BI results retrieval with Cloud Fetch

Once query results are computed, the last mile is to speed up how the system delivers results to the client – typically a BI tool like PowerBI or Tableau. Legacy cloud data warehouses often collect the results on a leader (aka driver) node, and stream it back to the client. This greatly slows down the experience in your BI tool if you are fetching anything more than a few megabytes of results.

That’s why we’ve reimagined this approach with a new architecture called Cloud Fetch. For large results, Databricks SQL writes results in parallel across all of the compute nodes to cloud storage, and then sends the list of files using pre-signed URLs back to the client. The client then can download in parallel all the data from cloud storage. We are delighted to report up to 10x performance improvement in real-world customer scenarios! We are working with the most popular BI tools to enable this capability automatically.

For large results, the underlying cluster now writes in parallel across all of the compute nodes to cloud storage, and then sends the list of files using pre-signed URLs back to the client.

“Cloud Fetch enables faster, higher bandwidth connectivity

Unpacking Databricks SQL

These are just a few examples of performance optimizations and innovations brought to Databricks SQL to provide you with best-in-class SQL performance on your data lake, while retaining the benefits of an open approach. So how does this work?

Databricks SQL Under the Hood (marchitecture)

Databricks SQL Under the Hood

Open source Delta Lake is the foundation for Databricks SQL. It is the open data storage format that brings the best of data warehouse systems to data lakes, with ACID transactions, data lineage, versioning, data sharing and so on, to structured, unstructured and semi-structured data alike.

At the core of Databricks SQL is Photon, a new native vectorized engine on Databricks written to run SQL workloads faster. Read our blog and watch Radical Speed for SQL Queries on Databricks: Photon Under the Hood to learn more.

And last but not least, we have worked very closely with a large number of software vendors to make sure that data teams — analysts, data scientists and SQL developers– can easily use their tools of choice on Databricks SQL. We made it easy to connect, get data in and authenticate using single-sign-on while boosting speed thanks to the concurrency and short query performance improvements we covered before.

Next steps

This is just the start, as we plan to continuously listen and add more innovations to the service. Databricks SQL is already bringing a tremendous amount of value to many organizations like Atlassian or Comcast, and we can’t wait to hear your feedback as well!

If you’re an existing Databricks user, you can start using Databricks SQL today using our Get Started guide for Azure Databricks or AWS. If you’re not yet a Databricks user, visit databricks.com/try to start a free trial.

Finally, if you’d like to learn more about Databricks Lakehouse platform, watch our webinar – Data Management, the good, the bad, the ugly. In addition, we are offering Databricks SQL online training for hands-on experience, and personalized workshops. Contact your sales representative to learn more. We’d love to hear how you use Databricks SQL and how we can make BI and data analytics on your data lake even simpler.

Watch DAIS Keynote and Demo Below

--

Try Databricks for free. Get started today.

The post New Performance Improvements in Databricks SQL appeared first on Databricks.

Introducing the Databricks Community: Online Discussions for Data + AI Practitioners

$
0
0

At Databricks, we know that impactful data transformation in any organization starts with empowered individuals. This is why we are excited to launch the Databricks Community to serve as an engaging online meeting place and discussion forum for data practitioners, partners and Databricks employees to get reliable answers relating to data and AI from experts and peers, share learnings and thrive, together.
 
Join the Databricks community
 
Our customers are using data to create life-saving drugs, combat mental illness, change global transportation, protect personal finances and so much more. Behind these incredible results are passionate, dedicated, experienced data practitioners changing the world one data set, one query and one visualization at a time.

What if there were more passionate, dedicated, experienced data practitioners?

Through the Databricks Community, we strive to bring technical knowledge and hard-earned experience learnings quickly to data-curious minds and foster a community that recognizes and uplifts members. Our goal is to expedite the advancement of passionate and dedicated data practitioners, so they can make that next big breakthrough.

The Databricks Community will replace Databricks Forums, which attracted 50K+ members. The new community will offer one, simple destination for members to:

  • Find answers quickly: Federated search runs across our key Databricks user resources, including Community posts, Documentation articles, Knowledge Base articles and, soon, Databricks Academy courses. Whether you are looking for an overview or best practices for Apache Spark (™), Delta Lake, MLflow, Redash, now you have a one-stop shop for access.
  • Access experts at scale: With participation from savvy data practitioners and Databricks employees and partners, members posting questions will get guidance from trusted sources
  • Stay on top of Databricks updates: Certified Posts from Community moderators will make it easier than ever to get the latest Databricks product news and user enablement resource material.
  • Network with peers and experts: Featuring Topics to relate similar discussions and Groups to bring people of similar passions together, members will build relationships with peers and experts from around the globe.
  • Have fun and earn recognition: With points that ladder up to badges, active members will raise through the ranks, be recognized by peers and industry leaders and receive special permissions on Community as well as access to Databricks SMEs and exclusive experiences.

Getting started is easy, and everyone’s invited!

Join the Databricks Community today by going to https://community.databricks.com. Create an account to post or answer a question, Like a question or answer, share some learnings via a post, join a Group and more. If you are Databricks on AWS user, you can simply use your workspace credential to log in without setting up another account.

Databricks Community is now officially open for you, and we can’t wait to see you there.

--

Try Databricks for free. Get started today.

The post Introducing the Databricks Community: Online Discussions for Data + AI Practitioners appeared first on Databricks.

5 Steps to Implementing Intelligent Data Pipelines With Delta Live Tables

$
0
0

Many IT organizations are familiar with the traditional extract, transform and load (ETL) process – as a series of steps defined to move and transform data from source to traditional data warehouses and data marts for reporting purposes. However, as organizations morph to become more and more data-driven, the vast and various amounts of data, such as interaction, IoT and mobile data, have changed the enterprise data landscape. By adopting the lakehouse architecture, IT organizations now have a mechanism to manage, govern and secure any data, at any latency, as well as process data at scale as it arrives in real-time or batch for analytics and machine learning.

Challenges with traditional ETL

Conceptually, it sounds easy to build ETL pipelines — something data engineers have been executing for many years in traditional data warehouse implementations. However, with today’s modern data requirements, data engineers are now responsible for developing and operationalizing ETL pipelines as well as maintaining the end-to-end ETL lifecycle. They’re responsible for the tedious and manual tasks of ensuring all maintenance aspects of data pipelines: testing, error handling, recovery and reprocessing. This highlights several challenges data engineering teams face to deliver trustworthy, reliable data for consumption use cases:

  1. Complex pipeline development: Data engineers spend most of their time defining and writing code to manage the ETL lifecycle that handles table dependencies, recovery, backfilling, retries or error conditions and less time applying the business logic. This turns what could be a simple ETL process into a complex data pipeline implementation.
  2. Lack of data quality: Today, data is a strategic corporate asset essential for data-driven decisions – but just delivering data isn’t a determinant for success. The ETL process should ensure data quality for business requirements are met. Many data engineers are stretched thin and forced to focus on delivering data for analytics or machine learning without addressing the sources of untrustworthy data, which in turn leads to incorrect insights, skewed analysis and inconsistent recommendations.
  3. End-to-End data pipeline testing:  Data engineers need to account for data transformation testing within the data pipeline. End-to-end ETL testing must handle all valid assumptions and permutations of incoming data. With the application of data transformation testing, data pipelines are guaranteed to run smoothly, confirm the code is working correctly for all variations of source data and prevent regressions when code changes.
  4. Multi-latency data processing: The speed at which data is generated makes it challenging for data engineers to decide whether to implement a batch or a continuous streaming data pipeline. Depending on the incoming data and business needs, data engineers need the flexibility of changing the latency without having to re-write the data pipeline.
  5. Data pipeline operations: As data grows in scale and complexity and the business logic changes, new versions of the data pipeline must be deployed. Data teams spend cycles setting up data processing infrastructure, manually coding to scale, as well as restarting, patching, and updating the infrastructure. All of this translates to increased time and cost. When data processing fails, data engineers spend time manually traversing through logs to understand the failures, clean up data and determine the restart point. These manual and time-consuming activities become expensive, incurring development costs to restart or upgrade the data pipeline, further delaying SLAs for downstream data consumption.

A modern approach to automated intelligent ETL

Data engineering teams need to rethink the ETL lifecycle to handle the above challenges, gain efficiencies and reliably deliver high-quality data in a timely manner. Therefore, a modernized approach to automated, intelligent ETL is critical for fast-moving data requirements.

To automate intelligent ETL, data engineers can leverage Delta Live Tables (DLT). A new cloud-native managed service in the Databricks Lakehouse Platform that provides a reliable ETL framework to develop, test and operationalize data pipelines at scale.

Benefits of Delta Live Tables for automated intelligent ETL

By simplifying and modernizing the approach to building ETL pipelines, Delta Live Tables enables:

  • Declarative ETL pipelines: Instead of low-level hand-coding of ETL logic, data engineers can leverage SQL or Python to build declarative pipelines – easily defining ‘what’ to do, not ‘how’ to do it.  With DLT, they specify how to transform and apply business logic, while DLT automatically manages all the dependencies within the pipeline. This ensures all tables are populated correctly, continuously or on schedule. For example, updating one table will automatically trigger all downstream table updates.
  • Data quality: DLT validates data flowing through the pipeline with defined expectations to ensure its quality and conformance to business rules. DLT automatically tracks and reports on all the quality results.
  • Error handling and recovery: DLT can handle transient errors and recover from most common error conditions occurring during the operation of a pipeline.
  • Continuous, always-on processing: DLT allows users to set the latency of data updates to the target tables without having to know complex stream processing and implementing recovery logic.
  • Pipeline visibility: DLT monitors overall pipeline estate status from a dataflow graph dashboard and visually tracks end-to-end pipeline health for performance, quality, status, latency and more. This allows you to track data trends across runs to understand performance bottlenecks and pipeline behaviors.
  • Simple deployments: DLT enables you to deploy pipelines into production or rollback pipelines with a single click and minimizes downtime so you can adopt continuous integration/continuous deployment processes.

How data engineers can implement intelligent data pipelines in 5 steps 

To achieve automated, intelligent ETL, let’s examine five steps data engineers need to implement data pipelines using DLT successfully.

Step 1. Automate data ingestion into the Lakehouse

The most significant challenge data engineers face is efficiently moving various data types such as structured, unstructured or semi-structured data into the lakehouse on time. With Databricks, they can use Auto Loader to efficiently move data in batch or streaming modes into the lakehouse at low cost and latency without additional configuration, such as triggers or manual scheduling.

Auto Loader leverages a simple syntax, called cloudFiles, which automatically detects and incrementally processes new files as they arrive.

To use Databricks Auto Loader, the data engineer uses a simple syntax, called cloudFiles, which will automatically detect and incrementally process new files as they arrive.

Auto Loader automatically detects changes to the incoming data structure, meaning that there is no  need to manage the tracking and handling of schema changes. For example, when receiving data that periodically introduces new columns, data engineers using legacy ETL tools typically must stop their pipelines, update their code and then re-deploy. With Auto Loader, they can leverage schema evolution and process the workload with the updated schema.

Step 2: Transforming data within Lakehouse

As data is ingested into the lakehouse, data engineers need to apply data transformations or business logic to incoming data – turning raw data into structured data ready for analytics, data science or machine learning.

DLT provides the full power of SQL or Python to transform raw data before loading it into tables or views. Transforming data can include several steps such as joining data from several data sets, creating aggregates, sorting, deriving new columns, converting data formats or applying validation rules.

With Delta Live Tables, data engineers have the full power of SQL or Python to transform raw data before loading it into tables or views.

Step 3: Ensure data quality and integrity within Lakehouse

Data quality and integrity are essential in ensuring the overall consistency of the data within the lakehouse. With DLT, data engineers have the ability to define data quality and integrity controls within the data pipeline by declaratively specifying Delta Expectations, such as applying column value checks.

With Datbricks Delta Live Tables, data engineers can define data quality and integrity controls within the data pipeline by declaratively specifying Delta Expectations.

For example, a data engineer can create a constraint on an input date column, which is expected to be not null and within a certain date range. If this criterion is not met, then the row will be dropped. The syntax below shows two columns called pickup_datetime and dropoff_datetime are expected to be not null, and if dropoff_datetime is greater than pickup_datetime then drop the row.

Depending on the criticality of the data and validation, data engineers may want the pipeline to either drop the row, allow the row, or stop the pipeline from processing.

constraint valid_pickup_time expect (pickup_datetime is not null and dropoff_datetime is not null and (dropoff_datetime > pickup_datetime)) ON VIOLATION DROP ROW

All the data quality metrics are captured in the data pipeline event log, allowing data quality to be tracked and reported for the entire data pipeline. Using visualization tools, reports can be created to understand the quality of the data set and how many rows passed or failed the data quality checks.

Step 4: Automated ETL deployment and operationalization 

With today’s data requirements, there is a critical need to be agile and automate production deployments. Teams need better ways to automate ETL processes, templatize pipelines and abstract away low-level ETL hand-coding to meet growing business needs with the right data and without reinventing the wheel.

When a data pipeline is deployed, DLT creates a graph that understands the semantics and displays the tables and views defined by the pipeline. This graph creates a high-quality, high-fidelity lineage diagram that provides visibility into how data flows, which can be used for impact analysis. Additionally, DLT checks for errors, missing dependencies and syntax errors, and automatically links tables or views defined by the data pipeline.

Databricks Delta Live Tables checks for errors, missing dependencies, syntax errors, and automatically links tables or views defined by the data pipeline.

Once this validation is complete, DLT runs the data pipeline on a highly performant and scalable Apache Spark™ compatible compute engine – automating the creation of optimized clusters to execute the ETL workload at scale. DLT then creates or updates the tables or views defined in the ETL with the most recent data available.

As the workload runs, DLT captures all the details of pipeline execution in an event log table with the performance and status of the pipeline at a row level. Details, such as the number of records processed, throughput of the pipeline, environment settings and much more, are stored in the event log that can be queried by the data engineering team.

As the workload runs, Databricks Delta Live Tables captures all the details of pipeline execution in an event log table with the performance and status of the pipeline at a row level.

In the event of system failures, DLT automatically stops and starts the pipeline; there is no need to code for check-pointing or to manually manage data pipeline operations. DLT automatically manages all the complexity needed to restart, backfill, re-run the data pipeline from the beginning or deploy a new version of the pipeline.

When deploying a DLT pipeline from one environment to another, for example, from dev to test to production, users can parameterize the data pipeline. Using a config file, they can provide parameters specific to the deployment environment reusing the same pipeline and transformation logic.

How to build data pipelines with Delta Live Tables

Step 5: Scheduling data pipelines 

Finally, data engineers need to orchestrate ETL workloads. DLT pipelines can be scheduled with Databricks Jobs, enabling automated full support for running end-to-end production-ready pipelines. Databricks Jobs includes a scheduler that allows data engineers to specify a periodic schedule for their ETL workloads and set up notifications when the job ran successfully or ran into issues.

Delta Live Tables pipelines can be scheduled with Databricks Jobs, enabling automated full support for running end-to-end production-ready pipelines.

Final thoughts

As organizations strive to become data-driven, data engineering is a focal point for success. To deliver reliable, trustworthy data, data engineers shouldn’t need to spend time manually developing and maintaining an end-to-end ETL lifecycle.  Data engineering teams need an efficient, scalable way to simplify ETL development, improves data reliability and manages operations.

Delta Live Tables abstracts complexity for managing the ETL lifecycle by automating and maintaining all data dependencies, leveraging built-in quality controls with monitoring and providing deep visibility into pipeline operations with automatic recovery.  Data engineering teams can now focus on easily and rapidly building reliable end-to-end production-ready data pipelines using only SQL or Python for batch and streaming that delivers high-value data for analytics, data science or machine learning.

Next steps

Check out some of our resources and, when you’re ready, use the below link to request access to DLT service.

--

Try Databricks for free. Get started today.

The post 5 Steps to Implementing Intelligent Data Pipelines With Delta Live Tables appeared first on Databricks.

Announcing Public Preview of Low Shuffle Merge

$
0
0

Today, we are excited to announce the public preview of Low Shuffle Merge in Delta Lake, available on AWS, Azure, and Google Cloud.

This new and improved MERGE algorithm is substantially faster and provides huge cost savings for our customers, especially with common use cases like updating a small number of rows in a given file. And, together with Photon, the next generation query engine, Low Shuffle Merge will give customers unmatched performance gains, speeding up MERGE operations for better performance and lower compute costs. Additionally, Low Shuffle Merge now maintains existing data clustering to provide better performance out-of-the-box and reduce the need to run Z-order optimization on the data often.

Low Shuffle Merge provides better performance by processing unmodified rows in a separate, more streamlined processing mode, instead of processing them together with the modified rows. As a result, the amount of shuffled data is reduced significantly, leading to improved performance. Low Shuffle Merge also removes the need for users to re-run the OPTIMIZE ZORDER BY command after performing a MERGE operation. For the data that has already been sorted (using OPTIMIZE Z-ORDER BY), Low Shuffle Merge maintains that sorting for all records that are not being modified by

Getting started

Enabling Low Shuffle Merge is free and easy to do. Upgrade your cluster to Databricks Runtime 9.0 and set the following spark configuration:

SET spark.databricks.delta.merge.enableLowShuffle = true;

You can upgrade to the latest Databricks runtime release via the Clusters page in the Databricks UI (learn more). You can set then enable Low Shuffle Merge by setting the above configuration before running MERGE INTO commands in the notebook, or at the cluster level to be applied automatically to all MERGE commands. When the feature is released as Generally Available later this year, it will be automatically turned on by default after upgrading to the latest DBR release.

We strongly recommend using Photon with Low Shuffle Merge to get even faster performance and more cost savings. Learn more about Photon in this blog.

--

Try Databricks for free. Get started today.

The post Announcing Public Preview of Low Shuffle Merge appeared first on Databricks.


Real-time Point-of-Sale Analytics With a Data Lakehouse

$
0
0

Disruptions in the supply chain – from reduced product supply and diminished warehouse capacity – coupled with rapidly shifting consumer expectations for seamless omnichannel experiences are driving retailers to rethink how they use data to manage their operations. Prior to the pandemic, 71% of retailers named lack of real-time visibility into inventory as a top obstacle to achieving their omnichannel goals. The pandemic only increased demand for integrated online and in-store experiences, placing even more pressure on retailers to present accurate product availability and manage order changes on the fly. Better access to real-time information is the key to meeting consumer demands in the new normal.

In this blog, we’ll address the need for real-time data in retail, and how to overcome the challenges of moving real-time streaming of point-of-sale data at scale with a data lakehouse.

The point-of-sale system

The point-of-sale (POS) system has long been the central piece of in-store infrastructure, recording the exchange of goods and services between retailer and customer. To sustain this exchange, the POS typically tracks product inventories and facilitates replenishment as unit counts dip below critical levels. The importance of the POS to in-store operations cannot be overstated, and as the system of record for sales and inventory operations, access to its data is of key interest to business analysts.

Historically, limited connectivity between individual stores and corporate offices meant the POS system (not just its terminal interfaces) physically resided within the store. During off-peak hours, these systems might phone home to transmit summary data, which when consolidated in a data warehouse, provide a day-old view of retail operations performance that grows increasingly stale until the start of the next night’s cycle.

Inventory availability with traditional, batch-oriented ETL patterns

Figure 1. Inventory availability with traditional, batch-oriented ETL patterns

Modern connectivity improvements have enabled more retailers to move to a centralized, cloud-based POS system, while many others are developing near real-time integrations between in-store systems and the corporate backoffice. Near real-time availability of information means that retailers can continuously update their estimates of item availability. No longer is the business managing operations against their knowledge of inventory states as they were a day prior but instead is taking actions based on their knowledge of inventory states as they are now.

 Inventory availability with streaming ETL patterns

Figure 2. Inventory availability with streaming ETL patterns

Near real-time insights

As impactful as near real-time insights into store activity are, the transition from nightly processes to continuous streaming of information brings particular challenges, not only for the data engineer who must design a different kind of data processing workflow, but also for the information consumer. In this post, we share some lessons learned from customers who’ve recently embarked on this journey and examine how key patterns and capabilities available through the lakehouse pattern can enable success.

Lesson 1: Carefully consider scope

POS systems are not often limited to just sales and inventory management. Instead, they can provide a sprawling range of functionality from payment processing, store credit management, billing and order placement, loyalty program management, employee scheduling, time-tracking and even payroll, making them a veritable Swiss Army knife of in-store functionality.

As a result, the data housed within the POS is typically spread across a large and complex database structure. If lucky, the POS solution makes a data access layer available, which makes this data accessible through more easily interpreted structures. But if not, the data engineer must sort through what can be an opaque set of tables to determine what is valuable and what is not.

Regardless of how the data is exposed, the classic guidance holds true: identify a compelling business justification for your solution and use that to limit the scope of the information assets you initially consume. Such a justification often comes from a strong business sponsor, who is tasked with addressing a specific business challenge and sees the availability of more timely information as critical to their success.

To illustrate this, consider a key challenge for many retail organizations today: the enablement of omnichannel solutions. Such solutions, which enable buy-online, pickup in-store (BOPIS) and cross-store transactions, depend on reasonably accurate information about store inventory. If we were to limit our initial scope to this one need, the information requirements for our monitoring and analytics system become dramatically reduced. Once a real-time inventory solution is delivered and value recognized by the business, we can expand our scope to consider other needs, such as promotions monitoring and fraud detection, expanding the breadth of information assets leveraged with each iteration.

Lesson 2: Align transmission with patterns of data generation & time-sensitivities

Different processes generate data differently within the POS. Sales transactions are likely to leave a trail of new records appended to relevant tables. Returns may follow multiple paths triggering updates to past sales records, the insertion of new, reversing sales records and/or the insertion of new information in returns-specific structures. Vendor documentation, tribal knowledge and even some independent investigative work may be required to uncover exactly how and where event-specific information lands within the POS.

Understanding these patterns can help build a data transmission strategy for specific kinds of information. Higher frequency, finer-grained, insert-oriented patterns may be ideally suited for continuous streaming. Less frequent, larger-scale events may best align with batch-oriented, bulk data styles of transmission. But if these modes of data transmission represent two ends of a spectrum, you are likely to find most events captured by the POS fall somewhere in between.

The beauty of the data lakehouse approach to data architecture is that multiple modes of data transmission can be employed in parallel. For data naturally aligned with the continuous transmission, streaming may be employed. For data better aligned with bulk transmission, batch processes may be used. And for those data falling in the middle, you can focus on the timeliness of the data required for decision making and allow that to dictate the path forward. All of these modes can be tackled with a consistent approach to ETL implementation, a challenge that thwarted many earlier implementations of what were frequently referred to as lambda architectures.

The beauty of the data lakehouse approach to data architecture is that multiple modes of data transmission can be employed in parallel. For data naturally aligned with the continuous transmission, streaming may be employed. For data better aligned with bulk transmission, batch processes may be used. And for those data falling in the middle, you can focus on the timeliness of the data required for decision making and allow that to dictate the path forward.  All of these modes can be tackled with a consistent approach to ETL implementation, a challenge that thwarted many earlier implementations of what were frequently referred to as lambda architectures.

Lesson 3: Land the data in stages

Data arrives from the in-store POS systems with different frequencies, formats, and expectations for timely availability. Leveraging the Bronze, Silver & Gold design pattern popular within lakehouses, you can separate initial cleansing, reformatting, and persistence of the data from the more complex transformations required for specific business-aligned deliverables.

A lakehouse architecture for the calculation of current inventory leveraging the Bronze, Silver & Gold pattern of data persistence

Figure 3. A data lakehouse architecture for the calculation of current inventory leveraging the Bronze, Silver & Gold pattern of data persistence

Lesson 4: Manage expectations

The move to near real-time analytics requires an organizational shift. Gartner describes through their Streaming Analytics Maturity model within which analysis of streaming data becomes integrated into the fabric of day-to-day operations. This does not happen overnight.

Instead, Data Engineers need time to recognize the challenges inherent to streaming delivery from physical store locations into a centralized, cloud-based back office. Improvements in connectivity and system reliability coupled with increasingly more robust ETL workflows land data with greater timeliness, reliability and consistency. This often entails enhancing partnerships with Systems Engineers and Application Developers to support a level of integration not typically present in the days of batch-only ETL workflows.

Business Analysts will need to become familiar with the inherent noisiness of data being updated continuously. They will need to relearn how to perform diagnostic and validation work on a dataset, such as when a query that ran seconds prior now returns a slightly different result. They must gain a deeper awareness of the problems in the data which are often hidden when presented in daily aggregates. All of this will require adjustments both to their analysis and their response to detected signals in their results.

All of this takes place in just the first few stages of maturation. In later stages, the organization’s ability to detect meaningful signals within the stream may lead to more automated sense and response capabilities. Here, the highest levels of value in the data streams are unlocked. But monitoring and governance must be put into place and proven before the business will entrust its operations to these technologies.

Implementing POS streaming

To illustrate how the lakehouse architecture can be applied to POS data, we’ve developed a demonstration workflow within which we calculate a near real-time inventory. In it, we envision two separate POS systems transmitting inventory-relevant information associated with sales, restocks and shrinkage data along with buy-online, pickup in-store (BOPIS) transactions (initiated in one system and fulfilled in the other) as part of a streaming inventory change feed. Periodic (snapshot) counts of product units on-shelf are captured by the POS and transmitted in bulk. These data are simulated for a one-month period and played back at 10x speed for greater visibility into inventory changes.

The ETL processes (as pictured in Figure 3 above) represent a mixture of streaming and batch techniques. A two-staged approach with minimally transformed data captured in Delta tables representing our Silver layer separates our initial, more technically-aligned ETL approach with the more business-aligned approach required for current inventory calculations. The second stage has been implemented using traditional structured streaming capabilities, something we may revisit with the new Delta Live Tables functionality as it makes its way towards general availability.

The demonstration makes use of Azure IOT Hubs and Azure Storage for data ingestion but would work similarly on the AWS and GCP clouds with appropriate technology substitutions. Further details about the setup of the environment along with the replayable ETL logic can be found in the following notebooks:

--

Try Databricks for free. Get started today.

The post Real-time Point-of-Sale Analytics With a Data Lakehouse appeared first on Databricks.
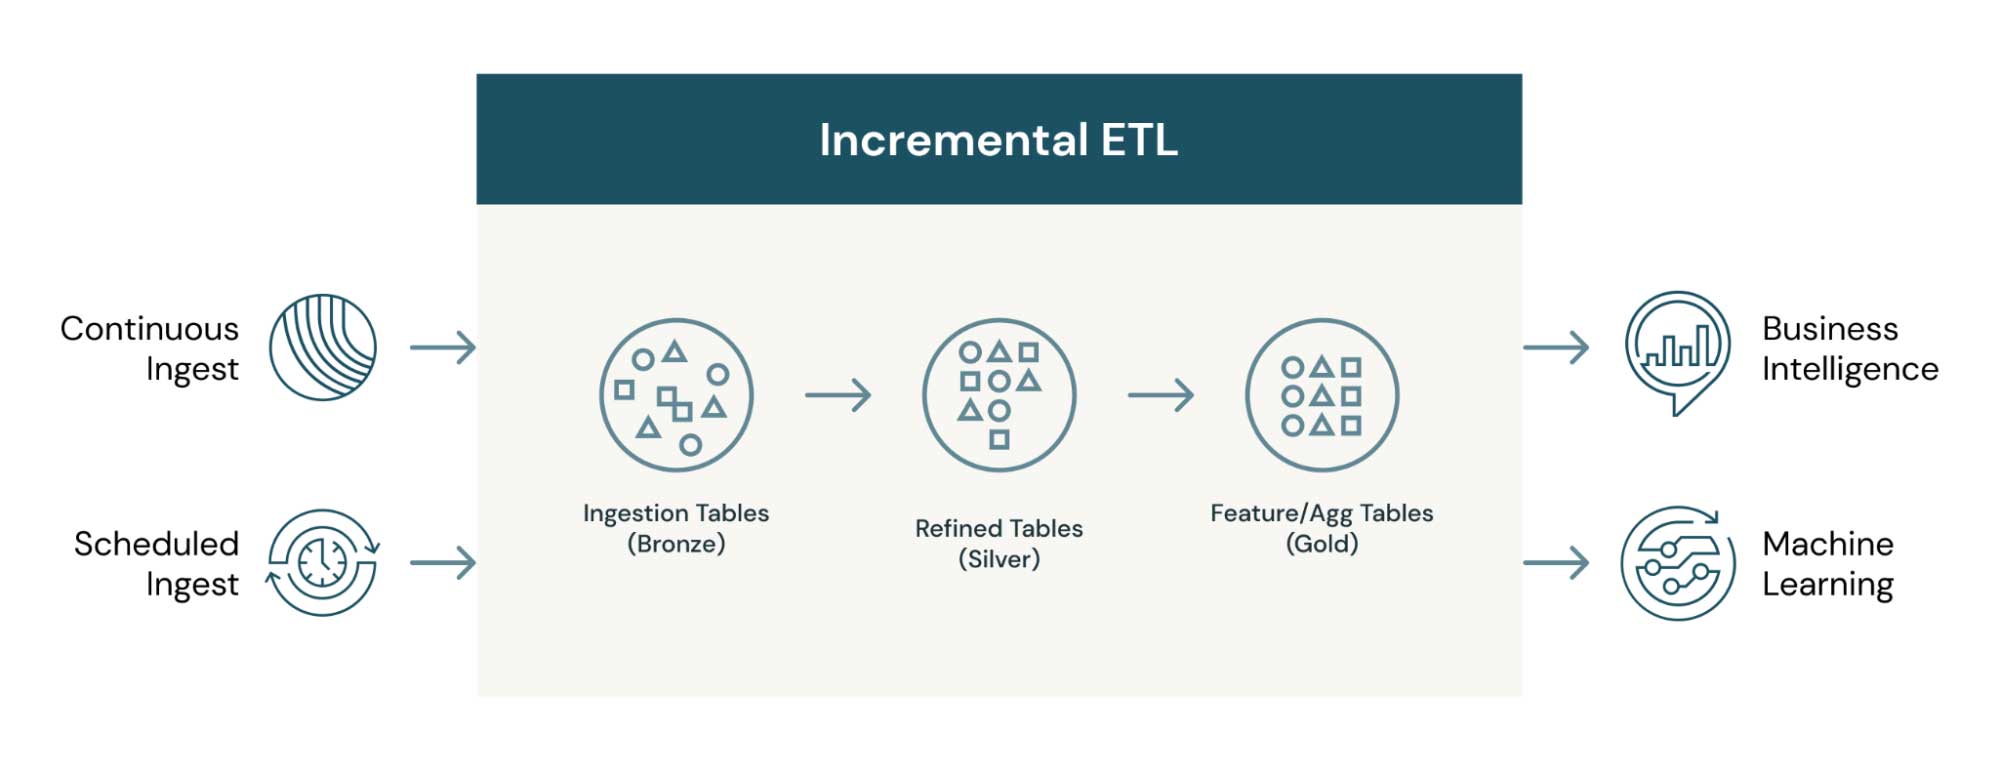
4 Ways AI Can Future-proof Financial Services’ Risk and Compliance

$
0
0

The core function of a bank is to protect assets, identify risks and mitigate losses by protecting customers from fraud, money laundering and other financial crimes. In today’s interconnected and digital world, managing risk and regulatory compliance is an increasingly complex and costly endeavour. Regulatory change has increased 500% since the 2008 global financial crisis and boosted regulatory costs in the process. Financial Services Institutions (FSIs) are struggling to keep pace with new regulations like the updated Anti-Money Laundering Act, 2020, FRTB, 2023 and PSD2 in the EU. Complying with regulations, along with consumer-driven  calls for better data management and risk assessment, often translate to higher  operating costs for banks – as much as 60%.

Compliance problems are fundamentally data problems. What should sometimes be a simple reporting activity often turns into an operation nightmare due to the lack of ground truth to build these reports against and legacy technologies to run the same at scale. Given the fines associated with non-compliance and SLA breaches (banks hit an all-time high in fines of $10 billion in 2019 for AML), processing reports has to proceed even if data is incomplete. On the other hand, a track record of poor data quality is also “fined” because of “insufficient controls.” As a consequence, many FSIs are often left battling between poor data quality and strict SLAs, balancing between data reliability and data timeliness.

In addition to modernizing data management practice by using cloud based technologies, Artificial Intelligence (AI) is increasingly becoming relevant in regulatory compliance as it addresses common operations challenges and systematic issues that regulators face every day. There are countless potential benefits of technological breakthroughs in AI, but current regtech solutions have already demonstrated at least five clear benefits: regulatory change management, reducing false positives, fraud and AML prevention and addressing human error. This blog post will walk through each of these advantages and how AI can be game-changing for FSIs as they navigate the ever-evolving world of compliance.

1. Effective regulatory change management

To successfully deal with regulatory change management, financial services have to combine content from thousands of regulatory documents. Regulatory changes require adjustments that call for cooperation between different areas of the business and have second and third-order effects. For example, when asset managers restructure a fund or portfolio based on changes in regulations, each asset within it will be affected, resulting in necessary adjustments in other portfolios. When regulations are updated, there is a set of chain reactions.

The reporting for financial services also involves myriad documents and repetitive tasks. This is where natural language processing (NLP) and intelligent process automation (IPA) are valuable in meeting compliance requirements. Additionally, NLP can analyze and classify documents, extracting useful information such as client information, products and processes that can be impacted by regulatory change, thereby keeping the financial institution and the client up-to-date with regulatory changes. Automating the process of regulatory change management is a key use case of AI. The challenges facing financial firms, including hefty fines for non-compliance, can be addressed with successful AI implementation. In 2020 the SEC alone issued 715 enforcement actions, ordering those in violation to pay more than $4.68 billion combined.  The average fine was nearly $2M. AI’s ability to detect patterns in a vast amount of text enables it to form an understanding of the ever-changing regulatory environment, and pre-empt fines and associated costs.  

2. Reducing false positives

Financial institutions are experiencing large volumes of false positives that their conventional rule-based compliance alert systems are generating. Forbes reported that with false positive rates sometimes exceeding 90%, something is broken with legacy compliance processes. Large banks are experiencing false positives in their compliance systems at alarmingly high rates. Compliance alert systems based on standard regulatory technology are triggering thousands of false positives every day. Each of these false alarms must be reviewed by a compliance officer, which invites opportunities for inefficiency and human error.

The use of AI and machine learning to capture, extract and analyze several key data elements can help streamline compliance alert systems to near-perfection, thus addressing the problem of false positives. In this way, AI technology can improve the efficiency of compliance operations and reduce costs in today’s data-driven compliance environment, by autonomously categorizing compliance-related activities and alerting them to important updates, events and activities. As these technologies are built to learn from compliance officers’ own data, AI and ML applications can streamline compliance alert systems to near-perfection. AI technology can improve the efficiency of compliance operations and reduce costs in today’s data-driven compliance environment.

3. Enhance Fraud Prevention and AML with Anomaly Detection at Scale

Adoption of AI to combat fraud is already widespread — and will only increase with time. AI can monitor transaction history, combined with other structured and unstructured information, to identify anomalies that might indicate fraud, such as ATM hacks, money laundering, lending fraud, cyberattacks and financing of terrorism.

Identifying anomalies in data is a vital data understanding task. By exposing large datasets to ML tools and statistical methods, normal patterns in data can be learned. When inconsistent events occur, anomaly detection algorithms can isolate abnormal behavior and flag any events that do not correspond to the learned patterns. With millions of data points to analyze in compliance, FSIs need the computational power to ingest transaction, customer and process information in a scalable manner. Anomaly detection algorithms can help businesses identify and react to unusual data points in multiple scenarios. A bank security system may employ anomaly detection for the identification of fraudulent transactions or non-compliant practitioners.

Another application of AI/ML is in the generation of the alerts themselves. Traditionally these alerts have been generated based on a set of rules, most of which are hand-coded and a few rely on rudimentary data mining and statistical techniques. Some of these rules are obvious and are based on the value of a single input parameter or feature. For example, any transaction to sanctioned countries or above $10,000 must be reported and analyzed as part of existing AML policies. However, certain transactions should be scrutinized because of a subtle combination of the features (a typical AML scheme would be to wire funds just under the $10,000 mark). After all, there is a motivation to disguise and hide money laundering transactions. In addition, bad actors continuously come up with new and innovative ways to stay one step ahead of the monitors. If the monitoring system is based on how people have been able to beat the system in the past, it will fail to find new methods and techniques to cheat the system. Using graph analytics and AI, organizations can  find patterns invisible to the human eye or too subtle to be caught by existing rule sets, as well as correlate isolated anomalies into unique attack vectors by learning the context surrounding anomalous behaviours.

4. Human error mitigation

Human error costs regulated industries billions every year. For example, in 2020, Citigroup’s credit department employees made a clerical error which sent almost $1 billion to Revlon Inc.’s lenders. There are various causes of human error in asset management – ineffective processes, obsolete technologies or negligence to name a few. Financial regulations require compliance officers to track, manage and analyze detailed data about transactions, customers and operational activities at large banks. The volume of this information raises several opportunities for confusion that can easily give rise to human error. With regulatory compliance growing more technology-driven by the day, AI and ML applications can be invaluable in mitigating the impacts of human error.

AI and ML technologies can shed light on blind spots, reasonable errors, and other perspectives that humans may not necessarily pick up on. Further, good AI and ML programs can spot trends and patterns.

Today’s compliance problems are data problems. A modern approach to risk and compliance requires a robust data strategy defined by analyzing unprecedented volumes of data scalably, a transparent foundation for model risk management, and connecting  real-time insights for rapid response. With a modern data-driven strategy, FSIs can better respond to the most pressing risk and compliance use cases of compliance/risk monitoring,  regulatory reporting, fraud detection, KYC, and AML. Grounding compliance in data and levelling up with AI can future-proof compliance teams.

Learn more

Learn more in our upcoming events with our  Smarter Risk and Compliance with Data and AI workshop on October 13, 2021 We are also hosting a webinar in partnership with Risk.net on Data and AI for Compliance, featuring leading risk and compliance management professionals on September 28, 2021. Register today!

--

Try Databricks for free. Get started today.

The post 4 Ways AI Can Future-proof Financial Services’ Risk and Compliance appeared first on Databricks.
Large Scale ETL and Lakehouse Implementation at Asurion

$
0
0

This is a guest post from Tomasz Magdanski, Director of Engineering, Asurion.

 
With its insurance and installation, repair, replacement and 24/7 support services, Asurion helps people protect, connect and enjoy the latest tech – to make life a little easier. Every day our team of 10,000 experts helps nearly 300 million people around the world solve the most common and uncommon tech issues. We’re just a call, tap, click or visit away for everything from getting a same-day replacement of your smartphone to helping you stream or connect with no buffering, bumps or bewilderment.

We think you should stay connected and get the most from the tech you love… no matter the type of tech or where you purchased it.

Background and challenges

Asurion’s Enterprise Data Service team is tasked with gathering over 3,500 data assets from the entire organization, providing one place where all the data can be cleaned, joined, analyzed, enriched and leveraged to create data products.

Previous iterations of data platforms, built mostly on top of traditional databases and data warehouse solutions, encountered challenges with scaling and cost due to the lack of compute and storage separation. With ever-increasing data volumes, a wide variety of data types (from structured database tables and APIs to data streams), demand for lower latency and increased velocity, the platform engineering team began to consider moving the whole ecosystem to Apache Spark™ and Delta Lake using a lakehouse architecture as the new foundation.

The previous platform was based on Lambda architecture, which introduced hard-to-solve problems, such as:

  • data duplication and synchronization
  • logic duplication, often using different technologies for batch and speed layer
  • different ways to deal with late data
  • data reprocessing difficulty due to the lack of transactional layer, which forced very close orchestration between rewrite updates or deletions
  • readers trying to access that data, forcing platform maintenance downtimes.

Using traditional extract, transform, and load (ETL) tools on large data sets was restricted to Day-Minus-1 processing frequency, and the technology stack was vast and complicated.

Asurion’s legacy data platform was operating at a massive scale, processing over 8,000 tables, 10,000 views, 2,000 reports and 2,500 dashboards. Ingestion data sources varied from database CDC feeds, APIs and flat files to streams from Kinesis, Kafka, SNS and SQS. The platform included a data warehouse combining hundreds of tables with many complicated dependencies and close to 600 data marts. Our next lakehouse had to solve for all of these use cases to truly unify on a single platform.

The Databricks Lakehouse Solution

A lakehouse architecture simplifies the platform by eliminating batch and speed layers, providing near real-time latency, supporting a variety of data formats and languages, and simplifying the technology stack into one integrated ecosystem.

To ensure platform scalability and future efficiency of our development lifecycle, we focused our initial design phases on ensuring decreased platform fragility and rigidity.

Platform fragility could be observed when a change in one place breaks functionality in another portion of the ecosystem. This is often seen in closely coupled systems. Platform rigidity is the resistance of the platform to accept changes. For example, to add a new column to a report, many jobs and tables have to be changed, making the change lifecycle long, large and more prone to errors. The Databricks Lakehouse Platform simplified our approach to architecture and design of the underlying codebase, allowing for a unified approach to data movement from traditional ETL to streaming data pipelines between Delta tables.

The Databricks Lakehouse Platform simplified our approach to architecture and design of the underlying codebase, allowing for an unified approach to data movement from traditional ETL to streaming data pipelines between Delta tables

ETL job design

In the previous platform version, every one of the thousands of ingested tables had its own ETL mapping, making management of them and the change cycle very rigid. The goal of the new architecture was to create a single job that’s flexible enough to run thousands of times with different configurations. To achieve this goal, we chose Spark Structured Streaming, as it provided ‘exactly-once’ and ‘at-least once’ semantics, along with Auto Loader, which greatly simplified state management of each job. Having said that, having over 3,500 individuals Spark jobs would inevitably lead to a similar state as 3,500 ETL mappings. To avoid this problem, we built a framework around Spark using Scala and the fundamentals of object-oriented programming. (Editor’s note: Since this solution was implemented, Delta Live Tables has been introduced on the Databricks platform to substantially streamline the ETL process.)

We have created a rich set of readers, transformations and writers, as well as Job classes accepting details through run-time dependency injection. Thanks to this solution, we can configure the ingestion job to read from Kafka, Parquet, JSON, Kinesis and SQS into a data frame, then apply a set of common transformations and finally inject the steps to be applied inside of Spark Structured Streaming’s ‘foreachBatch’ API to persist data into Delta tables.

ETL job scheduling

Databricks recommends running structured streaming jobs using ephemeral clusters, but there is a limit of 1,000 concurrently running jobs per workspace. Additionally, even if that limit wasn’t there, let’s consider the smallest cluster to consist of one master and two worker nodes. Three nodes for each job would add up to over 10,000 nodes in total and since these are streaming jobs, these clusters would have to stay up all the time. We needed to devise a solution that would balance cost and management overhead within these constraints.
To achieve this, we divided the tables based on how frequently they are updated at the source and bundled them into job groups, one assigned to each ephemeral notebook.

The notebook reads the configuration database, collects all the jobs belonging to the assigned group, and executes them in parallel on the ephemeral cluster. To speed the processing up, we use Scala parallel collections, allowing us to run jobs in parallel up to the number of the cores on the driver node. Since different jobs are processing different amounts of data, running 16 or 32 jobs at a time provides equal and full CPU utilization of the cluster. This setup allowed us to run up to 1,000 slow-changing tables on one 25 node cluster, including appending and merging into bronze and silver layers inside of the foreachBatch API.

Data marts with Databricks SQL

We have an application where business users define SQL-based data transformations that they want to store as data marts. We take the base SQL and handle the execution and maintenance of the tables. This application must be available 24×7 even if we aren’t actively running anything. We love Databricks, but weren’t thrilled about paying interactive cluster rates for idle compute. Enter Databricks SQL. With this solution, SQL Endpoints gave us a more attractive price point and exposed an easy JDBC connection for our user-facing SQL application. We now have 600 data marts and are growing more in production in our lakehouse.

Summary

Our engineering teams at Asurion implemented a lakehouse architecture at large scale, including Spark Structured Streaming, Delta Lake and Auto Loader. In an upcoming blog post, we will discuss how we encountered and resolved issues related to scaling our solution to meet our needs.

--

Try Databricks for free. Get started today.

The post Large Scale ETL and Lakehouse Implementation at Asurion appeared first on Databricks.
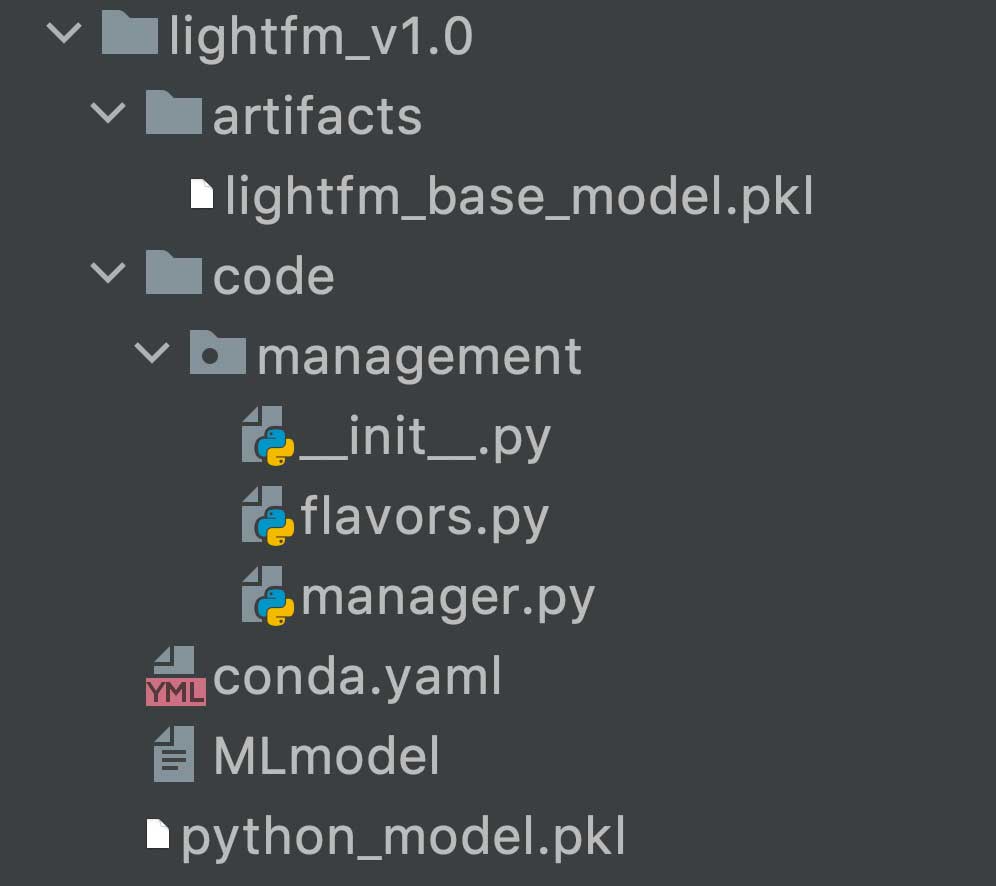
Timeliness and Reliability in the Transmission of Regulatory Reports

$
0
0

Managing risk and regulatory compliance is an increasingly complex and costly endeavour. Regulatory change has increased 500% since the 2008 global financial crisis and boosted the regulatory costs in the process. Given the fines associated with non-compliance and SLA breaches (banks hit an all-time high in fines of $10 billion in 2019 for AML), processing reports has to proceed even if data is incomplete. On the other hand, a track record of poor data quality is also “fined” because of “insufficient controls.” As a consequence, many Financial Services Institutions (FSIs) are often left battling between poor data quality and strict SLAs, balancing between data reliability and data timeliness.

In this regulatory reporting solution accelerator, we demonstrate how Delta Live Tables can guarantee the acquisition and processing of regulatory data in real time to accommodate regulatory SLAs. With Delta Sharing and Delta Live Tables combined, analysts gain real-time confidence in the quality of regulatory data being transmitted. In this blog post, we demonstrate the benefits of the Lakehouse architecture to combine financial services industry data models with the flexibility of cloud computing to enable high governance standards with low development overhead. We will now explain what a FIRE data model is and how DLT can be integrated to build robust data pipelines.

FIRE data model

The Financial Regulatory data standard (FIRE) defines a common specification for the transmission of granular data between regulatory systems in finance. Regulatory data refers to data that underlies regulatory submissions, requirements and calculations and is used for policy, monitoring and supervision purposes. The FIRE data standard is supported by the European Commission, the Open Data Institute and the Open Data Incubator FIRE data standard for Europe via the Horizon 2020 funding programme. As part of this solution, we contributed a PySpark module that can interpret FIRE data models into Apache Spark™ operating pipelines.

Delta Live Tables

Databricks recently announced a new product for data pipelines orchestration, Delta Live Tables, which makes it easy to build and manage reliable data pipelines at enterprise scale. With the ability to evaluate multiple expectations, discard or monitor invalid records in real time, the benefits of integrating the FIRE data model on Delta Live Tables are obvious. As illustrated in the following architecture, Delta Live Table will ingest granular regulatory data landing onto cloud storage, schematize content and validate records for consistency in line with the FIRE data specification. Keep reading to see us demo the use of Delta Sharing to exchange granular information between regulatory systems in a safe, scalable, and transparent manner.

The use of Delta Sharing to exchange granular information between regulatory systems in a safe, scalable, and transparent manner.

Enforcing schema

Even though some data formats may “look” structured (e.g. JSON files), enforcing a schema is not just a good engineering practice; in enterprise settings, and especially in the space of regulatory compliance, schema enforcement guarantees any missing field to be expected, unexpected fields to be discarded and data types to be fully evaluated (e.g. a date should be treated as a date object and not a string). It also proof-tests your systems for eventual data drift. Using the FIRE pyspark module, we programmatically retrieve the Spark schema required to process a given FIRE entity (collateral entity in that example) that we apply on a stream of raw records.

from fire.spark import FireModel
fire_model = FireModel().load("collateral")
fire_schema = fire_model.schema

In the example below, we enforce schema to incoming CSV files. By decorating this process using @dlt annotation, we define our entry point to our Delta Live Table, reading raw CSV files from a mounted directory and writing schematized records to a bronze layer.

@dlt.create_table()
def collateral_bronze():
  return (
    spark
      .readStream
      .option("maxFilesPerTrigger", "1")
      .option("badRecordsPath", "/path/to/invalid/collateral")
      .format("csv")
      .schema(fire_schema)
      .load("/path/to/raw/collateral")

Evaluating expectations

Applying a schema is one thing, enforcing its constraints is another. Given the schema definition of a FIRE entity (see example of the collateral schema definition), we can detect if a field is required or not. Given an enumeration object, we ensure its values are consistent (e.g. currency code). In addition to the technical constraints from the schema, the FIRE model also reports business expectations, such as minimum, maximum, monetary and maxItems. All these technical and business constraints will be programmatically retrieved from the FIRE data model and interpreted as a series of Spark SQL expressions.

from fire.spark import FireModel
fire_model = FireModel().load("collateral")
fire_constraints = fire_model.constraints

With Delta Live Tables, users have the ability to evaluate multiple expectations at once, enabling them to drop invalid records, simply monitoring data quality or abort an entire pipeline. In our specific scenario, we want to drop records failing any of our expectations, which we later store to a quarantine table, as reported in the notebooks provided in this blog.

@dlt.create_table()
@dlt.expect_all_or_drop(fire_constraints)
def collateral_silver():
  return dlt.read_stream("collateral_bronze")

With only a few lines of code, we ensured that our silver table is both syntactically (valid schema) and semantically (valid expectations) correct. As shown below, compliance officers have full visibility around the number of records being processed in real time. In this specific example, we ensured our collateral entity to be exactly 92.2% complete (quarantine handles the remaining 7.8%).

 Direct Acyclic Graph of delta live table with output quality metrics

Operations data store

In addition to the actual data stored as delta files, Delta Live Tables also stores operation metrics as “delta” format under system/events. We follow a standard pattern of the Lakehouse architecture by “subscribing” to new operational metrics using AutoLoader, processing system events as new metrics unfold — in batch or in real time. Thanks to the transaction log of Delta Lake that keeps track of any data update, organizations can access new metrics without having to build and maintain their own checkpointing process.

input_stream = spark \
    .readStream \
    .format("delta") \
    .load("/path/to/pipeline/system/events")
      
output_stream = extract_metrics(input_stream)
    
output_stream \
    .writeStream \
    .format("delta") \
    .option("checkpointLocation", "/path/to/checkpoint") \
    .table(metrics_table)

With all metrics available centrally into an operation store, analysts can use Databricks SQL to create simple dashboarding capabilities or more complex alerting mechanisms to detect data quality issues in real time.

Data quality metrics streamed from pipeline execution

The immutability aspect of the Delta Lake format coupled with the transparency in data quality offered by Delta Live Tables allows financial institutions to “time travel” to specific versions of their data that matches both volume and quality required for regulatory compliance. In our specific example, replaying our 7.2% of invalid records stored in quarantine will result in a different Delta version attached to our silver table, a version that can be shared amongst regulatory bodies.

DESCRIBE HISTORY fire.collateral_silver

Transmission of regulatory data

With full confidence in both data quality and volume, financial institutions can safely exchange information between regulatory systems using Delta Sharing, an open protocol for enterprise data exchange. Not constraining end users to a same platform nor relying on complex ETL pipelines to consume data (accessing data files through a SFTP server for instance), the open source nature of Delta Lake makes it possible for data consumers to access schematized data natively from Python, Spark or directly through MI/BI dashboards (such as Tableau or PowerBI).

Although we could be sharing our silver table as-is, we may want to use business rules that only share regulatory data when a predefined data quality threshold is met. In this example, we clone our silver table at a different version and to a specific location segregated from our internal networks and accessible by end users (demilitarized zone, or DMZ).

from delta.tables import *

deltaTable = DeltaTable.forName(spark, "fire.collateral_silver")
deltaTable.cloneAtVersion(
  approved_version, 
  dmz_path, 
  isShallow=False, 
  replace=True
)

spark.sql(
  "CREATE TABLE fire.colleral_gold USING DELTA LOCATION '{}'"
    .format(dmz_path)
)

Although the Delta Sharing open source solution relies on a sharing server to manage permission, Databricks leverages Unity Catalog to centralize and enforce access control policies, provide users with full audit logs capability and simplify access management through its SQL interface. In the example below, we create a SHARE that includes our regulatory tables and a RECIPIENT to share our data with.

-- DEFINE OUR SHARING STRATEGY
CREATE SHARE regulatory_reports;

ALTER SHARE regulatory_reports ADD TABLE fire.collateral_gold;
ALTER SHARE regulatory_reports ADD TABLE fire.loan_gold;
ALTER SHARE regulatory_reports ADD TABLE fire.security_gold;
ALTER SHARE regulatory_reports ADD TABLE fire.derivative_gold;

-- CREATE RECIPIENTS AND GRANT SELECT ACCESS
CREATE RECIPIENT regulatory_body;

GRANT SELECT ON SHARE regulatory_reports TO RECIPIENT regulatory_body;

Any regulator or user with granted permissions can access our underlying data using a personal access token exchanged through that process. For more information about Delta Sharing, please visit our product page and contact your Databricks representative.

Proof test your compliance

Through this series of notebooks and Delta Live Tables jobs, we demonstrated the benefits of the Lakehouse architecture in the ingestion, processing, validation and transmission of regulatory data. Specifically, we addressed the need for organizations to ensure consistency, integrity and timeliness of regulatory pipelines that could be easily achieved using a common data model (FIRE) coupled with a flexible orchestration engine (Delta Live Tables). With Delta Sharing capabilities, we finally demonstrated how FSIs could bring full transparency and confidence to the regulatory data exchanged between various regulatory systems while meeting reporting requirements,reducing operation costs and adapting to new standards.

Get familiar with the FIRE data pipeline using the attached notebooks and visit our Solution Accelerators Hub to get up to date with our latest solutions for financial services.

Provisioning Delta Live Tables for regulatory reporting
Enabling transmission of regulatory data with Delta Sharing

--

Try Databricks for free. Get started today.

The post Timeliness and Reliability in the Transmission of Regulatory Reports appeared first on Databricks.

Part 1: Implementing CI/CD on Databricks Using Databricks Notebooks and Azure DevOps

$
0
0

Discussed code can be found here.

This is the first part of a two-part series of blog posts that show how to configure and build end-to-end MLOps solutions on Databricks with notebooks and Repos API. This post presents a CI/CD framework on Databricks, which is based on Notebooks. The pipeline integrates with the Microsoft Azure DevOps ecosystem for the Continuous Integration (CI) part and Repos API for the Continuous Delivery (CD).In the second post, we’ll show how to leverage the Repos API functionality to implement a full CI/CD lifecycle on Databricks and extend it to the fully-blown MLOps solution.

CI/CD with Databricks Repos

Fortunately, with the new functionality provided by Databricks Repos and Repos API, we are now well equipped to cover all key aspects of version control, testing and pipelines underpinning MLOps approaches. Databricks Repos allow cloning whole git repositories in Databricks and with the help of Repos API, we can automate this process by first cloning a git repository and then check out the branch we are interested in. ML practitioners can now use a repository structure well known from IDEs in structuring their project, relying on notebooks or .py files for implementation of modules (with support for arbitrary file format in Repos planned on the roadmap). Therefore, the entire project is version controlled by a tool of your choice (Github, Gitlab, Azure Repos to name a few) and integrates very well with common CI/CD pipelines. The Databricks Repos API allows us to update a repo (Git project checked out as repo in Databricks) to the latest version of a specific git branch.

The teams can follow the classical Git flow or GitHub flow cycle during development. The whole Git repository can be checked out with Databricks Repos. Users will be able to use and edit the notebooks as well as plain Python files or other text file types with arbitrary file support. This allows us to use classical project structure, importing modules from Python files and combining them with notebooks:

  1. Develop individual features in a feature branch and test using unit tests (e.g., implemented notebooks).
  2. Push changes to the feature branch, where the CI/CD pipeline will run the integration test.
  3. CI/CD pipelines on Azure DevOps can trigger Databricks Repos API to update this test project to the latest version.
  4. CI/CD pipelines trigger the integration test job via the Jobs API. Integration tests can be implemented as a simple notebook that will at first run the pipelines that we would like to test with test configurations. This can be done by just running an appropriate notebook with executing corresponding modules or by triggering the real job using jobs API.
  5. Examine the results to mark the whole test run as green or red.

With Databricks’ CI/CD solution, data teams can follow the classical git flow or GitHub flow cycle during the development. The whole git repository can be checked out with Databricks Repos.

Let’s now examine how we can implement the approach described above. As an exemplary workflow, we will focus on data coming from Kaggle Lending Club competition. Similar to many financial institutions, we would like to understand and predict individual income data, for example, to assess the credit score of an application. In order to do so, we analyze various applicant features and attributes, ranging from current occupation, homeownership, education to location data, marital status and age. This is the information a bank has collected, (e.g., in the past credit applications), and it is now used to train a regression model.

Moreover, we know that our business changes dynamically, and there is a high volume of new observations daily. With the regular ingestion of new data, retraining the model is crucial. Therefore, the focus is on full automation of the retraining jobs as well as the entire continuous deployment pipeline. To ensure high-quality outcomes and the high predictive power of a newly trained model, we add an evaluation step after each trained job. Here the ML model is scored on a curated data set and compared to the currently deployed production version. Therefore, the model promotion can happen only if the new iteration has high predictive power.

As a project is actively developed and worked on, the fully-automated testing of new code and promotion to the next stage of the life cycle utilizes the Azure DevOps framework for unit/integration evaluation at push/pull requests. The tests are orchestrated through the Azure DevOps framework and executed on the Databricks platform. This covers the CI part of the process, ensuring high test coverage of our codebase, minimizing human supervision.

The continuous delivery part relies solely on the Repos API, where we use the programmatic interface to check out the newest version of our code in the Git branch and deploy the newest scripts to run the workload. This allows us to simplify the artifact deployment process and easily promote the tested code version from dev through staging to production environments. Such an architecture guarantees the full isolation of various environments and is typically favored in increased security environments. The different stages: dev, staging, and prod share only the version control system, minimizing potential interference with highly-critical production workloads. At the same time, the exploratory work and innovation are decoupled as the dev environment may have more relaxed access controls.

Implement CI/CD pipeline using Azure DevOps and Databricks

In the following code repository, we implemented the ML project with a CI/CD pipeline powered by Azure DevOps. In this project, we use notebooks for data preparation and model training.

Let’s see how we can test these notebooks on Databricks. Azure DevOps is a very popular framework for complete CI/CD workflows available on Azure. For more information, please have a look at the overview of provided functionalitiesand continuous integrations with Databricks.
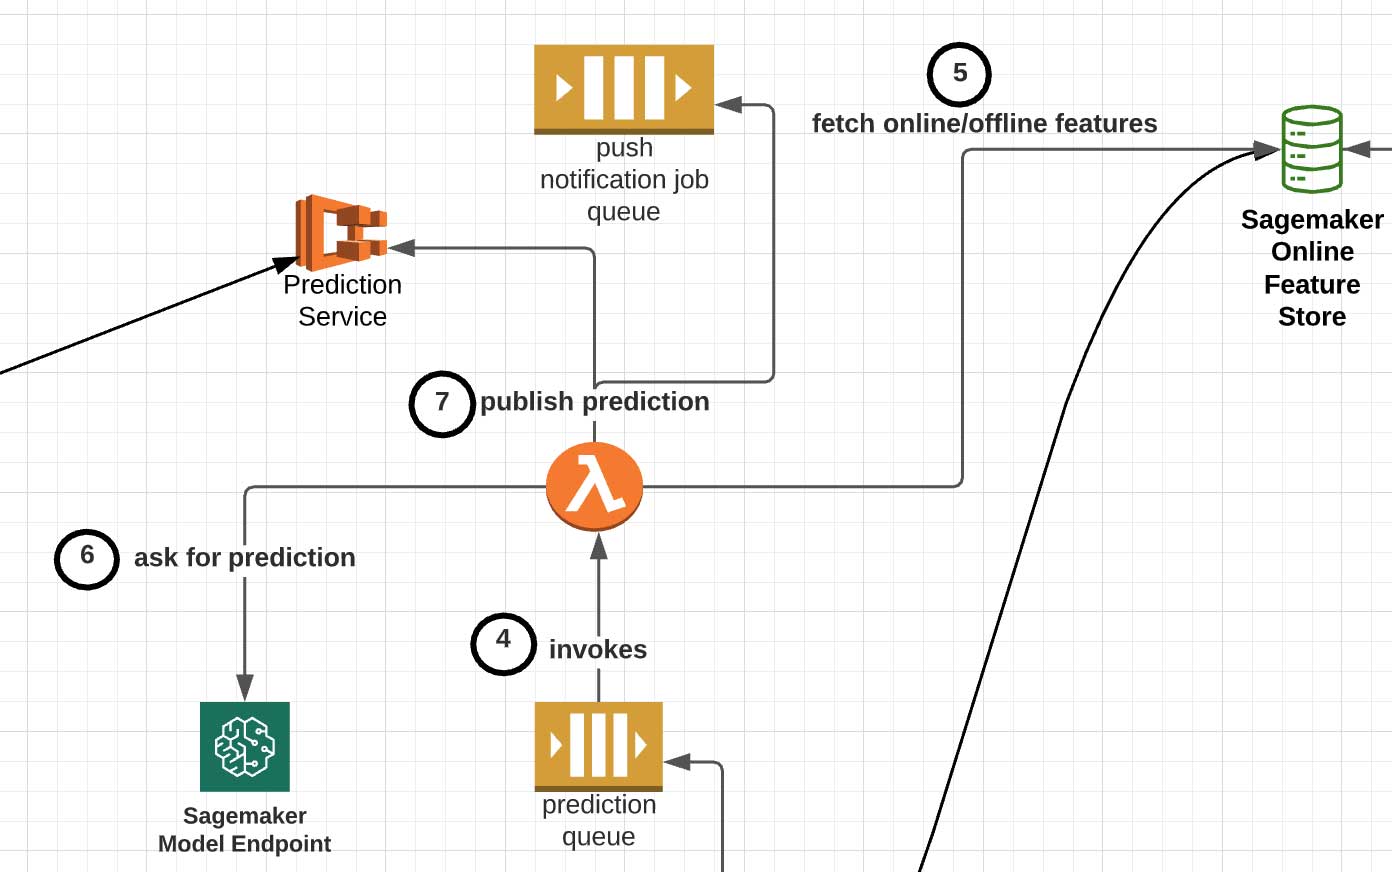
We are using the Azure DevOps pipeline as a YAML file. The pipeline treats Databricks notebooks like simple Python files, so we can run them inside our CI/CD pipeline. We have placed a YAML file for our Azure CI/CD pipeline inside azure-pipelines.yml. The most interesting part of this file is a call to Databricks Repos API to update the state of the CI/CD project on Databricks and a call to Databricks Jobs API to trigger integration test job execution. We have developed both these items in deploy.py script/notebook. We can call it in the following way inside the Azure DevOps pipeline:

- script: |
        python deploy/deploy.py
      env:
        DATABRICKS_HOST: $(DATABRICKS_HOST)
        DATABRICKS_TOKEN: $(DATABRICKS_TOKEN)
      displayName: 'Run integration test on Databricks'

DATABRICKS_HOST and DATABRICKS_TOKEN environment variables are needed by the databricks_cli package to authenticate us against the Databricks workspace we are using. These variables can be managed through Azure DevOps variable groups.

Let’s examine the deploy.py script now. Inside the script, we are using databricks_cli API to work with the Databricks Jobs API. First, we have to create an API client:

config = EnvironmentVariableConfigProvider().get_config()
api_client = _get_api_client(config, command_name="cicdtemplates-")

After that, we can create a new temporary Repo on Databricks for our project and pull the latest revision from our newly created Repo:

#Let's create Repos Service
repos_service = ReposService(api_client)

# Let's store the path for our new Repo
repo_path = f'{repos_path_prefix}_{branch}_{str(datetime.now().microsecond)}'

# Let's clone our GitHub Repo in Databricks using Repos API
repo = repos_service.create_repo(url=git_url, provider=provider, path=repo_path)

#Let's checkout the needed branch
repos_service.update_repo(id=repo['id'], branch=branch)

Next, we can kick off the execution of the integration test job on Databricks:

res = jobs_service.submit_run(run_name="our run name", existing_cluster_id=existing_cluster_id,  notebook_task=repo_path + notebook_path )
run_id = res['run_id']

Finally, we wait for the job to complete and examine the result:

while True:
    status = jobs_service.get_run(run_id)
    print(status)
    result_state = status["state"].get("result_state", None)
    if result_state:
        print(result_state)
        assert result_state == "SUCCESS"
   break
    else:
        time.sleep(5)

Working with multiple workspaces

Using the Databricks Repos API for CD may be particularly useful for teams striving for complete isolation between their dev/staging and production environments. The new feature allows data teams, through source code on Databricks, to deploy the updated codebase and artifacts of a workload through a simple command interface across multiple environments.  Being able to programmatically check out the latest codebase in the version control system ensures a timely and simple release process.

For the MLOps practices, there are numerous serious considerations on the right architectural setup between various environments. In this study, we focus only on the paradigm of full isolation, which would also cover multiple MLflow instances associated with dev/staging/prod. In that light, the models trained in a dev environment would not be pushed to the next stage as serialized objects are loaded through a single common Model Registry. The only artifact deployed is the new training pipeline codebase that is released and executed in the STAGING environment, resulting in a new model trained and registered with MLflow.

This shared-nothing principle, jointly with strict permission management on prod/staging env, but rather relaxed access patterns on dev, allows for robust and high-quality software development. Simultaneously, it offers a higher degree of freedom in the dev instance, speeding up innovation and experimentation across the data team.

Databricks CI/CD solution environment setup with dev, staging, and prod with shared version control system and data syncs from PROD to other environments.

Environment setup with dev, staging, and prod with a shared version control system and data syncs from PROD to other environments.

Summary

In this blog post, we presented an end-to-end approach for CI/CD pipelines on Databricks using notebook-based projects. This workflow is based on the Repos API functionality that not only lets the data teams structure and version control their projects in a more practical way but also greatly simplifies the implementation and execution of the CI/CD tools. We showcased an architecture in which all operational environments are fully isolated, ensuring a high degree of security for production workloads powered by ML.

The CI/CD pipelines are powered by a framework of choice and integrate with the Databricks Unified Analytics Platform smoothly, triggering the execution of the code and infrastructure provisioning end-to-end. Repos API radically simplifies not only the version management, code structuring, and development part of a project lifecycle but also the continuous delivery, allowing to deploy the production artifacts and code between environments. It is an important improvement that adds to the overall efficiency and scalability of Databricks and greatly improves software developer experience.

Discussed code can be found here.


References:

--

Try Databricks for free. Get started today.

The post Part 1: Implementing CI/CD on Databricks Using Databricks Notebooks and Azure DevOps appeared first on Databricks.

Viewing all 1873 articles
Browse latest View live