Quantcast
Channel: Databricks
Viewing all 1874 articles
Browse latest View live

Announcing General Availability of Databricks Feature Store

$
0
0

Today, we are thrilled to announce that Databricks Feature Store is generally available (GA)! In this blog post, we explore how Databricks Feature Store, the first feature store co-designed with an end-to-end data and MLOps platform, provides data teams with the ability to define, explore and reuse machine learning features, build training data sets, retrieve feature values for batch inference, and publish features to low-latency online stores.

Quick recap: What is a feature?

In machine learning, a feature is an attribute – or measurable characteristic – that is relevant to making a prediction. For example, in a machine learning model trying to predict traffic patterns on a highway, the time of day, day of the week, and throughput of cars can all be considered features. However, real-world data requires a significant amount of preprocessing, wrangling, and transformations to become usable for machine learning applications. For example, you may want to remove highly correlated input data or analyze language prior to feeding that data into your model as a feature. The process of making raw data machine learning-ready is called feature engineering.

The challenges of feature engineering

Feature engineering is complex and time-consuming. As organizations build and iterate on more machine learning models, it becomes increasingly important that already-built features can be discovered, shared, and reused. Good feature-reuse practices can save data teams weeks. But once features are being re-used, it is critical that their real-world performance is tracked closely. Quite often, a feature computation used in training may deviate from the one used in production, which leads to a skew in predictions, resulting in degraded model quality. It’s also critical to establish feature lineage – to track which models are using what features and the data going into these features.

Many of our customers have told us that a good feature development platform can significantly accelerate model development time, eliminate duplicate data pipelines, improve data quality, and help with data governance.

The Databricks Feature Store

The first of its kind, Databricks Feature Store is co-designed with popular open source frameworks Delta Lake and MLflow. Delta Lake serves as an open data layer of the feature store, and MLflow format makes it possible to encapsulate interactions with the feature store in the model package, simplifying deployment and versioning of the models. Building upon these unique differentiators Databricks Feature Store delivers following key benefits:

  • Discover and reuse features in your tool of choice: The Databricks Feature Store UI helps data science teams across the organization benefit from each other’s work and reduce feature duplication. The feature tables on the Databricks Feature Store are implemented as Delta tables. This open data lakehouse architecture enables organizations to deploy the feature store as a central hub for all features, open and securely accessible by Databricks workspaces and third-party tools.
  • Eliminate online/offline skew: By packaging feature information within the MLflow model, Databricks Feature Store automates feature lookups across all phases of the model lifecycle: during the model training, batch and online inference. This ensures that features used in model inference and model training have gone through exactly the same transformations, eliminating common failure modes of real-time model serving.
  • Automated lineage tracking: As an integrated component of the unified data and AI platform Databricks Feature Store is uniquely positioned to capture complete lineage graph: starting from data sources of the features, to models and inference end-points consuming them. The lineage graph also includes the versions of the code used at each point. This facilitates powerful lineage-based discovery and governance. Data scientists can find the features that are already being computed for the raw data they are interested in. Data engineers can safely determine whether features can be updated or deleted depending on whether any active model consumes the features.

The Databricks Feature Store UI helps data teams discover, share, and re-use features.

Customers win with feature store on the Lakehouse

Hundreds of customers have already deployed Databricks Feature Store to empower their production Machine Learning processes. For customers such as Via, this resulted in an increase of developer productivity by 30%, and reduction of data processing costs by over 25%.

  • Via: “Databricks Feature Store enables us to create a robust and stable environment for creating and reusing features consumed by models. This has enabled our data scientists and analysts to be more productive, as they no longer have to waste time converting data into features from scratch each time.”
    — Cezar Steinz, Manager of MLOps at Via

What’s New?

The GA release also includes a variety of exciting new functionality.

Time-series feature tables and point-in-time joins

(AWS, Azure, GCP)

One of the most common types of data stored in feature stores is time-series data. It is also the type of data that requires the most careful handling. Slightest misalignment of data points in joins over time dimension results in data leakage from the future of the time-series which erodes model performance in ways that are not always easy to detect. Manually programming joins between features with different sliding time windows requires intense focus and meticulous attention to detail.

Databricks Feature Store removes this burden by providing built-in support for time-series data. Data scientists can simply indicate which column in the feature table is the time dimension and the Feature Store APIs take care of the rest. In model training, the dataset will be constructed using a set of correct AS-OF joins. In batch inference, packaged MLflow models will perform point-in-time lookups. In online serving, the Feature Store will optimize storage by publishing only the most recent values of the time-series and automatically expiring the old values.

Let’s illustrate how easy it is to create a training dataset from time-series feature tables using new Feature Store APIs for a product recommendation model. First, we will create a time-series feature table from PySpark user_features_dataframe with event_time column serving as a time dimension.

from databricks.feature_store import FeatureStoreClient

fs = FeatureStoreClient()
fs.create_table(
 name="advertisement_team.user_features",
 keys="user_id",
 timestamp_keys="event_time",
 features_df=user_features_dataframe,
)

Next, we’ll create a training dataset by joining training data from raw_clickstream dataframe with 2 features from the time-series feature table.

from databricks.feature_store import FeatureLookup

feature_lookups = [
 FeatureLookup(
   table_name="advertisement_team.user_features",
   feature_names=["purchases_30d", "purchases_1d"],
   lookup_key="user_id",
   timestamp_lookup_key="ad_impression_time"
 )
]

training_dataset = fs.create_training_set(
 raw_clickstream,
 feature_lookups=feature_lookups,
 label="ad_clicked",
)

The training_dataset contains optimized AS-OF joins that guarantee correct behavior. This is all it takes to create a training dataset with Databricks Feature Store APIs and start training models with any ML framework.

NoSQL online store

(AWS)

In addition to a variety of SQL Databases already supported as online stores for feature serving, Databricks Feature Store now has support for AWS DynamoDB. For publishing time-series feature tables, you can publish to DynamoDB with a time-to-live so that stale features automatically expire from the online store. Support for Azure Cosmos DB is coming soon.

Data pipeline health monitoring

(AWS, Azure, GCP)

The Feature Store UI monitors the status of the data pipeline that produced the feature table and informs users if it runs stale. This helps prevent outages and provides better insights to data scientists about the quality of the features they find in the feature store.

Learn more about the Databricks Feature Store

Get more familiar with feature stores with this ebook: The Comprehensive Guide to Feature Stores

Take it for a spin! Check out the Databricks Machine Learning free trial on your cloud of choice to get your hands on the Feature Store

Dive deeper into the Databricks Feature Store documentation

Check out this awesome use-case with our customer Via and the tech lead on the Feature Store: All About Feature Stores


Credits
We’d like to acknowledge the contributions of several people that helped in the journey from ideation to GA: Clemens Mewald, Paul Ogilvie, Avesh Singh, Aakrati Talati, Traun Leyden, Zhidong Qu, Nina Hu, Coco Ouyang, Justin Wei, Divya Gupta, Carol Sun, Tyler Townley, Andrea Kress. We would also like to thank Xing Chen and Patrick Wendell for their support in this journey.

--

Try Databricks for free. Get started today.

The post Announcing General Availability of Databricks Feature Store appeared first on Databricks.


Build Data and ML Pipelines More Easily With Databricks and Apache Airflow

$
0
0

We are excited to announce a series of enhancements in Apache Airflow’s support for Databricks. These new features make it easy to build robust data and machine learning (ML)  pipelines in the popular open-source orchestrator. With the latest enhancements, like new DatabricksSqlOperator, customers can now use Airflow to query and ingest data using standard SQL on Databricks, run analysis and ML tasks on a notebook, trigger Delta Live Tables to transform data in the lakehouse, and more.

Apache Airflow is a popular, extensible platform to programmatically author, schedule and monitor data and machine learning pipelines (known as DAGs in Airflow parlance) using Python. Airflow contains a large number of built-in operators that make it easy to interact with everything from databases to cloud storage. Databricks has supported Airflow since 2017, enabling Airflow users to trigger workflows combining notebooks, JARs and Python scripts on Databricks’ Lakehouse Platform, which scales to the most challenging data and ML workflows on the planet.

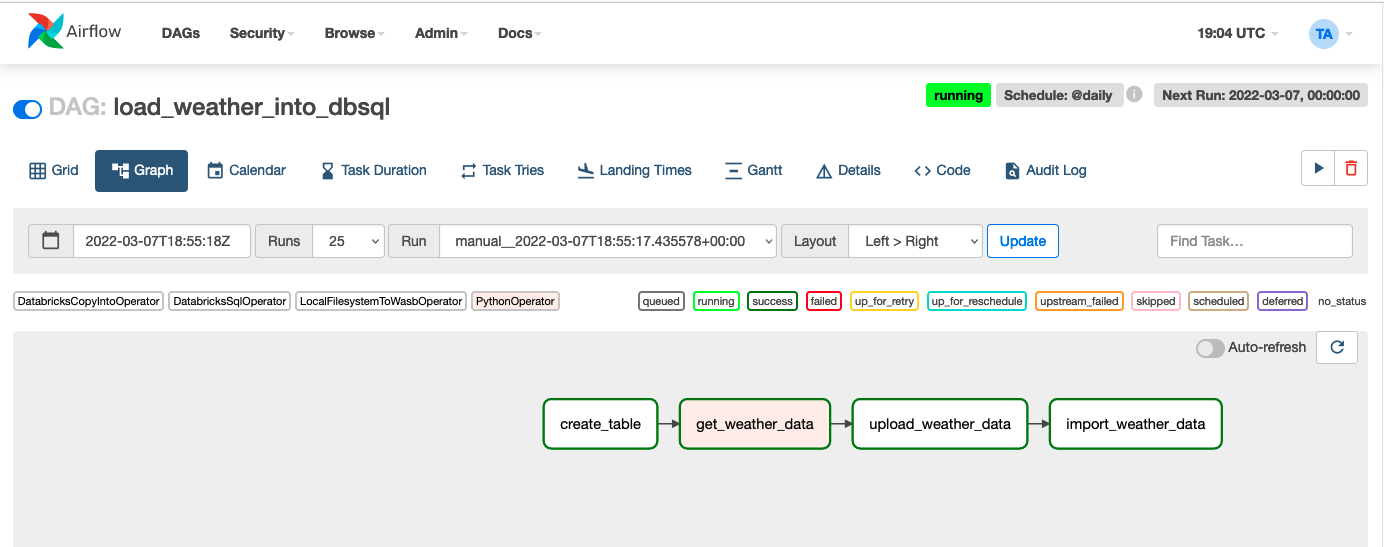
Let’s take a tour of new features via a real-world task: building a simple data pipeline that loads newly-arriving weather data from an API into a Delta Table without using Databricks notebooks to perform that job. For the purposes of this blog post, we are going to do everything on Azure, but the process is almost identical on AWS and GCP. Also, we will perform all steps on a SQL endpoint but the process is quite similar if you prefer to use an all-purpose Databricks cluster instead. The final example DAG will look like this in the Airflow UI:

 Airflow DAG for ingestion of data into Databricks SQL table

For the sake of brevity, we will elide some code from this blog post. You can see all the code here.

Install and configure Airflow

This blog post assumes you have an installation of Airflow 2.1.0 or higher and have configured a Databricks connection. Install the latest version of the Databricks provider for Apache Airflow:


pip install apache-airflow-providers-databricks

Create a table to store weather data

We define the Airflow DAG to run daily. The first task, create_table, runs a SQL statement, which creates a table called airflow_weather in the default schema if the table already does not exist. This task demonstrates the DatabricksSqlOperator which can run arbitrary SQL statements on Databricks compute, including SQL endpoints.

with DAG(
        "load_weather_into_dbsql",
        start_date=days_ago(0),
        schedule_interval="@daily",
        default_args=default_args,
        catchup=False,
) as dag:
  table = "default.airflow_weather"
  schema = "date date, condition STRING, humidity double, precipitation double, " \
           "region STRING, temperature long, wind long, " \
           "next_days ARRAY<STRUCT>" 

  create_table = DatabricksSqlOperator(
    task_id="create_table",
    sql=[f"create table if not exists {table}({schema}) using delta"],
  )

Retrieve weather data from the API and upload to cloud storage

Next, we use the PythonOperator to make a request to the weather API, storing results in a JSON file in a temporary location.

Once we have the weather data locally, we upload it to cloud storage using the LocalFilesystemToWasbOperator since we are using Azure Storage. Of course, Airflow also supports uploading files to Amazon S3 or Google Cloud Storage as well:

get_weather_data = PythonOperator(task_id="get_weather_data",
                                  python_callable=get_weather_data,
                                  op_kwargs={"output_path": "/tmp/{{ds}}.json"},
                                  )

copy_data_to_adls = LocalFilesystemToWasbOperator(
  task_id='upload_weather_data',
  wasb_conn_id='wasbs-prod,
  file_path="/tmp/{{ds}}.json",
  container_name='test',
  blob_name="airflow/landing/{{ds}}.json",
)

Note that the above uses the {{ds}} variable to instruct Airflow to replace the variable with the date of the scheduled task run, giving us consistent, non-conflicting filenames.

Ingest data into a table

Finally, we are ready to import data into a table. To do this, we use the handy DatabricksCopyIntoOperator, which generates a COPY INTO SQL statement. The COPY INTO command is a simple yet powerful way of idempotently ingesting files into a table from cloud storage:

import_weather_data = DatabricksCopyIntoOperator(
    task_id="import_weather_data",
    expression_list="date::date, * except(date)",
    table_name=table,
    file_format="JSON",
     file_location="abfss://mycontainer@mystoreaccount.dfs.core.windows.net/airflow/landing/", files=["{{ds}}.json"])

That’s it! We now have a reliable data pipeline that ingests data from an API into a table with just a few lines of code.

But that’s not all …

We are also happy to announce improvements that make integrating Airflow with Databricks a snap.

  • The DatabricksSubmitRunOperator has been upgraded to use the latest Jobs API v2.1. With the new API it’s much easier to configure access controls for jobs submitted using DatabricksSubmitRunOperator, so developers or support teams can easily access job UI and logs.
  • Airflow can now trigger Delta Live Table pipelines.
  • Airflow DAGs can now pass parameters for JAR task types.
  • It’s possible to update Databricks Repos to a specific branch or tag, to make sure that jobs are always using the latest version of the code.
  • On Azure, it’s possible to use Azure Active Directory tokens instead of personal access tokens (PAT). For example, if Airflow runs on an Azure VM with a Managed Identity, Databricks operators could use managed identity to authenticate to Azure Databricks without need for a PAT token. Learn more about this and other authentication enhancements here.

The future is bright for Airflow users on Databricks

We are excited about these improvements, and are looking forward to seeing what the Airflow community builds with Databricks. We would love to hear your feedback on which features we should add next.

--

Try Databricks for free. Get started today.

The post Build Data and ML Pipelines More Easily With Databricks and Apache Airflow appeared first on Databricks.

A Clear Vision and Path to Execution: Why I Joined Databricks

$
0
0

I recently had the opportunity to join Databricks as SVP of Corporate Development and Product Partnerships and wanted to share some perspective on why I’m thrilled to embark on such an incredible journey.

I’ve been fortunate enough in my career to have worked at two generational software companies, Salesforce and Atlassian, and I’m convinced that Databricks has the opportunity to be the most strategic company in the enterprise software landscape.

At Salesforce, I had the opportunity to witness the power of the cloud in building customer connectivity; Atlassian demonstrated how important collaborative tools are to developing software and enhancing productivity across every company. Both companies had massive tailwinds as customers of all sizes sought out solutions to embrace software that ensured they could maintain competitive differentiation.

Databricks is helping organizations leverage their most important asset – data, in all of its forms – to maintain competitive differentiation and drive massive amounts of value for their customers. By simplifying and democratizing data through the Lakehouse Platform, Databricks has an opportunity to be the most important platform to support all data driven aspects of the modern enterprise. From Comcast to J.B. Hunt to SEGA Europe, Databricks can help its customers thrive.

Aside from the massive opportunity (and limitless TAM) in front of us, there area few other reasons that made this move a no brainer:

Incredible talent

Founder-led companies are special places to work. Having 7 founders still building Databricks is a testament to the opportunity in front of us. Founder-led means consistency in the vision and, as a result, a clear path to execution. The talent that Databricks has attracted is immensely knowledgeable, and focused on making an impact for Databricks and its customers. In some ways, it’s daunting to be surrounded by such incredible people, each intrinsically focused on maintaining our innovation velocity for our customers and partners.

The company lives by its values, is deeply transparent, and focused on execution – all critical ingredients in driving towards the massive opportunity we have in front of us.

Customer obsessed

We’re nothing without our customers. And while every company claims to be “customer obsessed,” Databricks has made it part of its DNA. The pace of innovation required to bring together data scientists, data engineers, and business users is no small feat, and we’re delivering it to ensure our customers are able to drive relevant differentiation. With more than 5,000 customers across industries benefiting from our Lakehouse platform, even in these early earnings, we’re helping bring the power of data, analytics, and AI – all operating within one platform – to companies across the globe.

A massive community and ecosystem

Databricks recognizes, and even celebrates, how critical partners are to success. The ecosystem around us is incredible and ripe for growth. Partner Connect became generally available in November 2021, highlighting how Databricks is building a world class ecosystem to deliver the best solutions possible for our customers. Moreover, having a keen eye toward increasing our momentum with Databricks Ventures, which invests in innovative companies that share our view of the future for data, analytics and AI, and selectively pursuing innovation through M&A, we have the opportunity to be incredibly strategic in how we can work with other companies to provide value to our customers.

Come join us

Given our ambition, we’re looking to continue to invest aggressively in building across all of our teams! Visit our career page to explore our global opportunities and to learn more about our people and the impact we’re making around the world.

--

Try Databricks for free. Get started today.

The post A Clear Vision and Path to Execution: Why I Joined Databricks appeared first on Databricks.

Speed Up Streaming Queries With Asynchronous State Checkpointing

$
0
0

Background / Motivation

Stateful streaming is becoming more prevalent as stakeholders make increasingly sophisticated demands on greater volumes of data. The tradeoff, however, is that the computational complexity of stateful operations increases data latency, making it that much less actionable. Asynchronous state checkpointing, which separates the process of persisting state from the regular micro-batch checkpoint, provides a way to minimize processing latency while maintaining the two hallmarks of Structured Streaming: high throughput and reliability.

Before getting into the specifics, it’s helpful to provide some context and motivation as to why we developed this stream processing feature. The industry consensus regarding the main barometer for streaming performance is the absolute latency it takes for a pipeline to process a single record. However, we’d like to present a more nuanced view on evaluating overall performance: instead of considering just the end-to-end latency of a single record, it’s important to look at a combination of throughput and latency over a period of time and in a reliable fashion. That’s not to say that certain operational use cases don’t require the bare minimum absolute latency – those are valid and important. However, is it better for analytical and ETL use cases to process 200,000 records / second or 20M records / minute? It always depends on the use case, but we believe that volume and cost-effectiveness are just as important as velocity for streaming pipelines. There are fundamental tradeoffs between efficiency and supporting very low latency within the streaming engine implementations, so we encourage our customers to go through the exercise of determining whether the incremental cost is worth the marginal decrease in data latency.

Structured Streaming’s micro-batch execution model seeks to strike a balance between high throughput, reliability and data latency.

High throughput

Thinking about streaming conceptually, all incoming data are considered unbounded, irrespective of the volume and velocity. Applying that concept to Structured Streaming, we can think of every query as generating an unbounded dataframe. Under the hood, Apache Spark™ breaks up the data coming in as an unbounded dataframe into smaller micro-batches that are also dataframes. This is important for two reasons:

  • It allows the engine to apply the same optimizations available to batch / ad-hoc queries for each of those dataframes, maximizing efficiency and throughput
  • It gives users the same simple interface and fault tolerance as batch / ad-hoc queries

Reliability

On the reliability front, Structured Streaming writes out a checkpoint after each micro-batch, which tracks the progress of what it processed from the data source, intermediate state (for aggregations and joins), and what was written out to the data sink. In the event of failure or restart, the engine uses that information to ensure that the query only processes data exactly once. Structured Streaming stores these checkpoints on some type of durable storage (e.g., cloud blob storage) to ensure that the query properly recovers after failure. For stateful queries, the checkpoint includes writing out the state of all the keys involved in stateful operations to ensure that the query restarts with the proper values.

Data latency

As data volumes increase, the number of keys and size of state maintained increases, making state management that much more important and time consuming. In order to further reduce the data latency for stateful queries, we’ve developed asynchronous checkpointing specifically for the state of the various keys involved in stateful operations. By separating this from the normal checkpoint process into a background thread, we allow the query to move on to the next micro-batch and make data available to the end users more quickly, while still maintaining reliability.

How it works

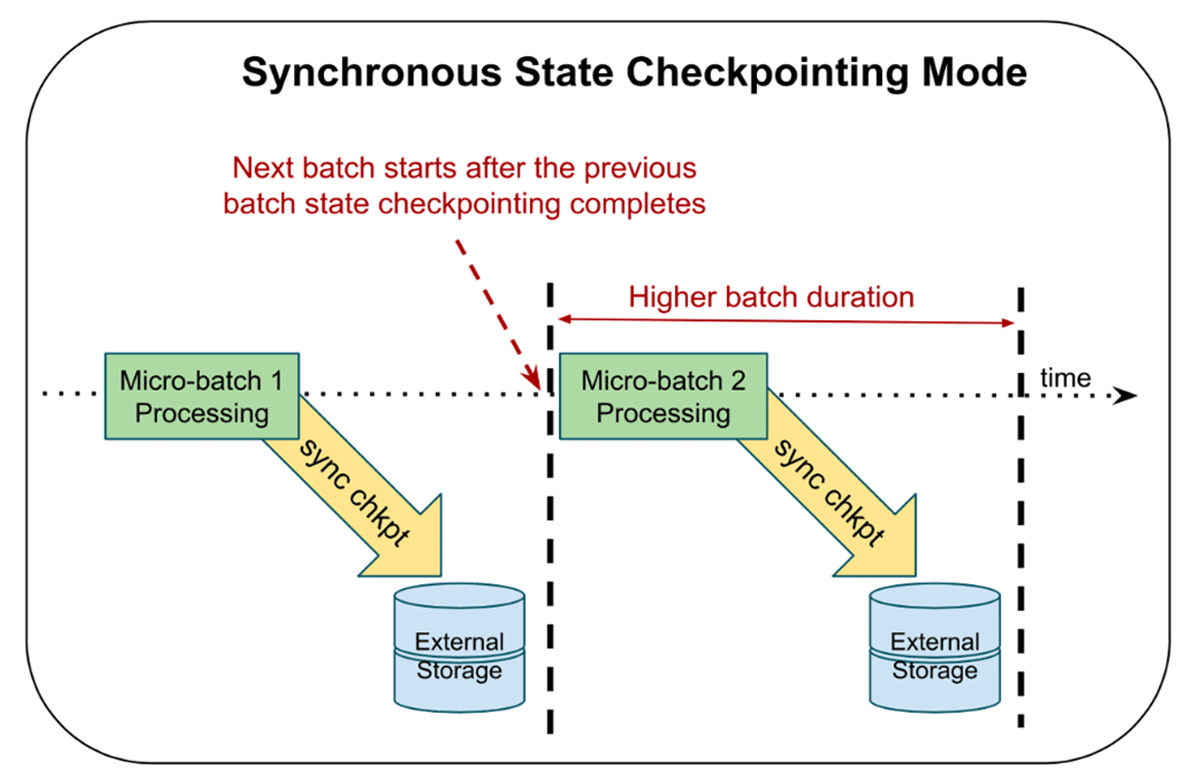
Typically, Structured Streaming utilizes synchronous state checkpointing, meaning that the engine writes out the current state of all keys involved in stateful operations as part of the normal checkpoint for each micro-batch before proceeding to the next one. The benefit of this approach is that, if a streaming query fails, the application can quickly recover the progress of a stream and only needs to re-process starting from the failed micro-batch. The tradeoff for fast recovery is increased duration for normal micro-batch execution.

Structured Streaming utilizes synchronous checkpointing, writing out the current state of all keys involved in stateful operations before proceeding to the next one

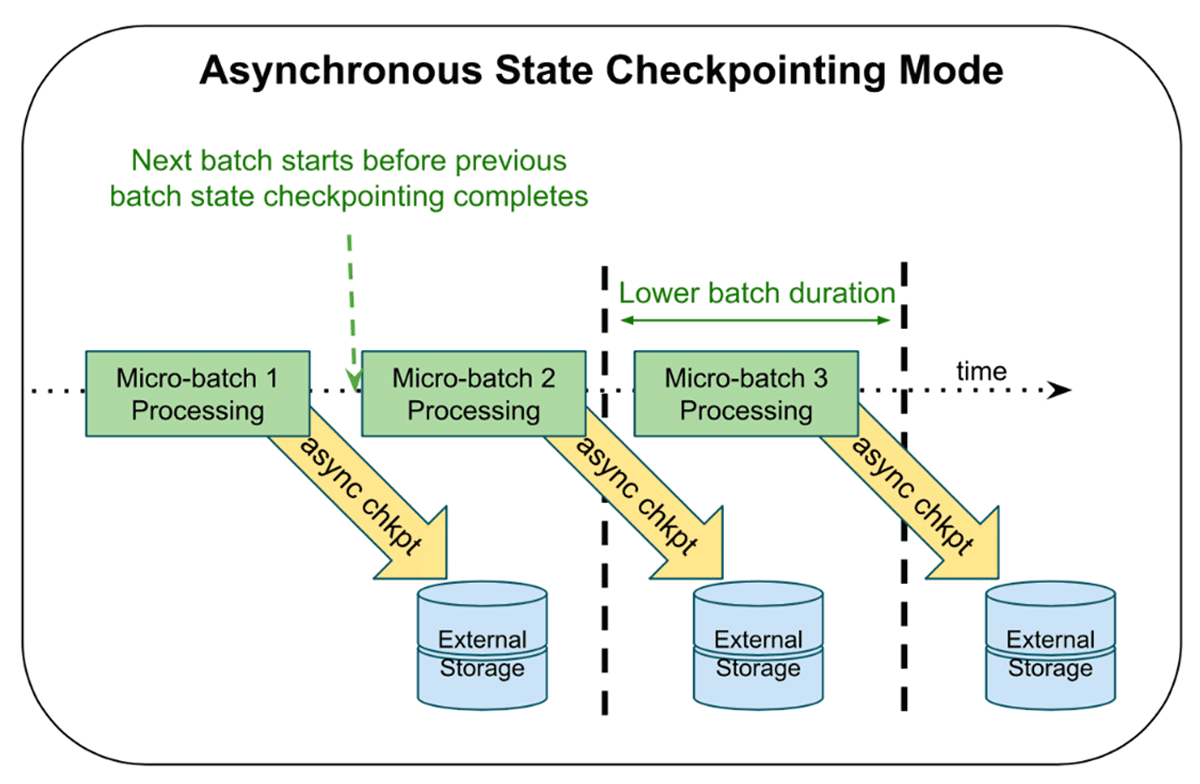
Asynchronous state checkpointing separates the checkpointing of state from the normal micro-batch execution. With the feature enabled, Structured Streaming doesn’t have to wait for checkpoint completion of the current micro-batch before proceeding to the next one – it starts immediately after. The executors send the status of the asynchronous commit back to the driver and once they all complete, the driver marks the micro-batch as fully committed. As of current, the feature allows for up to one micro-batch to be pending checkpoint completion. The tradeoff for lower data latency is that, on failure, the query may need to re-process two micro-batches to give the same fault-tolerance guarantees: the current micro-batch undergoing computation and the prior micro-batch whose state checkpoint was in process.

Asynchronous state checkpointing separates the checkpointing of state from the normal micro-batch execution..

A metaphor for explaining this is shaping dough in a bakery. Bakers commonly use both hands to shape a single piece of dough, which is slower, but if they make a mistake, they only need to start over on that single piece. Some bakers may decide to shape two pieces of dough at once, which increases their throughput, but potential mistakes could necessitate recreating both pieces. In this example, synchronous processing is using two hands to shape one piece of dough and asynchronous processing is using two hands to shape separate pieces.

For queries bottlenecked on state updates, asynchronous state checkpointing provides a low cost way to reduce data latency without sacrificing any reliability.

Identifying candidate queries

We want to reiterate that asynchronous state checkpointing only helps with certain workloads: stateful streams whose state checkpoint commit latency is a major contributing factor to overall micro-batch execution latency.

Here’s how users can identify good candidates:

  • Stateful operations: the query includes stateful operations like windows, aggregations, [flat]mapGroupsWithState or stream-stream joins.
  • State checkpoint commit latency: users can inspect the metrics from within a StreamingQueryListener event to understand the impact of the commit latency on overall micro-batch execution time. The log4j logs on the driver also contain the same information.

See below for an example of how to analyze a StreamingQueryListener event for good candidate query:

Streaming query made progress: {
  "id" : "2e3495a2-de2c-4a6a-9a8e-f6d4c4796f19",
  "runId" : "e36e9d7e-d2b1-4a43-b0b3-e875e767e1fe",
  …
  "batchId" : 0,
  "durationMs" : {
    "addBatch" : 519387,
  …
    "triggerExecution" : 547730,
  …
  },
  "stateOperators" : [ {
  …
    "commitTimeMs" : 3186626,
  …
    "numShufflePartitions" : 64,
  …
    }]
  }

There’s a lot of rich information in the example above, but users should focus on certain metrics:

  • Batch duration (durationMs.triggerExecution) is around 547 secs
  • The aggregate state store commit time across all tasks (stateOperators[0].commitTimeMs) is around 3186 secs
  • Tasks related to the state store (stateOperators[0].numShufflePartitions) is 64, which means that each task that contained the state operator added an average of 50 seconds of wall clock time (3186 seconds / 64 tasks) to each batch. Assuming all 64 tasks ran concurrently, the commit step accounted for around 9% (50 secs / 547 secs) of the batch duration. If the maximum number of concurrent tasks is less than 64, the percentage could increase. For example, if there were 32 concurrent tasks, then it would actually account for 18% of total execution time

Enabling asynchronous state checkpointing

Provision a cluster with Databricks Runtime 10.4 or newer and use the following Spark configurations:

spark.conf.set(
"spark.databricks.streaming.statefulOperator.asyncCheckpoint.enabled",
"true"
)

spark.conf.set(
"spark.sql.streaming.stateStore.providerClass", "com.databricks.sql.streaming.state.RocksDBStateStoreProvider"
)

A few items to note:

  • Asynchronous state checkpointing only supports the RocksDB-based state store
  • Any failure related to storing an asynchronous state checkpoint will cause the query to fail after a predefined number of retries. This behavior is different from synchronous checkpointing (which is executed as part of a task) where Spark has the ability to retry failed tasks multiple times before failing a query

Through testing a combination of in-house and customer workloads on both file and message bus sources, we’ve found average micro-batch duration can improve by up to 25% for streams that have large state sizes with millions of entries. Anecdotally, we’ve seen even bigger improvements in peak micro-batch duration (the longest time it takes for the stream to process a micro-batch).

Conclusion

Asynchronous state checkpointing isn’t a feature we’ve developed in isolation – it’s the next in a series of new features we’ve released that simplify the operation and maintenance of stateful streaming queries. We’re continuing to make big investments in our streaming capabilities and are laser-focused on making it easy for our customers to deliver more data, more quickly, to their end users. Stay tuned!

--

Try Databricks for free. Get started today.

The post Speed Up Streaming Queries With Asynchronous State Checkpointing appeared first on Databricks.

Monitoring Your Databricks Lakehouse Platform with Audit Logs

$
0
0

This blog is part two of our Admin Essentials series, where we’ll focus on topics that are important to those managing and maintaining Databricks environments. In this series we’ll share best practices for topics like workspace management, data governance, ops & automation and cost tracking & chargeback – keep an eye out for more blogs soon!

The Databricks Lakehouse Platform has come a long way since we last blogged about audit logging back in June 2020. We’ve set world records, acquired companies, and launched new products that bring the benefits of a lakehouse architecture to whole new audiences like data analysts and citizen data scientists. The world has changed significantly too. Many of us have been working remotely for the majority of that time, and remote working puts increased pressure on acceptable use policies and how we measure that they’re being followed.

As such, we thought that now would be a good time to revisit the topic of audit logging for your Databricks Lakehouse Platform. In this blog, we’ll bring our best practice recommendations up-to-date with the latest features available – allowing you to move the dial from retrospective analysis to proactive monitoring and alerting – for all of the important events happening on your lakehouse:

Account Level Audit Logging
Adopt Unity Catalog
Easy & Reliable Audit Log Processing with Delta Live Tables
Easy Querying with Databricks SQL
Easy Visualization with Databricks SQL
Automatic Alerting with Databricks SQL
Trust but Verify with 360 visibility into your Lakehouse
Best Practices Roundup
Conclusion

Account level audit logging

Audit logs are vitally important for a number of reasons – from compliance to cost control. They are your authoritative record of what’s happening in your lakehouse. But in the past, platform administrators had to configure audit logging individually for each workspace, leading to increased overhead and the risk of organizational blindspots due to workspaces being created that weren’t audit log enabled.

Now customers can leverage a single Databricks account to manage all of their users, groups, workspaces and you guessed it – audit logs – centrally from one place. This makes life far simpler for platform administrators, and carries much less risk from a security perspective. Once customers have configured audit logging at the account level, they can sleep soundly in the knowledge that we will continue to deliver a low latency stream of all of the important events happening on their lakehouse – for all new and existing workspaces created under that account.

Check out the docs (AWS, GCP) to set up account level audit logs for your Databricks Lakehouse Platform now.

Centralized Governance with Unity Catalog

Unity Catalog (UC) is the world’s first fine-grained and centralized governance layer for all of your data and AI products across clouds. Combining a centralized governance layer with comprehensive audit logs allows you to answer questions like:

  • What are the most popular data assets across my organization?
  • Who is trying to gain unauthorized access to my data products, and what queries are they trying to run?
  • Are my Delta Shares being restricted to only trusted networks?
  • Which countries are my Delta Shares being accessed from?
  • Which US states are my Delta Shares being accessed from?
  • Which locations are my Delta Shares being accessed from?

Customers who are already on the preview for UC can see what this looks like by searching the audit logs for events WHERE serviceName == “unityCatalog”, or by checking out the example queries in the repo provided. If you’re looking for these kinds of capabilities for your lakehouse please sign up here!

Easy & reliable audit log processing with Delta Live Tables

One hallmark of successful customers that we have seen over and over is that those who focus on data quality as a first priority grow their lakehouse faster than those that do not. Historically this has been easier said than done. Engineers who already have to spend too much time worrying about things like sizing, managing and scaling infrastructure now need to find the time to integrate their code with open source or third party data quality and testing frameworks. And what’s more, these frameworks often struggle to scale to huge volumes of data, making them useful for discrete integration tests, but leaving the engineers with another headache when they want to validate the results of a representative-scale performance test.

Enter Delta Live Tables (DLT). With DLT, engineers are able to treat their data as code and leverage built-in data quality controls, so that the time and energy they would otherwise have to spend on the aforementioned tasks can instead be redirected towards more productive activities – such as ensuring that bad quality data never makes its way near the critical decision making processes of the business.

And because the ETL pipelines that process audit logging will benefit greatly from the reliability, scalability and built-in data quality controls that DLT provides, we’ve taken the ETL pipeline shared as part of our previous blog and converted it to DLT.

This DLT pipeline reads in the JSON files comprising your audit logs using Autoloader, a simple and effortlessly scalable solution for ingesting data into your lakehouse (see the docs for AWS, Azure, GCP). It then creates a bronze and silver table each for account and workspace level actions, transforming the data and making it easier to use at every step. Finally, it creates a gold table for every Databricks service (see the docs for AWS, Azure, GCP)

After consuming the JSON files, the Delta Live Tables (DLT)  pipeline creates a bronze, silver, and gold table each for each account and workspace level action.

The silver table allows you to perform detailed analysis across all Databricks services, for scenarios like investigating a specific user’s actions across the entire Databricks Lakehouse Platform. The gold tables meanwhile allow you to perform faster queries relating to particular services. This is particularly useful when you want to configure alerts relating to specific actions.

The examples below will work out of the box for customers on AWS and GCP. For Azure Databricks customers who have set up their diagnostic logs to be delivered to an Azure storage account, minor tweaks may be required. The reason for this is that the diagnostic log schema on Azure is slightly different to that on AWS and GCP.

To get the new DLT pipeline running on your environment, please use the following steps:

  1. Clone the Github Repo using the repos for Git Integration (see the docs for AWS, Azure, GCP).
  2. Create a new DLT pipeline, linking to the dlt_audit_logs.py notebook (see the docs for AWS, Azure, GCP). You’ll need to enter the following configuration options:
    a. INPUT_PATH: The cloud storage path that you’ve configured for audit log delivery. This will usually be a protected storage account which isn’t exposed to your Databricks users.
    b. OUTPUT_PATH: The cloud storage path you want to use for your audit log Delta Lakes. This will usually be a protected storage account which isn’t exposed to your Databricks users.
    c. CONFIG_FILE: The path to the audit_logs.json file once checked out in your repo.
  3. Note: once you’ve edited the settings that are configurable via the UI, you’ll need to edit the JSON so that you can add the configuration needed to authenticate with your INPUT_PATH and OUTPUT_PATH to the clusters object:
    a. For AWS add the instance_profile_arn to the aws_attributes object.
    b. For Azure add the Service Principal secrets to the spark_conf object.
    c. For GCP add the google_service_account to the gcp_attributes object.
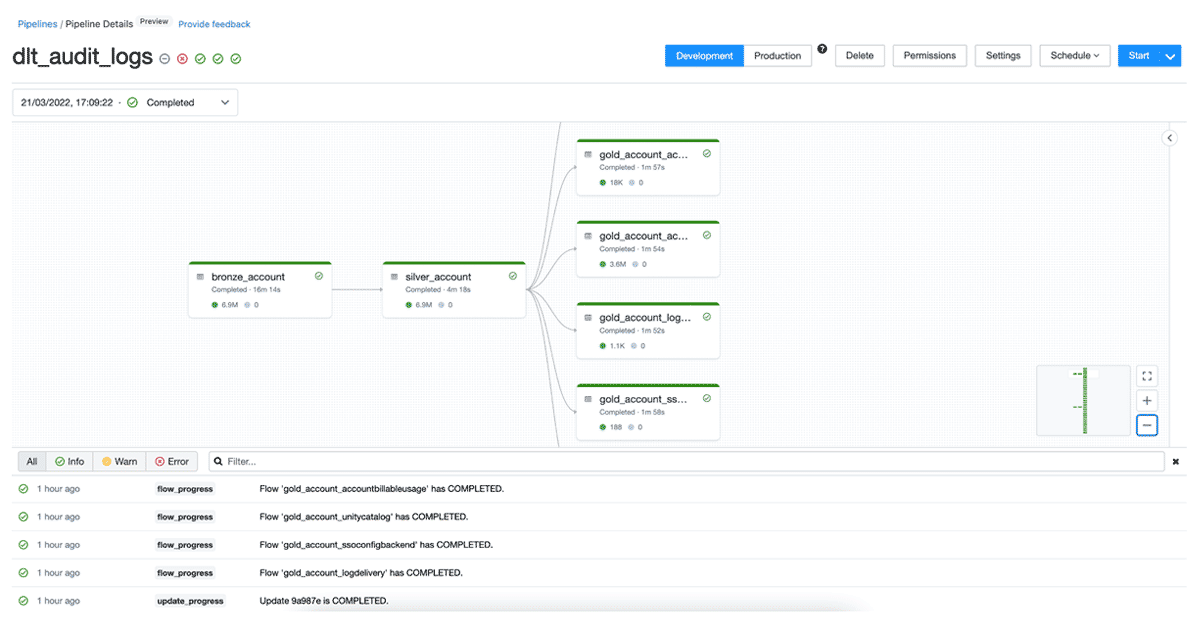
  4. Now you should be ready to configure your pipeline to run based on the appropriate schedule and trigger. Once it’s ran successfully, you should see something like this:
  5. Sample Databricks Delta Live Tables (DLT) 'medallion' workflow.

There are a few things you should be aware of:

  1. The pipeline processes data based on a configurable list of log levels and service names based on the CONFIG_FILE referenced above.
  2. By default, the log levels are ACCOUNT_LEVEL and WORKSPACE_LEVEL. Right now these are the only audit levels that we use at Databricks, but there’s no guarantee that we won’t add additional log levels in the future. It’s worth checking the audit log schema periodically to ensure that you aren’t missing any logs because new audit levels have been added (see the docs for AWS, Azure, GCP).
  3. The serviceNames are likely to change as we add new features and therefore services to the platform. They could also vary depending on whether you leverage features like PCI-DSS compliance controls or Enhanced Security Mode. You can periodically check the list of service names on our public docs (AWS, Azure, GCP) but because the likelihood of this is greater, we’ve also added a detection mode into the DLT pipeline to make you aware if new services are introduced into the logs you aren’t expecting and therefore ingesting into your lakehouse. Read on for more information about how we use expectations in Delta Live Tables to detect potential data quality issues like this.

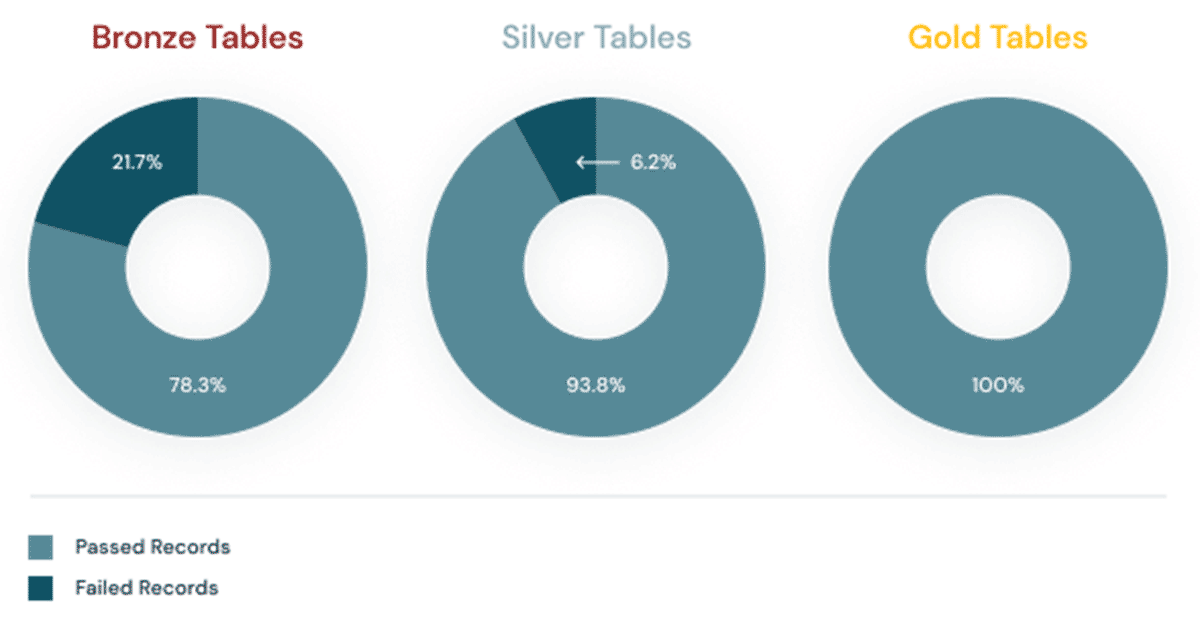
Expectations prevent bad data from flowing into tables through validation and integrity checks and avoid data quality errors with predefined error policies (fail, drop, alert or quarantine data).

Sample Databricks Delta Live Tables (DLT) visualization for audit log project, reporting 'medallion' workflow KPIs.

In the dlt_audit_logs.py notebook you’ll notice that we include the following decorator for each table:

@dlt.expect_all({})

This is how we set data expectations for our Delta Live Tables. You’ll also notice that for the bronze table we’re setting an expectation called unexpected_service_names in which we’re comparing the incoming values contained within the serviceName column to our configurable list. If new serviceNames are detected in the data that we aren’t tracking here, we’ll be able to see this expectation fail and know that we may need to add new or untracked serviceNames to our configuration:

Sample Databricks Delta Live Tables (DLT) visualization for audit log project, reporting incidence of 'untracked serviceNames' detected in workflow.

To find out more about expectations, check out our documentation for AWS, Azure and GCP.

At Databricks we believe that Delta Live Tables are the future of ETL. If you’ve liked what you’ve seen and want to find out more, check out our Getting Started Guide!

Easy querying with Databricks SQL

Now that you’ve curated your audit logs into bronze, silver and gold tables, Databricks SQL lets you query them with awesome price-performance. If you navigate to the Data Explorer (see the docs for AWS, Azure) you’ll find the bronze, silver and gold tables in the target database you specified within the DLT configuration above.

Potential use cases here might be anything from ad-hoc investigations into potential misuse, to finding out who’s creating the huge GPU clusters that are coming out of your budget.

In order to get you started, we’ve provided a series of example account and workspace level SQL queries covering services and scenarios you might especially care about. You’ll find these checked out as SQL notebooks when you clone the repo, but you can just copy and paste the SQL to run them in Databricks SQL instead. Note, the queries assume your database is called audit_logs. If you chose to call it something else in the DLT configuration above, just replace audit_logs with the name of your database.

Easy visualization with Databricks SQL

As well as querying the data via a first-class SQL experience and lightning fast query engine, Databricks SQL allows you to quickly build dashboards with an intuitive drag-and-drop interface, and then share them with key stakeholders. What’s more, they can be set to automatically refresh, ensuring that your decision makers always have access to the latest data.

It’s hard to preempt all of the things that you might want to show your key stakeholders here, but hopefully the SQL queries and the associated visualizations demonstrated here should give you a glimpse of what’s possible:

Which countries are my Delta Shares being accessed from?

Sample Databricks SQL dashboard for Delta Live Tables (DLT) audit log project, reporting 'Delta Sharing requests by Country.'

Sample Databricks SQL dashboard for Delta Live Tables (DLT) audit log project, reporting 'Delta Sharing requests by Lat/Long.'

How reliable are my jobs?

Sample Databricks SQL dashboard for Delta Live Tables (DLT) audit log project, reporting 'Job Runs Success v. Failure Rate.'

Failed login attempts over time

Spikes in failed login attempts can indicate brute force attacks, and trends should be monitored. In the chart below for example, the regular monthly spikes may be symptomatic of a 30 day password rotation policy, but the huge spike for one particular user in January looks suspicious.

Sample Databricks SQL dashboard for Delta Live Tables (DLT) audit log project, reporting 'Failed Login Attempts Over Time.'

You can find all of the SQL queries used to build these visualizations as well as many more besides in the example SQL queries provided in the repo.

Automatic alerting with Databricks SQL

As with any platform, there are some events that you’re going to care about more than others, and some that you care about so much that you want to be proactively informed whenever they occur. Well, the good news is, you can easily configure Databricks SQL alerts to notify you when a scheduled SQL query returns a hit on one of these events. You can even make some simple changes to the example SQL queries we showed you earlier to get started:

  • Update the queries to make them time bound (I.e. by adding a timestamp >= current_date() – 1)
  • Update the queries to return a count of events you don’t expect to see (I.e. by adding a COUNT(*) and an appropriate WHERE clause)
  • Now you can configure an alert to run every day and trigger if the count of events is > 0
  • For more complicated alerting based on conditional logic, consider the use of CASE statements (see the docs for AWS, Azure)

For example, the following SQL queries could be used to alert whenever:

1. There have been workspace configuration changes within the last day:

SELECT
  requestParams.workspaceConfKeys,
  requestParams.workspaceConfValues,
  email,
  COUNT(*) AS total
FROM
  audit_logs.gold_workspace_workspace
WHERE
  actionName = 'workspaceConfEdit'
  AND timestamp >= current_date() - 1
GROUP BY 
1, 2, 3
ORDER BY total DESC

2. There have been downloads of artifacts that may contain data from the workspace within the last day:

WITH downloads_last_day AS (
  SELECT
    timestamp,
    email,
    serviceName,
    actionName
  FROM
    audit_logs.gold_workspace_notebook
  WHERE
    actionName IN ("downloadPreviewResults", "downloadLargeResults")
  UNION ALL
  SELECT
    timestamp,
    email,
    serviceName,
    actionName
  FROM
    audit_logs.gold_workspace_databrickssql
  WHERE
    actionName IN ("downloadQueryResult")
  UNION ALL
  SELECT
    timestamp,
    email,
    serviceName,
    actionName
  FROM
    audit_logs.gold_workspace_workspace
  WHERE
    actionName IN ("workspaceExport")
    AND requestParams.workspaceExportFormat != "SOURCE"
  ORDER BY
    timestamp DESC
)
SELECT
  DATE(timestamp) AS date,
  email,
  serviceName,
  actionName,
  count(*) AS total
FROM
  downloads_last_day 
WHERE timestamp >= current_date() - 1
GROUP BY
  1,
  2,
  3,
  4

These could be coupled with a custom alert template like the following to give platform administrators enough information to investigate whether the acceptable use policy has been violated:

Alert "{{ALERT_NAME}}" changed status to {{ALERT_STATUS}}

There have been the following unexpected events in the last day:

{{QUERY_RESULT_ROWS}}

Check out our documentation for instructions on how to configure alerts (AWS, Azure), as well as for adding additional alert destinations like Slack or PagerDuty (AWS, Azure).

Trust but Verify with 360 visibility into your Lakehouse

Databricks audit logs provide a comprehensive record of the actions performed on your lakehouse. However, if you’re not using Unity Catalog (and trust me, if you aren’t then you should be) then some of the interactions that you care most about might only be captured in the underlying cloud provider logs. An example might be access to your data, which if you use cloud native access controls is only really captured at the coarse grained level allowed by storage access logs.

As per our previous blog on the subject, for this (along with other reasons) you might also want to join your Databricks audit logs with various logging and monitoring outputs captured from the underlying cloud provider. And whilst the recommendations in the previous blog still hold true, stay tuned for a future revision including DLT pipelines for these workloads too!

Best practices roundup

To summarize, here are 5 logging & monitoring best practices for admins that we’ve touched on throughout this article:

  1. Enable audit logging at the account level. Having auditability from the very start of your lakehouse journey allows you to establish a historical baseline. Oftentimes, you only realize how much you need audit logs when you really, really need them. It’s better to have that historical baseline than learn from this mistake, trust me.
  2. Adopt Unity Catalog. Enabling cross-cloud and cross-workspace analytics brings a new level of governance and control to the Lakehouse.
  3. Automate your logging pipelines- ideally using DLT. This makes sure that you’re enforcing data hygiene and timeliness without needing lots of complex code, and even lets you set up easy notifications and alerts if (and when) something does break or change.
  4. Use a medallion architecture for your log data. This ensures that once your pipelines have brought you high-quality, timely data, it doesn’t get dumped into a database that no one can find – and it becomes really easy to query using Databricks SQL!
  5. Use Databricks SQL to set up automatic alerts for the events that you really care about
  6. Incorporate your Databricks audit logs into your wider logging ecosystem. This might include cloud provider logs, and logs from your identity provider or other third-party applications. Creating a 360-degree view of what’s happening on your Lakehouse is especially relevant in today’s volatile security landscape!

Conclusion

In the two years since our last blog about audit logging, both the Databricks Lakehouse Platform and the world have changed significantly. Most of us have been working remotely during that time, but remote working puts increased pressure and scrutiny on acceptable use policies and how we measure that they’re being followed. Luckily the Databricks Lakehouse Platform has made (and continues to make) huge strides to make this an easier problem for data teams to manage.

The authors of this blog would like to thank the authors of our previous blogs on these topics:

  • Miklos Christine
  • Craig Ng
  • Anna Shrestinian
  • Abhinav Garg
  • Sajith Appukuttan

Standing on the shoulders of giants.

--

Try Databricks for free. Get started today.

The post Monitoring Your Databricks Lakehouse Platform with Audit Logs appeared first on Databricks.

High Scale Geospatial Processing With Mosaic

$
0
0

Breaking through the scale barrier (discussing existing challenges)

At Databricks, we are hyper-focused on supporting users along their data modernization journeys.

A growing number of our customers are reaching out to us for help to simplify and scale their geospatial analytics workloads. Some want us to lay out a fully opinionated data architecture; others have developed custom code and dependencies from which they do not want to divest. Often customers need to make the leap from single node to distributed processing to meet the challenges of scale presented by, for example, new methods of data acquisition or feeding data-hungry machine learning applications.

In cases like this, we frequently see platform users experimenting with existing open source options for processing big geospatial data. These options often have a steep learning curve which can pose challenges unless customers have already developed a familiarity with a given framework’s best practices and patterns for deploying and using. Users struggle to achieve the required performance through their existing geospatial data engineering approach and many want the flexibility to work with the broad ecosystem of spatial libraries and partners.

While design decisions always come with a tradespace, we have listened to and learned from our customers while building a new geospatial library called Mosaic. The purpose of Mosaic is to reduce the friction of scaling and expanding a variety of workloads, as well as serving as a repository for best practice patterns developed during our customer engagements.

At its core, Mosaic is an extension to the Apache Spark™ framework, built for fast and easy processing of very large geospatial datasets. Mosaic provides:

  • A geospatial data engineering approach that uniquely leverages the power of Delta Lake on Databricks, while remaining flexible for use with other libraries and partners
  • High performance through implementation of Spark code generation within the core Mosaic functions
  • Many of the OGC standard spatial SQL (ST_) functions implemented as Spark Expressions for transforming, aggregating and joining spatial datasets
  • Optimizations for performing spatial joins at scale
  • Easy conversion between common spatial data encodings such as WKT, WKB and GeoJSON
  • Constructors to easily generate new geometries from Spark native data types and conversion to JTS Topology Suite (JTS) and Environmental Systems Research Institute (Esri) geometry types
  • The choice among Scala, SQL and Python APIs
Logical design of Mosaic. Mosaic supports both Esri and JTS APIs. Mosaic supports the H3 index system and provides easy KeplerGL utilities for Databricks Notebooks.

Diagram 1: Mosaic Functional Design

Embrace the ecosystem

Our idea for Mosaic is for it to fit between Spark and Delta on one side and the rest of the existing ecosystem on the other side. We envision Mosaic as a library that brings the know-how of integrating geospatial capabilities into systems able to benefit from a high level of parallelism. Popular frameworks such as Apache Sedona or GeoMesa can still be used alongside Mosaic, making it a flexible and powerful option even as an augmentation to existing architectures.

On the other hand, systems designed without additionally required geospatial tools can be migrated onto data architectures with Mosaic, thus leveraging high scalability and performance with minimal effort due to support of multiple languages and a unified APIs. The added value being that since Mosaic naturally sits on top of Lakehouse architecture, it can unlock AI/ML and advanced analytics capabilities of your geospatial data platform.

Mosaic embraces the wider ecosystem and augments 3rd party frameworks. Mosaic implements functionality to support each stage of your Lakehouse from ingestion to visualization.

Diagram 2: Mosaic and the geospatial ecosystem

Finally, solutions like CARTO, GeoServer, MapBox, etc. can remain an integral part of your architecture. Mosaic aims to bring performance and scalability to your design and architecture. Visualization and interactive maps should be delegated to solutions better fit for handling that type of interactions. Our aim is not to reinvent the wheel but rather to address the gaps we have identified in the field and be the missing tile in the mosaic.

Using proven patterns

Mosaic has emerged from an inventory exercise that captured all of the useful field-developed geospatial patterns we have built to solve Databricks customers’ problems. The outputs of this process showed there was significant value to be realized by creating a framework that packages up these patterns and allows customers to employ them directly.

You could even say Mosaic is a mosaic of best practices we have identified in the field.

We had another reason for choosing the name for our framework. The foundation of Mosaic is the technique we discussed in this blog co-written with Ordnance Survey and Microsoft where we chose to represent geometries using an underlying hierarchical spatial index system as a grid, making it feasible to represent complex polygons as both rasters and localized vector representations.

Example of Mosaic using British National Grid. Mosaic decomposes the original geometry into border chips and fully contained indices.

Diagram 3: Mosaic approach for vector geometry representation using BNG

The motivating use case for this approach was initially proven by applying BNG, a grid-based spatial index system for the United Kingdom to partition geometric intersection problems (e.g. point-in-polygon joins). While our first pass of applying this technique yielded very good results and performance for its intended application, the implementation required significant adaptation in order to generalize to a wider set of problems.

This is why in Mosaic we have opted to substitute the H3 spatial index system in place of BNG, with potential for other indexes in the future based on customer demand signals. H3 is a global hierarchical index system mapping regular hexagons to integer ids. By their nature, hexagons provide a number of advantages over other shapes, such as maintaining accuracy and allowing us to leverage the inherent index system structure to compute approximate distances. H3 comes with an API rich enough for replicating the mosaic approach and, as an extra bonus, it integrates natively with the KeplerGL library which can be a huge enabler for rendering spatial content within workflows that involve development within the Databricks notebook environment.

Example of Mosaic using H3 Grid Index. Mosaic decomposes the original geometry into border chips and fully contained indices.

Diagram 4: Mosaic approach for vector geometry representation using H3

Mosaic has been designed to be applied to any hierarchical spatial index system that forms a perfect partitioning of the space. What we refer here to as a perfect partitioning of the space has two requirements:

  1. no overlapping indices at a given resolution
  2. the complete set of indices at a given resolution forms an envelope over observed space

If these two conditions are met we can compute our pseudo-rasterization approach in which, unlike traditional rasterization, the operation is reversible. Mosaic exposes an API that allows several indexing strategies:

  • Index maintained next to geometry as an additional column
  • Index separated within a satellite table
  • Explode original table over the index through geometry chipping or mosaic-ing

Each of these approaches can provide benefits in different situations. We believe that the best tradeoff between performance and ease of use is to explode the original table. While this increases the number of rows in the table, the approach addresses the within-row skew and maximizes opportunity to utilize techniques like Z-Order and Bloom Filters. In addition, due to simpler geometries being stored in each row, all geospatial predicates will run faster because they will operate on simple local geometry representations.

The focus of this blog is on the mosaic approach to indexing strategies that take advantage of Delta Lake. Delta Lake comes with some very useful capabilities when processing big data at high volumes and it helps Spark workloads realize peak performance. Z-Ordering is a very important Delta feature for performing geospatial data engineering and building geospatial information systems. In simple terms, Z ordering organizes data on storage in a manner that maximizes the amount of data that can be skipped when serving queries.

Delta implements an efficient data layout pattern using Z-Order. Z-Order delivers the optimal performance for geospatial workloads.

Diagram 5: Comparison between Z-Order and Linear Order of data in storage.

Geospatial datasets have a unifying feature: they represent concepts that are located in the physical world. By applying an appropriate Z-ordering strategy, we can ensure that data points that are physically collocated will also be collocated on storage. This is advantageous when serving queries with high locality. Many geospatial queries aim to return data relating to a limited local area or co-processing data points that are near to each other instead of the ones that are far apart.

This is where indexing systems like H3 can be very useful. H3 ids on a given resolution have index values close to each other if they are in close real-world proximity. This makes H3 ids a perfect candidate to use with Delta Lake’s Z-ordering.

Making Geospatial on Databricks simple

Today, the sheer amount of data processing required to address business needs is growing exponentially. Two consequences of this are clear – 1) data does not fit into a single machine anymore and 2) organizations are implementing modern data stacks based on key cloud-enabled technologies.

The Lakehouse architecture and supporting technologies such as Spark and Delta are foundational components of the modern data stack, helping immensely in addressing these new challenges in the world of data. However, when it comes to using these tools to run large scale joins with highly complex geometries, this can still be a daunting task for many users.

Mosaic aims to bring simplicity to geospatial processing in Databricks, encompassing concepts that were traditionally supplied by multiple frameworks and were often hidden from the end users, thus generally limiting users’ ability to fully control the system. The aim is to provide a modular system that can fit the changing needs of users, while applying core geospatial data engineering techniques which serve as the baseline for follow-on processing, analysis, and visualization. Mosaic supports runtime representations of geometries using either JTS or Esri types. With simplicity in mind Mosaic brings a unified abstraction for working with both geometry packages and is optimally designed for use with Dataset APIs in Spark. Unification is very important as switching between these two packages (both have their pros and cons and fit better different use cases) shouldn’t be a complex task and it should not affect the way you build your queries.

%python
from mosaic import enable_mosaic
spark.conf.set(
  "spark.databricks.mosaic.geometry.api",
  "JTS"
)
enable_mosaic(spark, dbutils)

left_df.join(
  right_df,
  on=["h3_index"],
  how="inner"
).groupBy(
  key
).count()
Diagram 6: Mosaic query using H3 and JTS
%python
from mosaic import enable_mosaic
spark.conf.set(
  "spark.databricks.mosaic.geometry.api",
  "ESRI"
)
enable_mosaic(spark, dbutils)

left_df.join(
  right_df,
  on=["h3_index"],
  how="inner"
).groupBy(
  key
).count()
Diagram 7: Mosaic query using H3 and Esri

The approach above is intended to allow easy switching between JTS or Esri geometry packages for different tasks, though not to be mixed within the same notebook. We strongly recommend that you use a single Mosaic context within a single notebook and/or single step of your pipelines.

Bringing the indexing patterns together with easy-to-use APIs for geo-related queries and transformations unlocks the full potential of your large scale system by integrating with both Spark and Delta.

%python
df = df.withColumn(
  "index", mosaic_explode(col("shape"))
)
df.write.format("delta").save(location)

%sql
CREATE TABLE table_name 
  USING DELTA
  LOCATION location
 
OPTIMIZE table_name 
  ZORDER BY (index.h3)  
Diagram 8: Mosaic explode in combination with Delta Z-ordering

This pseudo-rasterization approach allows us to quickly switch between high speed joins with accuracy tolerance to high precision joins by simply introducing or excluding a WHERE clause.

%python
# rasterized query
# faster but less precise
left_df.join(
  right_df,
  on=["index.h3"],
  how="inner"
).groupBy(
  key
).count()
Diagram 9: Mosaic query using index only
%python
# detailed query
# slower but more precise
left_df.join(
  right_df,
  on=["index.h3"],
  how="inner"
).where(
  col("is_core") ||
   st_contains(col("chip"), col("point"))
).groupBy(
  key
).count()
Diagram 10: Mosaic query using chip details

Why did we choose this approach? Simplicity has many facets and one that gets often overlooked is the explicit nature of your code. Explicit is almost always better than implicit. Having WHERE clauses determine behavior instead of using configuration values leads to more communicative code and easier interpretation of the code. Furthermore, code behavior remains consistent and reproducible when replicating your code across workspaces and even platforms.

Finally, if your existing solutions leverage H3 capabilities, and you do not wish to restructure your data, Mosaic can still provide substantial value through simplifying your geospatial pipeline. Mosaic comes with a subset of H3 functions supported natively.

%python
df.withColumn(
  "indices", polyfill(col("shape"))
)
Diagram 11: Mosaic query for polyfill of a shape
%python
df.withColumn(
  "index", point_index_geom(col("point"))
)
Diagram 12: Mosaic query for point index

Accelerating pace of innovation

Our main motivation for Mosaic is simplicity and integration within the wider ecosystem; however, that flexibility means little if we do not guarantee performance and computational power. We have evaluated Mosaic against 2 main operations: point in polygon joins and polygon intersection joins. In addition we have evaluated expected performance for the indexing stage. For both use cases we have pre-indexed and stored the data as Delta tables. We have run both operations before using ZORDER optimization and after to highlight the benefits that Delta can bring to your geospatial processing efforts.

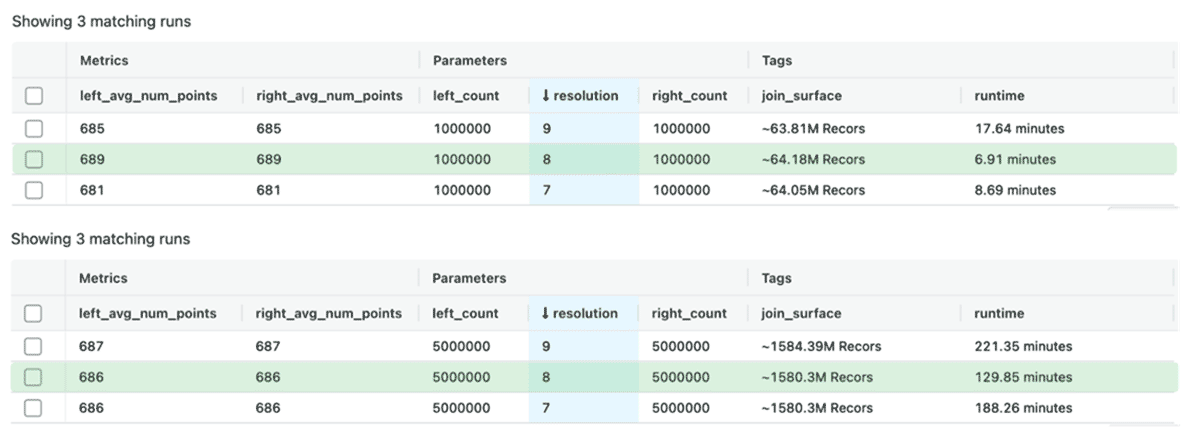
For polygon-to-polygon joins, we have focused on a polygon-intersects-polygon relationship. This relationship returns a boolean indicator that represents the fact of two polygons intersecting or not. We have run this benchmark with H3 resolutions 7,8 and 9, and datasets ranging from 200 thousand polygons to 5 million polygons.

Mosaic polygon intersects polygon benchmarks. Using a 20 node cluster we were able to compute nearly 1.6 Billion intersections between polygons in just over 2 hours.

Diagram 13: Mosaic polygon intersects polygon benchmarks

When we compared runs at resolution 7 and 8, we observed that our joins on average have a better run time with resolution 8. Most notably the largest workload of 5 million polygons joined against 5 million polygons resolution in over 1.5 billion matches ran in just over 2 hours on resolution 8 while it took about 3 hours at resolution 7. Choosing the correct resolution is an important task. If we select a resolution that is too coarse (lower resolution number) we risk of under-representing our geometries which leads to situations where geometrical data skew was not addressed and performance will degrade. If we select resolution that is too detailed (higher resolution number) we risk over-representing our geometries which leads to a high data explosion rate and performance will degrade. Striking the right balance is crucial and in our benchmarks it led to ~30% runtime optimization which highlights how important it is to have an appropriate resolution. The average number of vertices in both our datasets ranges from 680 to 690 nodes per shape – demonstrating that the Mosaic approach can handle complex shapes at high volumes.

When we increased the resolution to 9 we observed a decrease in performance – this is due to over-representation problems – using too many indices per polygon will result in too much time wasted on resolving index matches and will slow down the overall performance. This is why we have added capabilities to Mosaic that will analyze your dataset and indicate to you the distribution of the number indices needed for your polygons.

%python
from mosaic import MosaicAnalyzer

analyzer = MosaicAnalyzer()
optimal_resolution = analyzer.get_optimal_resolution(geoJsonDF, "geometry")
optimal_resolution  
Diagram 14: Determining the optimal resolution in Mosaic

For the full sets of benchmarks please refer to the Mosaic documentation page where we discuss the full range of operations we ran and provide an extensive analysis of the obtained results.

Building an atlas of use cases

With Mosaic we have achieved the balance of performance, expression power and simplicity. And with such balance we have paved the way for building end to end use cases that are modern, scalable, and ready for future Databricks product investments and partnerships across the geospatial ecosystem. We are working with customers across multiple industry verticals and we have identified many applications of Mosaic in the real world domains. Over the next months we will build solution accelerators, tutorials and examples of usage. Mosaic github repository will contain all of this content along with existing and follow-on code releases. You can easily access Mosaic notebook examples using Databricks Repos and kickstart your modern geospatial data platform – stay tuned for more content to come!

Getting started

Try Mosaic on Databricks to accelerate your Geospatial Analytics on Lakehouse today and contact us to learn more about how we assist customers with similar use cases.

  • Mosaic is available as a Databricks Labs repository here.
  • Detailed Mosaic documentation is available here.
  • You can access the latest code examples here.
  • You can access the latest artifacts and binaries following the instructions provided here.

--

Try Databricks for free. Get started today.

The post High Scale Geospatial Processing With Mosaic appeared first on Databricks.

Introduction to Analyzing Crypto Data Using Databricks

$
0
0

The market capitalization of cryptocurrencies increased from $17 billion in 2017 to $2.25 trillion in 2021. That’s over a 13,000% ROI in a short span of 5 years! Even with this growth, cryptocurrencies remain incredibly volatile, with their value being impacted by a multitude of factors: market trends, politics, technology…and Twitter. Yes, that’s right. There have been instances where their prices were impacted on account of tweets by famous personalities.

As part of a data engineering and analytics course at the Harvard Extension School, our group worked on a project to create a cryptocurrency data lake for different data personas – including data engineers, ML practitioners and BI analysts – to analyze trends over time, particularly the impact of social media on the price volatility of a crypto asset, such as Bitcoin (BTC). We leveraged the Databricks Lakehouse Platform to ingest unstructured data from Twitter using the Tweepy library and traditional structured pricing data from Yahoo Finance to create a machine learning prediction model that analyzes the impact of investor sentiment on crypto asset valuation. The aggregated trends and actionable insights are presented on a Databricks SQL dashboard, allowing for easy consumption to relevant stakeholders.

This blog walks through how we built this ML model in just a few weeks by leveraging Databricks and its collaborative notebooks. We would like to thank the Databricks University Alliance program and the extended team for all the support.

Overview

One advantage of cryptocurrency for investors is that it is traded 24/7 and the market data is available round the clock. This makes it easier to analyze the correlation between the Tweets and crypto prices. A high-level architecture of the data and ML pipeline is presented in Figure 1 below.

high-level crypto Delta Lake architecture of the data and ML pipeline

Figure 1: Crypto Lake using Delta

The full orchestration workflow runs a sequence of Databricks notebooks that perform the following tasks:

Data ingestion pipeline

  • Imports the raw data into the Cryptocurrency Delta Lake Bronze tables

Data science

  • Cleans data and applies the Twitter sentiment machine learning model into Silver tables
  • Aggregates the refined Twitter and Yahoo Finance data into an aggregated Gold Table
  • Computes the correlation ML model between price and sentiment

Data analysis

  • Runs updated SQL BI queries on the Gold Table

The Lakehouse paradigm combines key capabilities of Data Lakes and Data Warehouses to enable all kinds of BI and AI use cases. The use of the Lakehouse architecture enabled rapid acceleration of the pipeline creation to just one week. As a team, we played specific roles to mimic different data personas and this paradigm facilitated the seamless handoffs between data engineering, machine learning, and business intelligence roles without requiring data to be moved across systems.

Data/ML pipeline

Ingestion using a Medallion Architecture

The two primary data sources were Twitter and Yahoo Finance. A lookup table was used to hold the crypto tickers and their Twitter hashtags to facilitate the subsequent search for associated tweets.

We used yfinance python library to download historical crypto exchange market data from Yahoo Finance’s API in 15 min intervals. The raw data was stored in a Bronze table containing information such as ticker symbol, datetime, open, close, high, low and volume. We then created a Delta Lake Silver table with additional data, such as the relative change in price of the ticker in that interval. Using Delta Lake made it easy to reprocess the data, as it guarantees atomicity with every operation. It also ensures that schema is enforced and prevents bad data from creeping into the lake.

We used tweepy python library to download Twitter data. We stored the raw tweets in a Delta Lake Bronze table. We removed unnecessary data from the Bronze table and also filtered out non-ASCII characters like emojis. This refined data was stored in a Delta Lake Silver table.

Data science

The data science portion of our project consists of 3 major parts: exploratory data analysis, sentiment model, and correlation model. The objective is to build a sentiment model and use the output of the model to evaluate the correlation between sentiment and the prices of different cryptocurrencies, such as Bitcoin, Ethereum, Coinbase and Binance. In our case, the sentiment model follows a supervised, multi-class classification approach, while the correlation model uses a linear regression model. Lastly, we used MLflow for both models’ lifecycle management, including experimentation, reproducibility, deployment, and a central model registry. MLflow Registry collaboratively manages the full lifecycle of an MLflow Model by offering a centralized model store, set of APIs and UI. Some of its most useful features include model lineage (which MLflow experiment and run produced the model), model versioning, stage transitions (such as from staging to production or archiving), and annotations.

Exploratory data analysis

The EDA section provides insightful visualizations on the dataset. For example, we looked at the distribution of tweet lengths for each sentiment category using violin plots from Seaborn. Word clouds (using matplotlib and wordcloud libraries) for positive and negative tweets were also used to show the most common words for the two sentiment types. Lastly, an interactive topic modeling dashboard was built, using Gensim, to provide insights on the top most common topics in the dataset and the most frequently used words in each topic, as well as how similar the topics are to each other.

Interactive topic modeling dashboard for monitoring cryptocurrency exchange trend data.

Figure 4: Interactive topic modeling dashboard

Sentiment analysis model

Developing a proper sentiment analysis model has been one of the core tasks within the project. In our case, the goal of this model was to classify the polarities that are expressed in raw tweets as input using a mere polar view of sentiment, (i.e., tweets were categorized as “positive”, “neutral” or “negative”). Since sentiment analysis is a problem of great practical relevance, it is no surprise that multiple ML strategies related to it can be found in literature:

Sentiment lexicons algorithms Off-the-shelf sentiment analysis systems
Compare each word in a tweet to a database of words that are labeled as having positive or negative sentiment.
A tweet with more positive words than negative would be scored as a positive and vice versa

Pros: straightforward approach. Cons: performs poorly in general and greatly depends on the quality of the database of words.
Exemplary systems: Amazon Comprehend, Google Cloud Services, Stanford Core NLP

Pros: do not require great pre-processing of the data and allow the user to directly start a prediction “out of the box”
Cons: limited fine-tuning for the underlying use-case (re-training might be needed to adjust the model performance)
Classical ML algorithms Deep Learning (DL) algorithms
Application of traditional supervised classifiers like Logistic Regression, Random Forest, Support Vector Machine or Naive Bayes

Pros: well-known, often financially and computationally cheap, easy to interpret
Cons: in general, performance on unstructured data like text is expected to be worse compared to structured data and necessary pre-processing can be extensive
Application of NLP related neural network architectures like BERT, GPT-2 / GPT-3 mainly via transfer learning

Pros: many pre-trained neural networks for word embeddings and sentiment prediction already exist (particularly helpful for transfer learning), DL models scale effectively with data
Cons: difficult and computationally expensive to tune architecture and hyperparameters

In this project, we focused on the latter two approaches since they are supposed to be the most promising. Thereby, we used SparkNLP as the NLP library of choice due to its extensive functionality, its scalability (fully supported by Apache Spark™) and accuracy (e.g., it contains multiple state-of-the-art embeddings and allows users to make use of transfer learning). First, we built a sentiment analysis pipeline using the aforementioned classical ML algorithms. The following figure shows its high-level architecture consisting of three parts: pre-processing, feature vectorization and finally training including hyperparameter tuning.

Example machine learning model pipeline used for training cryptocurrency analysis models.

Figure 5: Machine learning model pipeline

We run this pipeline for every classifier and compare their corresponding accuracies on the test set. As a result, the Support Vector Classifier achieved the highest accuracy with 75.7% closely followed by Logistic Regression (75.6%), Naïve Bayes (74%) and finally Random Forest (71.9%). To improve the performance, other supervised classifiers like XGBoost or GradientBoostedTrees could be tested. Besides, the individual algorithms could be combined to an ensemble, which is then used for prediction (e.g. majority voting, stacking).

In addition to this first pipeline, we developed a second Spark pipeline with a similar architecture making use of the rich SparkNLP functionalities regarding pre-trained word embeddings and DL models. Starting with the standard Document Assembler annotator, we only used a Normalizer annotator to remove twitter handles, alphanumeric characters, hyperlinks, html tags and timestamps but no further pre-processing related annotators. In terms of the training stage, we used a pre-trained (on the well-known IMDb dataset) sentiment DL model provided by SparkNLP. Using the default hyperparameter settings, we already achieved a test set accuracy of 83%, which could potentially be even enhanced using other pre-trained word embeddings or sentiment DL models. Thus, the DL strategy clearly outperformed the pipeline in Figure 5 with the Support Vector Classifier by around 7.4 percent points.

Correlation model

The project requirement included a correlation model on sentiment and price; therefore, we built a linear regression model using scikit-learn and mlflow.sklearn for this task.

We quantified the sentiment by assigning negative tweets a score of -1, neutral tweets a score of 0, and positive tweets a score of 1. The total sentiment score for each cryptocurrency is then calculated by adding up the scores for each cryptocurrency in 15-minute intervals. The linear regression model is built using the total sentiment score in each window for all companies to predict the % change in cryptocurrency prices. However, the model shows no clear linear relationship between sentiment and change in price. A possible future improvement for the correlation model is using sentiment polarity to predict the change in price instead.

Correlation model pipeline

Figure 6: Correlation model pipeline

Business intelligence

Understanding stock correlation models was a key component of generating buy/sell predictions, but communicating results and interacting with the information is equally critical to make well-informed decisions. The market is so dynamic, so a real-time visualization is required to aggregate and organize trending information. Databricks Lakehouse enabled all of the BI analyst tasks to be coordinated in one place with streamlined access to the Lakehouse data tables. First, a set of SQL queries were generated to extract and aggregate information from the Lakehouse. Then the data tables were easily imported with a GUI tool to rapidly create dashboard views. In addition to the dashboards, alert triggers were created to notify users of critical activities like stock movement up/down by > X%, increases in Twitter activity about a particular crypto hashtag or changes in overall positive/negative sentiment about each cryptocurrency.

Dashboard generation

The business intelligence dashboards were created using Databricks SQL. This system provides a full ecosystem to generate SQL queries, create data views and charts, and ultimately organizes all of the information using Databricks Dashboards.

The use of the SQL Editor in Databricks was key to making the process fast and simple. For each query, the editor GUI enables the selection of different views of the data including tables, charts, and summary statistics to immediately see the output. From there, views could be imported directly into the dashboards. This eliminated redundancy by utilizing the same query for different visualizations.

Visualization

For the topic of Twitter sentiment analysis, there are three key views to help users interact with the data on a deeper level.

View 1: Overview Page, taking a high-level view of Twitter influencers, stock movement, and frequency of tweets related to particular cryptos.

Overview Dashboard View with Top Level Statistics of cryptocurrency trend data.

Figure 7: Overview Dashboard View with Top Level Statistics

View 2: Sentiment Analysis, to understand whether each tweet is positive, negative, or neutral. Here you can easily visualize which cryptocurrencies are receiving the most attention in a given time window.

Sentiment Analysis dashboard -- to easily visualize which cryptocurrencies are receiving the most attention in a given time window.

Figure 8: Sentiment Analysis Dashboard

View 3: Stock Volatility to provide the user with more specific information about the price for each cryptocurrency with trends over time.

Stock Ticker dashboard -- to provide the user with more specific information about the price for each cryptocurrency with trends over time.

Figure 9: Stock Ticker Dashboard

Summary

Our team of data engineers, data scientists, and BI analysts was able to leverage the Databricks tools to investigate the complex issue of Twitter usage and cryptocurrency stock movement. The Lakehouse design created a robust data environment with smooth ingestion, processing, and retrieval by the whole team. The data collection and cleaning pipelines deployed using Delta tables were easily managed even at high update frequencies. The data was analyzed by a natural language sentiment model and a stock correlation model using MLflow, which made the organization of various model versions simple. Powerful analytics dashboards were created to view and interpret the results using built-in SQL and Dashboard features. The functionality of Databricks’ end-to-end product tools removed significant technical barriers, which enabled the entire project to be completed in less than 4 weeks with minimal challenges. This approach could easily be applied to other technologies where streamlined data pipelines, machine learning, and BI analytics can be the catalyst for a deeper understanding of your data.

Our findings

These are additional conclusions from the data analysis to highlight the extent of Twitter users’ influence on the price of cryptocurrencies.

Volume of tweets correlated with volatility in cryptocurrency price
There is a clear
correlation in periods of high tweet frequency to the movement of a cryptocurrency. Note this happens before and after a stock price change, indicating some tweet frenzies precede price change and are likely influencing value, and others are in response to big shifts in price.

Twitter users with more followers don’t actually have more influence on crypto stock price
This is often discussed in media events, particularly with lesser-known currencies. Some extreme influencers like Elon Musk gained a reputation for being able to drive enormous market swings with a small number of targeted tweets. While it is true that a single tweet can impact cryptocurrency price, there is not an underlying correlation between number of followers to movement of the currency price. There is also a slightly negative correlation to number of retweets vs. price movement, indicating the twitter activity by influencers might have broader reach as it moves into other mediums like new articles rather than reaching directly to investors.

Databricks platform was incredibly useful for solving complex problems like merging Twitter and stock data.
Overall, the use of Databricks to coordinate the pipeline from data ingestions, the Lakehouse data structure, and the BI reporting dashboards was hugely beneficial to completing this project efficiently. In a short period of time, the team was able to build the data pipeline, complete machine learning models, and produce high-quality visualizations to communicate results. The infrastructure provided by the Databricks platform removed many of the technical challenges and enabled the project to be successful.

While this tool will not enable you to outwit the cryptocurrency markets, we strongly believe it will predict periods of increased volatility which can be advantageous for specific investing conditions.

Disclaimer: This article takes no responsibility for financial investment decisions. Nothing contained in this website should be construed as investment advice.

Try notebooks

Please try out the referenced Databricks Notebooks

--

Try Databricks for free. Get started today.

The post Introduction to Analyzing Crypto Data Using Databricks appeared first on Databricks.

What to Expect At Data + AI Summit: Open source, technical keynotes and more!

$
0
0

Data + AI Summit, the world’s largest data and AI conference, returns June 27-30 2022, and we’re thrilled to say that this year, you can attend it in person in San Francisco (or online for FREE from anywhere in the world). Registration is now open, and we look forward to welcoming you. We have compiled a list of highlights below to get a sneak peek. Enjoy!

Lakehouse: Foundation of the modern data architecture

We are seeing a new era of data architecture being adopted by data practitioners. It’s multicloud, multi-format, polyglot — not restrictive or siloed…and the foundation is the lakehouse.

Data + AI Summit is where data professionals come together to collaborate and discuss the modern data architecture and trends that addresses all data, analytics, and AI use cases. Through these sessions, we will learn about this new generation of Open Platforms that unifies Data Warehousing, Data Engineering and Artificial Intelligence.  Attendees will include practitioners,  partners and thought leaders from the open-source community, united by a common purpose: to build innovative data systems and solutions capable of solving the toughest data problems. Move your data beyond the complexity and compromise of silos, proprietary formats, vendor lock-in and disconnected data teams.

Who and What can you expect at Data + AI Summit 2022?

Data + AI Summit brings together nearly  100,000 data and AI experts, leaders and visionaries, and this year is no exception. Spanning four days, we have a packed agenda of technical sessions, keynote talks, training workshops and demos.

Visionary guest speakers include well-known personalities in the Data and AI space:

  • Andrew Ng: Founder & CEO of Landing AI and Founder of DeepLearning.AI. A man who is wowed and prayed for his ML courses by so many educationists.
  • Zhamak Dehghani, Creator of the Data Mesh, published author on O’Reilly and a contributor of various patents in distributed computing communications and embedded device technologies.
  • Peter Norvig: Author of the best-selling textbook, Artificial Intelligence: A Modern Approach and NASA’s Ex-chief computer scientist. Did you know, he is known for penning the world’s longest palindromic sentence?
  • Hilary Mason: Co-founder & CEO, Hidden Door. She is building a new way for kids and families to create stories with AI. Previously founded Fast Forward Labs, acquired by Cloudera in 2017.
  • Christopher Manning, Director, Stanford Artificial Intelligence Lab (SAIL). He is a leader in applying Deep Learning to Natural Language Processing, and a well-known researcher in NLP.
  • Daphne Koller, CEO & Founder, insitro (ML-enabled drug discovery company)  and Co-founder of Coursera. She was a Stanford University professor and received many Accolades in Science and AI – the list is too long to fit here!
  • Tristan Handy, CEO & Founder, dbt Labs, is building the modern analytics workflow used and loved by tens of thousands of data analysts.

In addition, you’ll hear from Databricks founders and executives, including Ali Ghodsi, Reynold Xin, and Matei Zaharia, on how the evolution of the modern cloud data stack has embraced open source and architectural simplification.

Also on the agenda is a series of dedicated industry forums and tracks featuring the most innovative brands across the biggest industries such as Healthcare, Retail, Financial Services, Public Sector, Manufacturing, and Entertainment. Stay tuned for deeper dives into these industry-specific tracks.

Level up your knowledge of open-source technologies

Leading experts will present an extensive program of highly technical content – plus a full slate of free and paid hands-on training workshops covering all things Lakehouse – from the Databricks Lakehouse Platform to Apache Spark™ programming to managing ML models.

Breakout sessions will cover open-source technologies and topics such as:

  • Best practices and use cases for Apache Spark™, Delta Lake, MLflow, PyTorch, TensorFlow, dbt™ and more
  • Data engineering for scale, including streaming architectures
  • Advanced SQL analytics and BI using data warehouses and data lakes
  • Data science, including the Python ecosystem
  • Machine learning and deep learning applications, MLOps

You’ll also have the opportunity to get certified with new certification bundles that include one or two-day courses with an exam. See the full training schedule here, and book to secure your place. Bonus: This year, we also have great networking events planned, including a Developer lounge, Contributor Meetup and University Alliance Meetup. Don’t delay, as places fill up fast!

Join the global data community – sign up today

If you haven’t already signed up for Data + AI Summit, register to join the global data community. You can find the full agenda here. See you there!

--

Try Databricks for free. Get started today.

The post What to Expect At Data + AI Summit: Open source, technical keynotes and more! appeared first on Databricks.


Why CEOs Choose Databricks

$
0
0

“This initiative to modernize our data infrastructure, which includes a multi-year agreement with Databricks to unlock data at scale, will further enhance our analytical capabilities and deliver richer insights – driving better customer experiences and enabling colleagues to collaborate with more agility across the Bank.” – Bharat Masrani, CEO of TD Bank 3/3/22

“We also recently launched Marketplace Workbench in partnership with Databricks, allowing clients access to a modern cloud-based platform for big data testing and analysis…Congratulations to all those involved in creating a site that uses unique technology to simplify our clients’ ability to identify, access, evaluate and utilize unique data and solutions.” – Doug Peterson, CEO of S&P Global 7/29/21

A decade ago, Capital and Scale were arguably the two most critical assets that allowed CEOs to compete. Capital, in simple terms, represents the ability of a company to not only fund day-to-day operations but to fund its future growth. Scale is what is afforded by the capital. It represents the tangible and intangible assets a company obtains through those investments (factories, stores, salespeople, etc). The interplay between these two assets helped to secure competitive advantage and to define a generation of successful companies.

Today, Capital and Scale alone don’t cut it. Innovative and category-winning companies are built by adding Data and People to the equation. Data is the fuel that powers innovation: new products and services, better customer and partner relationships, and ultimately, higher share prices. People represent the employees, both technical and non-technical, that are enabled to fully harness the power of the data at a company’s disposal. If Capital and Scale are the bedrock of companies, Data and People are modern materials and talent that CEOs need to take their companies to new heights.

The downside? Traditional data architectures weren’t built to support these evolving needs and assets. Even in my own conversations with executives across the globe, it’s become clear that even the most resource-rich companies can’t obtain competitive advantage if they’re relying on last decade’s technology. Those that do find themselves drowning in unreliable data, disjointed “tacked on” architecture, and complex solutions that further silo data teams.

Choosing a technology platform that unifies Data and People – across all organizations – becomes one of the most important strategic decisions CEOs must make. At its core, the right technology must democratize data across the organization and empower people to make smarter decisions. This modern Data + AI platform must fully support the major “data megatrends” that are shaping the enterprise landscape:

  1. Data Explosion: In all aspects of the 5 Vs (volume, value, variety, velocity, and veracity), data is growing at an unprecedented pace. Scale isn’t just a buzzword – your data stack must support massive amounts of unstructured and structured data and make it reliable and accessible to the right teams.
  2. AI is no longer “nice to have.” AI capabilities must be seamlessly incorporated into products and services. This means data-driven insights that are predictive and not merely descriptive. For example, would you still take an Uber if your information was merely limited to where your driver currently is and if the app couldn’t predict your fare or time of arrival? Productizing AI into your everyday products and services is the new bedrock of a successful business.
  3. Multi-cloud is here. Cloud is table stakes. Now, it’s about developing a multi-cloud strategy that enables interoperability between clouds for both resilience and risk management. Multi-cloud gives companies negotiating leverage with cloud vendors as well as strategic optionality for acquisitive CEOs that must quickly execute technology integration after M&A.
  4. The future is open. Vendor lock-in and proprietary data formats slow down innovation. Let’s face it – a single company cannot out-innovate a global community of innovators. Even the most regulated industries are realizing that open source is the best way to foster innovation, recruit and retain the best talent, and future-proof a technology platform.

These trends are just the surface of where the industry is headed. The uncomfortable reality is, any long-established incumbent can be out-competed if they’re using the wrong technology platform. And we’re already seeing this today– look at what Tesla did to the automobile industry.

Databricks is designed to support the data needs of today (and tomorrow), and do so cost-effectively and with high performance. Here’s how the Databricks Lakehouse Platform addresses the challenges listed above:

Infinitely scalable and cost-effective.

The Databricks Lakehouse works off of data stored in cheap and scalable cloud data storage provided by the three major cloud vendors. This means Databricks can handle all types of data (structured, semi-structured and unstructured). It can also handle everything from AI to BI. In simple terms, Databricks can be your data lake as well as your data warehouse. In addition, the hyper-optimized Databricks engine brings massive computing power to your data, enabling faster computations that lead to cost savings over cloud data warehouses and over native tools provided by the cloud vendors. Databricks operates under a consumption model. In other words, your costs are tied to usage and value from the platform. If you’re not getting value from Databricks, you’re not paying us. For a CEO, scalability and cost-effectiveness can mean higher margins, ROEs, and transparency on the benefits of technology spend.

Get to AI faster.

Delivering AI at enterprise scale is hard. The Databricks Lakehouse makes that easier by bringing all your data together with all the personas that use data on one platform. This means Databricks is secure because you now have one governance model and one security model for your data science, data engineering and AI use-cases. The collaboration features and optimized software for managing machine learning life cycle within Databricks means you can get the most out of your data and people for all business use-cases. AI means going from using data to measure your business to using data to impact it. For a CEO, AI can mean higher NPS scores (happier customers) and higher growth.

Databricks is multi-cloud.

Databricks is not only available on Google, Azure and AWS but it is the first software company in history (to our knowledge) that has received investment from all three cloud vendors. This means a seamless experience across clouds but also that the models and Intellectual Property (IP) built by your teams within Databricks are portable across clouds. Data sharing capabilities inherent within Databricks means you can now share any data asset across any cloud or any tool or any system in an auditable and governed way. For a CEO, multi-cloud can mean superior business resilience, business continuity and negotiating power.

Databricks is Open.

The open-source technologies that underpin Databricks such as Delta Lake, MLflow and Apache Spark are downloaded more than 30 million times a month around the world. This means there is a rich ecosystem of innovation to leverage as well as a rich pool of talent that knows how to leverage the technology. Your data stays in your own cloud accounts in an open format. This means there is no vendor lock-in. On the other hand, if you go with a cloud data warehouse vendor, they will take your data and put it in their proprietary formats. For a CEO, open means attracting and retaining the best and brightest tech talent that want to work on the latest open-source tools.

Databricks bring together your Data and People on one secure, open, and build-for-cloud platform. The Lakehouse architecture vastly simplifies your data architectures and gives you the tools to win against the competition and also to attract and retain the best technology talent to your organization. We prevent vendor lock-in because we never put your data into proprietary vendor-specific formats. That’s why over 6,000 customers including over 40% of the Fortune 500 rely on Databricks. Simply put, we make it easier for CEOs to make the right technology decisions to unleash the power of your data and your people and to set your organization to win the race to AI.

Learn more about Databricks Lakehouse for Financial Services at databricks.co/fiserv or read the recent Databricks Symposium highlights.

--

Try Databricks for free. Get started today.

The post Why CEOs Choose Databricks appeared first on Databricks.

How Audantic Uses Databricks Delta Live Tables to Increase Productivity for Real Estate Market Segments

$
0
0

This is a collaborative post from Audantic and Databricks. We’d like to thank co-author Joel Lowery, Chief Information Officer – Audantic, for his contribution.

 
At Audantic we provide data and analytics solutions for niche market segments inside of single family residential real estate. We make use of real estate data to construct machine learning models to rank, optimize, and provide revenue intelligence to our customers to make strategic data-driven real estate investment decisions in real time.

We utilize a variety of datasets, including real estate tax and recorder data as well as demographics to name a couple. To build our predictive models requires massive datasets, many of which are hundreds of columns wide and into the hundreds of millions of records, even before accounting for a time dimension.

To support our data-driven initiatives, we had ‘stitched’ together various services for ETL, orchestration, ML leveraging AWS, Airflow, where we saw some success but quickly turned into an overly complex system that took nearly five times as long to develop compared to the new solution. Our team captured high-level metrics comparing our previous implementation and current lakehouse solution. As you can see from the table below, we spent months developing our previous solution and had to write approximately 3 times as much code. Furthermore, we were able to achieve a 73% reduction in the time it took our pipeline to run as well as saving 21% on the cost of the run.

Previous Implementation New Lakehouse Solution Improvement
Development time 6 months 25 days 86% reduction in development time
Lines of code ~ 6000 ~ 2000 66% fewer lines of code

In this blog, I’ll walk through our previous implementation, and discuss our current lakehouse solution. Our intent is to show you how our data teams reduced complexity, increased productivity, and improved agility using the Databricks Lakehouse Platform.

Previous implementation

Our previous architecture included multiple services from AWS as well as other components to achieve the functionality we desired, including a Python module, Airflow, EMR, S3, Glue, Athena, etc. Below is a simplified architecture:

 Data analytics architecture used by Audantic prior to implementing the Databricks Lakehouse for the real estate industry.

To summarize briefly, the process was as follows:

  1. We leveraged Airflow for orchestrating our DAGs.
  2. Built custom code to send email and Slack notifications via Airflow.
  3. The transformation code was compiled and pushed to S3.
  4. Created scripts to launch EMR with appropriate Apache Spark™ settings, cluster settings, and job arguments.
  5. Airflow to orchestrate jobs with the code pushed to S3.
  6. Table schemas were added with Glue and table partition management was done using SQL commands via Athena.

With the complexity of our previous implementation, we faced many challenges that slowed our forward progress and innovation, including:

  • Managing failures and error scenarios
    • Tasks had to be written in such a way to support easy restart on failures, otherwise  manual intervention would be needed.
    • Needed to add custom data quality and error tracking mechanisms increasing maintenance overhead.
  • Complex DevOps 
    • Had to manage Airflow instances and access to the hosts.
    • Had many different tools and complex logic to connect them in the Airflow DAGs.
  • Manual maintenance and tuning
    • Had to manage and tune (and automate this with custom code to the extent possible) Spark settings, cluster settings, and environment.
    • Had to manage output file sizes to avoid too many tiny files or overly large files for every job (using parquet).
    • Needed to either do full refreshes of data or compute which partitions needed to be executed for incremental updates and then needed to adjust cluster and Spark settings based on number of data partitions being used.
    • Changes in the schemas of source datasets required manual changes to the code since input datasets were CSV files or similar with custom code including a schema for each dataset.
    • Built logging into the Airflow tasks, but still needed to look through logs in various places (Airflow, EMR, S3, etc.).
  • Lack of visibility into data lineage
    • Dependencies between datasets in different jobs were complex and not easy to determine, especially when the datasets were in different DAGs.

Current implementation: Scalable data lakehouse using Databricks

We selected the Databricks Lakehouse Platform because we had been impressed by the ease of managing environments, clusters, and files/data; the joy and effectiveness of real-time, collaborative editing in Databricks notebooks; and the openness and flexibility of the platform without sacrificing reliability and quality (e.g. built around their open-sourced Delta Lake format which prevented us from being locked-in to a proprietary format or stack). We saw DLT as going another step to remove even more of the challenges presented by the prior implementation. Our team was particularly excited by the ease and speed of ingesting raw data stored on S3, supporting schema evolution, defining expectations for validation and monitoring of data quality, and managing data dependencies.

Delta Live Tables (DLT) made it easy for Audantic to build and manage reliable data pipelines that deliver high-quality data on Delta Lake

Benefits of Delta Live Tables

Delta Live Tables (DLT) made it easy to build and manage reliable data pipelines that deliver high-quality data on Delta Lake. DLT improved developer productivity by 380%, helping us deliver high quality datasets for ML and data analysis , much more quickly.

By using Delta Live Tables, we have seen a number of benefits including:

  • Stream processing
    • Built-in support for streaming with option to full refresh when needed
  • Simpler DevOps
    • Our team didn’t need to manage servers, since DLT managed the entire processing infrastructure .
    • The administrators were able to easily manage Databricks users
    • Smaller number of tools that functioned together more smoothly.
      • For example:
        • New implementation: tables created by DLT were immediately accessible with DB SQL.
        • Previous implementation: table schema created with Glue and then new partitions added with Athena in addition to the underlying data created/added by a Spark job.
  • Streamlined maintenance and performance tuning
    • Best practice by default with Spark and cluster settings in DLT.
    • File size managed with auto-optimize and vacuum.
    • Easy viewing of status, counts, and logs in DLT.
  • Automatic data lineage
    • DLT maintains data dependencies and makes lineage easy to view from the data source to the destination.
  • Improved data quality
    • Built-in data quality management with the ability to specify data quality expectations provides logging and option to ignore/drop/quarantine — our previous implementation required separate, custom Airflow tasks and sometimes human intervention to manage data quality.

Working with Databricks SQL

Using Databricks SQL, we were able to provide analysts a SQL interface to directly consume data from the lakehouse removing the need to export data to some other tool for analytical consumption. It also provided us with enhanced monitoring into our daily pipelines via Slack notifications of success and failures.

Ingesting files with Auto Loader

Databricks Auto Loader can automatically ingest files on cloud storage into Delta Lake. It allows us to take advantage of the bookkeeping and fault-tolerant behavior built into Structured Streaming, while keeping the cost down close to batching.

Conclusion

We built a resilient, scalable data lakehouse on the Databricks Lakehouse Platform using Delta Lake, Delta Live Tables, Databricks SQL and Auto Loader. We were able to significantly reduce operational overhead by removing the need to maintain Airflow instances, manage Spark parameter tuning, and control dependency management.

Additionally, using Databricks’ technologies that innately work together instead of stitching together many different technologies to cover the functionality we needed resulted in a significant simplification. The reduction of operational overhead and complexity helped significantly accelerate our development life cycle and has already begun to lead to improvements in our business logic. In summary, our small team was able to leverage DLT to deliver high-value work in less time.

Future work

We have upcoming projects to transition our machine learning models to the lakehouse and improve our complex data science processes, like entity resolution. We are excited to empower other teams in our organization with understanding of and access to the data available in the new lakehouse. Databricks products like Feature Store, AutoML, Databricks SQL, Unity Catalog, and more will enable Audantic to continue to accelerate this transformation.

Next steps

Check out some of our resources for getting started with Delta Live Table

--

Try Databricks for free. Get started today.

The post How Audantic Uses Databricks Delta Live Tables to Increase Productivity for Real Estate Market Segments appeared first on Databricks.

Streaming Windows Event Logs into the Cybersecurity Lakehouse

$
0
0

Streaming windows events into the Cybersecurity Lakehouse

Enterprise customers often ask, what is the easiest and simplest way to send Windows endpoint logs into Databricks in real time, perform ETL and run detection searches for security events against the data. This makes sense. Windows logs in large environments must be monitored but can be very noisy and consume considerable resources in traditional SIEM products. Ingesting system event logs into Delta tables and performing streaming analytics has many cost and performance benefits.

This blog focuses on how organizations can collect Windows event logs from endpoints, directly into a cybersecurity lakehouse. Specifically, we will demonstrate how to create a pipeline for Microsoft sysmon process events, and transform the data into a common information model (CIM) format that can be used for downstream analytics.

“How can we ingest and hunt windows endpoints at scale, whilst also maintaining our current security architecture?”


Curious Databricks Customer

Proposed architecture

For all practical purposes, Windows endpoint logs must be shipped via a forwarder into a central repository for analysis. There are many vendor-specific executables to do this, so we have focused on the most universally applicable architecture available to everyone, using winlogbeats and a Kafka cluster. The elastic winlogbeats forwarder has both free and open source licensing, and Apache Kafka is also an open-source distributed event streaming platform. You can find a sample configuration file for both in the notebook or create your own specific configuration for Windows events using the winlogbeats manual. If you want to use a Kafka server for testing purposes, I created a github repository to make it easy. You may need to make adjustments to this architecture if you use other software.

The architecture sends windows event logs using winlogbeats kafka output, and is ingested directly by the delta lake kafka connector, subscribed to the winlogbeat topic

The data set

We have also installed Microsoft system monitor (sysmon) due to its effectiveness for targeted collection used for security use cases. We will demonstrate how to parse the raw JSON logs from the sysmon/operational log and apply a common information model to the most relevant events. Once run, the notebook will produce silver level Delta Lake tables for the following events.
As part of the Databricks Windows Event Log Data Stream solution, you can use a notebook to produce silver level Delta Lake tables for the respective events.
Using the winlogbeats configuration file in the notebook, endpoints will also send WinEventLog:Security, WinEventLog:System, WinEventLog:Application, Windows Powershell and WinEventLog:WMI log files, which can also be used by the interested reader.

Ingesting the data set through Kafka

You may be forgiven for thinking that getting data out of Kafka and into Delta Lake is a complicated business! However, it could not be simpler. With Apache Spark™, the Kafka connector is ready to go and can stream data directly into Delta Lake using Spark Streaming.

kafka_df = (spark.readStream
          .format("kafka")
          .option("kafka.bootstrap.servers", "xx.xx.xx.xx:9094")
          .option("subscribe", "winlogbeat")
          .option("startingOffsets", "latest")
          .option("failOnDataLoss", "false")
          .load()
          )

Tell spark.readStream to use the apache spark Kafka connector, located at
kafka.bootstrap.servers
ip address. subscribe to the topic that the windows events arrive on, and you are off to the races!

For readability, we’ll show only the most prevalent parts of the code, however, the full notebook can be downloaded using the link at the bottom of the article, including a link to a free community edition of Databricks if required.

winlogbeatDF, winlogbeatSchema = read_kafka_topic(bootstrapServers=bootstrapServerAddr, port="9094", topic="winlogbeat")
if type(winlogbeatDF) == DataFrame:
    winlogbeatDF = add_ingest_meta(winlogbeatDF)
    winlogbeatDF = parser_kafka_winlogbeat(winlogbeatDF, stage='raw')
    display(winlogbeatDF)
else:
    print(winlogbeatDF, winlogbeatSchema)

Using the code above we read the raw Kafka stream using the read_kafka_topic function, and apply some top level extractions, primarily used to partition the bronze level table.
The raw data frame augmented with metadata and first level columns extracted

This is a great start. Our endpoint is streaming logs in real time to our Kafka cluster and into a Databricks dataframe. However, it appears we have some more work to do before that dataframe is ready for analytics!

Taking a closer look, the event_data field is nested in a struct, and looks like a complex json problem.

the winlog event_data is still nested in complex json

Before we start work transforming columns, we write the data frame into the bronze level table, partitioned by _event_date, and _sourcetype. Choosing these partition columns will allow us to efficiently read only the log source we need when filtering for events to apply our CIM transformations on.

partitions = ["_event_date", "_sourcetype"]
write_table(df=winlogbeatDF, tableName='winlogbeat_kafka_bronze', table='bronze', partitions=partitions, streamType=streamMode)

bronzeWinlogbeatDF = read_table('winlogbeat_kafka_bronze').cache()
bronzeWinlogbeatDF = parser_kafka_winlogbeat(bronzeWinlogbeatDF)

sysmonProcessDF = bronzeWinlogbeatDF.filter((bronzeWinlogbeatDF._sourcetype == 'Microsoft-Windows-Sysmon/Operational') 
                  & ( (col("winlog:event_id") == '1') 
                  | (col("winlog:event_id") == '5') 
                  | (col("winlog:event_id") == '18') ))

The resulting data frame after column flattening and message column parsing

The above data frame is the result of reading back the bronze table, flattening the columns and filtering for only process related events (process start, process end and pipe connected).

With the flattened column structure and a filtered data frame consisting of process related events, the final stage is to apply a data dictionary to normalize the field names. For this, we use the OSSEM project naming format, and apply a function that takes the input dataframe, and a transformation list, and returns the final normalized dataframe.

transform_cols = [
    {"new":["event_message","EXPR=case when (event_id = 1) then 'Process Started' when             (event_id = 5) then 'Process Terminated' when (event_id = 18) then 'Pipe Connected' end"]},
    {"new":["event_message_result","LITERAL=success"]},
    {"rename":["event:action","event_status"]},
    {"rename":["winlog:event_data:CommandLine","process_command_line"]},
    {"rename":["winlog:event_data:Company","file_company"]},
    {"rename":["winlog:event_data:CurrentDirectory","process_file_directory"]},
    {"rename":["dvc_hostname","dvc_hostname"]},
    {"rename":["winlog:event_id","event_id"]},
    {"rename":["winlog:task","event_category_type"]},
 	.
	.
    {"rename":["winlog:event_data:Hashes","file_hashes"]},
    {"rename":["winlog:event_data:PipeName","pipe_name"]}
]
sysmonProcess = cim_dataframe(sysmonProcessDF, transform_cols)

partition_cols = ["_event_date"]
write_table(df=sysmonProcess,partitions=partition_cols, tableName='Process', table='silver', streamType=streamMode)

display(sysmonProcess)

The silver CIM compliant process data frame is ready for normalized queries

The resulting data frame has been normalized to be CIM compliant and has been written to a silver table, partitioned by _event_date. Silver level tables are considered suitable for running detection rules against. et-voila!

Optionally, a good next step to increase the performance of the silver table, would be to z-order it based on the columns most likely used for filtering on. The columns process_name and event_id would be good candidates. Similarly applying a bloom filter based on the user_name column would speed up read activity when doing entity based searches. An example below.

if optimizeInline:
    create_bloom_filter(tableName='Process', columns=bloom_cols)
    optimize_table(tableName='Process', columns=z_order_cols)

Conclusion

We have seen how to create a scalable streaming pipeline from enterprise endpoints that contains complex structures, directly into the lakehouse. This offers two major benefits. Firstly, the opportunity for targeted but often noisy data that can be analyzed downstream using detection rules, or AI for threat detection. Secondly the ability to maintain granular levels of historic endpoint data using Delta tables in cost effective storage, for long term retention and look backs if and when required.

Look out for future blogs, where we will dive deeper into some analytics using these data sets. Download the full notebook and a preconfigured Kafka server to get started streaming Windows endpoint data into the lakehouse today! If you are not already a Databricks customer, feel free to spin up a Community Edition from here too.

--

Try Databricks for free. Get started today.

The post Streaming Windows Event Logs into the Cybersecurity Lakehouse appeared first on Databricks.
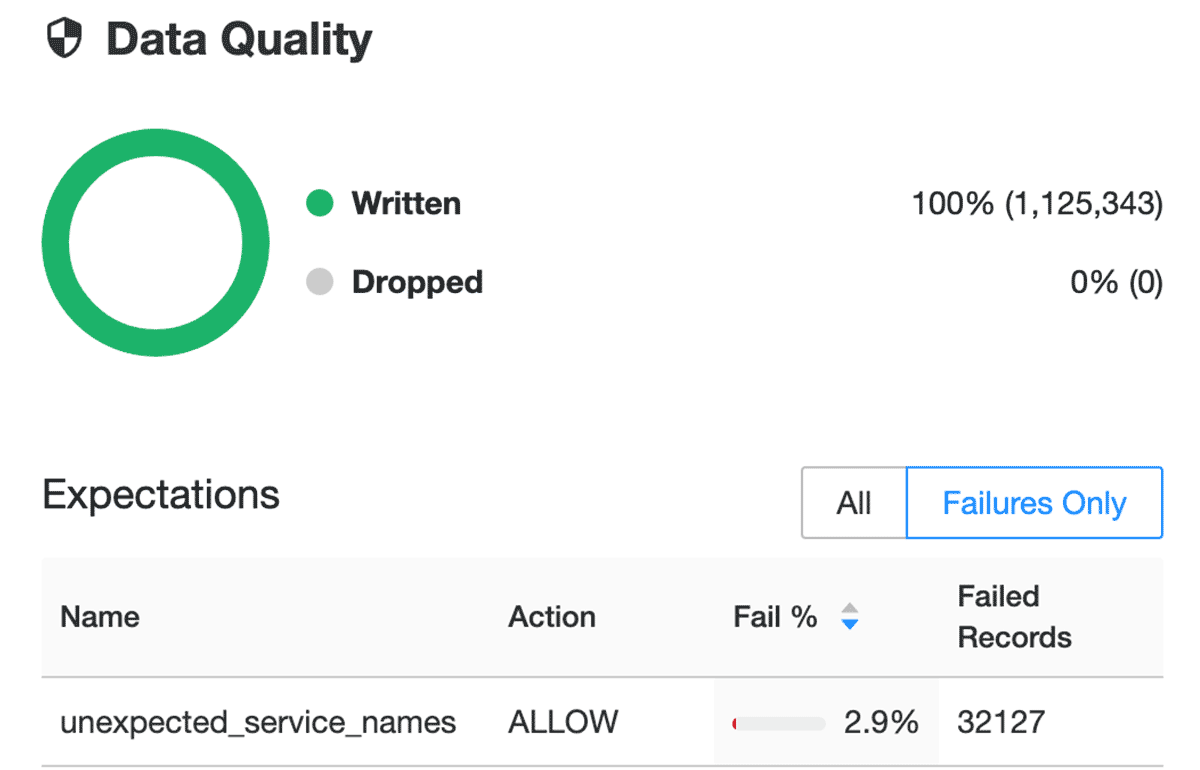
Save Time and Money on Data and ML Workflows With “Repair and Rerun”

$
0
0

Databricks Jobs is the fully managed orchestrator for all your data, analytics, and AI. It empowers any user to easily create and run workflows with multiple tasks and define dependencies between tasks. This enables code modularization, faster testing, more efficient resource utilization, and easier troubleshooting. Deep integration with the underlying lakehouse platform ensures workloads are reliable in production while providing comprehensive monitoring and scalability.

To support real-life data and machine learning use cases, organizations need to build sophisticated workflows with many distinct tasks and dependencies, from data ingestion and ETL to ML model training and serving. Each of these tasks needs to be executed in a specific order.

But when an important task in a workflow fails, it impacts all the associated tasks downstream. To recover the workflow you need to know all the tasks impacted and how to process them without reprocessing the entire pipeline from scratch. The new “Repair and Rerun” capability in Databricks jobs is designed to tackle exactly this problem.

Consider the following example which retrieves information about bus stations from an API and then attempts to get the real-time weather information for each station from another API. The results from all of these API calls are then ingested, transformed, and aggregated using a Delta Live Tables task.

Databricks “Repair and Rerun” capability tackles the problem of how to surgically recover a failed workflow without reprocessing the entire pipeline from scratch.

During normal operation this workflow will run successfully from beginning to end. However, what happens if the task that retrieves the weather data fails? Perhaps the weather API is temporarily unavailable for some reason. In that case, the Delta Live Tables task will be skipped because an upstream dependency failed. Obviously we need to rerun our workflow, but starting the entire process from the beginning will cost time and resources to reprocess all the station_information data again.

The newly-launched “Repair and Rerun” feature not only shows you exactly where in your job a failure occurred, but also allows you to rerun all of the tasks that were impacted.

The newly-launched “Repair and Rerun” feature not only shows you exactly where in your job a failure occurred, but letsyou to rerun all of the tasks that were impacted. This saves significant time and cost as you don’t need to reprocess tasks that were already successful.

In the event that a job run fails, you can now click on “Repair run” to start a rerun. The popup will show you exactly which of the remaining tasks will be executed

With Databrick' 'Repair and Rerun,' tn the event a job run fails, you can now click on “Repair run” to start a rerun.

With Databricks “Repair and Rerun,” the new run is then given a unique version number, associated with the failed parent run making it easy to review and analyze historical failures.

The new run is then given a unique version number, associated with the failed parent run making it easy to review and analyze historical failures.

With Databricks’ “Repair and Rerun,” the intuitive UI shows you exactly which tasks are impacted so you can fix the issue without rerunning your entire flow.

When tasks fail, “Repair and Rerun” for Databricks Jobs helps you quickly fix your production pipeline. The intuitive UI shows you exactly which tasks are impacted so you can fix the issue without rerunning your entire flow. This saves time and effort while providing deep insights to mitigate future issues.

“Repair and Rerun” is now Generally Available (GA), following on the heels of recently launched cluster reuse.

What’s Next

We are excited about what is coming in the roadmap, and look forward to hearing from you.

--

Try Databricks for free. Get started today.

The post Save Time and Money on Data and ML Workflows With “Repair and Rerun” appeared first on Databricks.

How illimity Bank Built a Disaster Recovery Strategy on the Lakehouse

$
0
0

The rising complexity of financial activities, the widespread use of information and communications technology, and new risk scenarios all necessitate increased effort by Financial Services Industry (FSI) players to ensure appropriate levels of business continuity.

Organizations in the financial services industry face unique challenges when developing Disaster Recovery (DR) and business continuity plans and strategies. Recovering from a natural disaster or another catastrophic event quickly is crucial for these organizations, as lost uptime could mean loss of profit, reputation, and customer confidence.

illimity Bank is Italy’s first cloud-native bank. Through its neprix platform, illimity provides loans to high-potential enterprises and buys and manages corporate distressed credit. Its direct digital bank, illimitybank.com, provides revolutionary digital direct banking services to individual and corporate customers. With Asset Management Companies (AMC) illimity also creates and administers Alternative Investment Funds.

illimity’s data platform is centered around Azure Databricks, and its functionalities. This blog describes the way we developed our data platform DR scenario, guaranteeing RTOs and RPOs required by the regulatory body at illimity and Banca d’Italia (Italy’s central bank).

Regulatory requirements on Disaster Recovery

Developing a data platform DR strategy, which is a subset of Business Continuity (BC) planning, is complex, as numerous factors must be considered. The planning begins with a Business Impact Analysis (BIA), which defines two key metrics for each process, application, or data product:

  • Recovery Time Objective (RTO) defines the maximum acceptable time that the application can be offline. Banca d’Italia further defines it as the interval between the operator’s declaration of the state of crisis and the recovery of the process to a predetermined level of service. It also considers the time needed to analyze the events that occurred and decide on the actions that need to be taken.
  • Recovery Point Objective (RPO) defines the maximum acceptable length of time during which data might be lost due to a disaster.

These metrics vary and change depending on how critical the process is to the business and definitions provided by regulatory bodies.

In this blog post we will cover the business processes deemed as “business critical” (i.e., having an RTO and RPO of 4 hours1).

Architecture

illimity started its journey on Databricks from scratch in 2018 with a single Workspace. Since then, Databricks has become the central data platform that houses all types of data workloads: batch, streaming, BI, user exploration and analysis.

Instead of opting for a traditional data warehousing solution like many traditional banks, we decided to fully adopt the Lakehouse by leveraging Delta Lake as the main format for our data (99% of all data in illimity are Delta Tables) and serve it with Databricks SQL. Data ingestion and transformation jobs are scheduled and orchestrated through Azure Data Factory (ADF) and Databricks Jobs. Our NoSQL data is hosted on MongoDB, while we’ve chosen Azure’s native business intelligence solution, PowerBI, for our dashboarding and reporting needs. In order to correctly track, label and guarantee correct data access, we integrated Azure Purview and Immuta into our architecture.

Figure below shows how the Databricks part of our architecture is organized. We set up two types of workspaces, technical and user workspaces, grouped inside an Azure resource group.

Each of the nine divisions of the bank has a dedicated technical workspace in a non-production and production environment where the division’s developers are both owners and administrators. All automated jobs will be executed in the technical workspaces, and business users don’t normally operate in them. A user workspace allows access to the business users of the division. This is where exploration and analysis activities happen.

Both types of workspaces are connected to the same, shared, Azure Data Lake Gen 2 (ADLS) and Azure Database for PostgreSQL, for data and metadata, respectively. These two are a single instance shared across all the divisions of the bank.

illimity Bank’s data architecture, featuring Azure Databricks and identical workspaces for technical and business users

Databricks deployment automation with Terraform

Before deciding to manage all Databricks resources as Infrastructure as Code (IaC) through Terraform, all the changes to these objects were done manually. This resulted in error-prone manual changes to both the non-production and production environment. Prior to decentralizing the architecture and moving towards a data mesh operative model, the entire data infrastructure of the bank was managed by a single team, causing bottlenecks and long resolution times for internal tickets. We have since created Terraform and Azure Pipeline templates for each team to use, allowing for independence while still guaranteeing compliance.

Here are some of the practical changes that have occurred since adopting Terraform as our de-facto data resource management tool:

  • Clusters and libraries installed on them were created and maintained manually, resulting in runtime mismatches between environments, non-optimized cluster sizes and outdated library versions. Terraform allows teams to manage their Databricks Runtimes as needed in different environments, while all libraries are now stored as Azure Artifacts, avoiding stale package versions. When creating clusters with Terraform, a double approval is needed on the Azure Pipeline that creates these resources in order to avoid human error, oversizing and unnecessary costs. Obligatory tagging on all clusters lets us allocate single project costs correctly and lets us calculate the return on equity (ROE) for each cluster.
  • Users and permissions on databases and clusters were added to Databricks manually. The created groups did not match those present in Azure Active Directory and defining the data the users could access for auditing purposes was almost impossible. User provisioning is now managed through SCIM and all ACLs are managed through Terraform, saving our team hours of time every week on granting these permissions.

In the beginning of the project, we used Experimental Resource Exporter and generated code for almost everything we had manually configured in the workspace: cluster and job configurations, mounts, groups, permissions. We had to manually rewrite some of that code, though it tremendously saved us the initial effort.

Command line interface to experimental resource exporter

Although Terraform has a steep learning curve and a notable investment had to be made to refactor existing processes, we started reaping the benefits in very little time. Apart from managing our DR strategy, an IaC approach saves data teams at illimity numerous hours of admin work, leaving more time for impactful projects that create value.

Adopting a disaster recovery strategy

When deciding how to approach DR, there are different strategies to choose from. Due to the strong RPO and RTO requirements of financial institutions, at illimity, we decided to adopt an Active/Passive Warm Standby approach, that maintains live data stores and databases, in addition to a minimum live deployment. The DR site must be scaled up to handle all production workloads in case of a disaster. This allows us to react faster to a disaster while keeping costs under control.

Our current setup for DR can be seen in Figure below. This is a simplified view considering only one workspace in one division, but the following considerations can be easily generalized. We replicate our entire cloud computing infrastructure in two Azure regions. Each component is deployed in both regions at all times, but the compute resources of the secondary region are turned off until a disaster event occurs. This allows us to react within minutes.

In this blog post, we will focus only on the Databricks part of the DR strategy. This includes the workspace, Azure Database for PostgreSQL and Azure Data Lake Storage Gen2.

illimity Bank’s disaster recovery setup features redundant cloud storage and computing infrastructure on Azure Databricks

Databricks objects

Inside a Databricks workspace, there are multiple objects that need to be restored in the new region in the event of a disaster. At illimity, we achieve this by leveraging Terraform to deploy our environments. The objects in a workspace, (i.e., clusters, users and groups, jobs, mount points, permissions and secrets) are managed via Terraform scripts. When we deploy a new workspace or update an existing one, we make sure to deploy in both regions. In this way, the secondary region is always up to date and ready to start processing requests in case of a disaster event. For automated jobs, nothing needs to be done since the triggering of a job operation automatically starts a Jobs cluster. For users workspaces, one of the available clusters is started whenever a user needs to execute an operation on the data.

Tables replication

When it comes to tables, in Databricks there are two main objects that need to be backed up: data in the storage account and metadata in the metastore. There are multiple options when choosing a DR strategy. In illimity, we decided to opt for a passive backup solution instead of setting up manual processes to keep them in sync, that is, leverage on the low-level replication capabilities made available by the cloud provider, Azure.

Data replication

Delta Lake provides ACID transactions, which adds reliability to every operation, and Time Travel. The latter is specifically important. Time Travel allows us to easily recover from errors and is fundamental for our disaster recovery.

As the main storage for Delta files, we opted for a GRS-RA Azure Data Lake Storage Gen2. This choice allows us to approach DR in a passive manner, in the sense that the replication to a secondary region is delegated to Azure. In fact, a Geo-redundant Read Access storage (GRS-RA) copies the data synchronously three times within a physical location in the primary region using LRS (Locally-redundant storage). Additionally, it copies the data asynchronously to a physical location in the secondary region. GRS offers durability for storage resources of at least sixteen 9’s over a given year. In terms of RPO, Azure Storage has an RPO of less than 15 minutes, although there’s currently no SLA on how long it takes to replicate data to the secondary region.

Due to this delay in the replication across regions, we need to make sure that all the files belonging to a specific version of the Delta table are present to not end up with a corrupted table. To address this, we created a script that is executed in the secondary region when a disaster event and outage occurs, that checks if the state of all the tables is consistent, the fact that all files of a specific version are present. If the consistency requirement is not met, the script restores the previous version of the table using Delta-native Time Travel, which is guaranteed to be within the specified RPO.

Metastore replication

The second component needed when working with Delta tables is a metastore. It allows users to register tables and manage Table ACL. At illimity, we opted for an external Hive Metastore over the managed internal Hive Metastore, mainly for its ability to replicate itself in a different region, without implementing a manual strategy. This is in line with opting for a passive DR solution. The metastore consists of a fully managed Geo-replicated Azure Database for PostgreSQL. When we modify the metadata from any workspace in the Primary region, it gets automatically propagated to the Secondary region. In case of an outage, the workspaces in our Secondary region always have the latest metadata that allows for a consistent view on tables, permissions, etc. Unity Catalog will soon be the standard internal metastore for Databricks and will provide additional functionalities, such as cross-workspace access, centralized governance, lineage, etc., that will simplify replicating the metastore for DR.

Modifying a Databricks Workspace at illimity

At illimity, we decided to have a strict policy in terms of Databricks workspaces creation and modification. Each workspace can be edited exclusively via Terraform and changes via the web UI are completely forbidden. This is achieved natively, since the UI does not allow modifying clusters created via Terraform. Moreover, only a few selected users are allowed to be admins within a workspace. This allows us to have compliant templates across our organization, and accountable division admins who carry out the changes.

Each division of illimity defines a process of applying changes to the state of the Databricks workspace through the use of Azure DevOps (ADO) pipelines. The ADO pipelines take care of doing the Terraform plan and apply steps, which are equivalent to the actual operations of creating, updating or removing resources, as defined within the versioned configuration code in the Git repositories.

Each ADO pipeline is responsible for carrying out the Terraform apply step against both the Primary and Secondary regions. In this way, the definition of workspace declared by the division will be replicated in a perfectly equivalent way in the different regions, ensuring total alignment and disaster recovery readiness.

The development process for the maintenance and update of the various Databricks workspaces, using Azure DevOps, is governed by the following guidelines

  • The master branch of each repository will maintain the Terraform configurations of both environments (UAT and PROD), which will define the current (and officially approved) state of the different resources. The possibility to make direct commits is disabled on that branch. An approval process via pull request is always required.
  • Any change to the resources in the various environments must go through a change to their Terraform code. Any new feature (e.g. library to be installed on the cluster, new Databricks cluster, etc.), which changes the state of the UAT or PROD environment, must be developed on a child branch of the master branch.
  • Only for changes to the production environment, the user will also have to open a Change Request (CHR) that will require Change-advisory board (CAB) approval, without which it will not be possible to make changes to production resources. The pull request will require confirmation from designated approvers within their division.
  • Granted approval, the code will be merged within the master branch and at that point, it will be possible to start the Azure DevOps pipeline, responsible for executing the Terraform apply to propagate the changes both in the Primary region and in the Secondary region.
  • For production environment changes only, the actual Azure DevOps Terraform apply step will be tied to the check of the presence of an approved change request.

This approach greatly facilitates our DR strategy, because we are always sure that both environments are exactly the same, in terms of Databricks Workspaces and the objects inside them.

How to test your DR Strategy on Azure

In illimity, we have created a step-by-step runbook for each team, which describes in detail all the necessary actions to guarantee the defined RTO and RPO times in case of a disaster. These runbooks are executed by the person on call when the disaster happens.

To validate the infrastructure, procedure and runbooks, we needed a way to simulate a disaster in one of Azure’s regions. Azure allows its clients to trigger a customer-initiated failover. Customers have to submit a request which effectively makes the primary region unavailable, thus failing over to the secondary region automatically.

Get started

Guaranteeing business continuity must be a priority for every company, not only for those in the Financial Services Industry. Having a proper disaster recovery strategy and being able to recover from a disaster event quickly is not only mandatory in many jurisdictions and industries, but it is also is business critical since downtime can lead to loss of profit, reputation and customer confidence.

illimity Bank fully adopted the Databricks Lakehouse Platform as the central data platform of the company, leveraging all the advantages with respect to traditional data warehouses or data lakes, and was able to implement an effective and automated DR solution as presented in this blog post. The assessment presented here should be considered as a starting point to implement an appropriate DR strategy in your company on the Lakehouse.

1Guidelines on business continuity for market infrastructures: Section 3, article 2.5

--

Try Databricks for free. Get started today.

The post How illimity Bank Built a Disaster Recovery Strategy on the Lakehouse appeared first on Databricks.

Building a Lakehouse Faster on AWS With Databricks: Announcing Our New Pay-as-You-Go Offering

$
0
0

As the need for data and AI applications accelerates, customers need a faster way to get started with their data lakehouse. The Databricks Lakehouse Platform was built to be simple and accessible, enabling organizations across industries to quickly reap the benefits from all of their data. But we’re always looking for ways to accelerate the path to Lakehouse even more. Today, Databricks is launching a pay-as-you-go offering on Databricks AWS, which lets you use your existing AWS account and infrastructure to get started.

Databricks initially launched on AWS, and now we have thousands of joint customers – like Comcast, Amgen, Edmunds and many more. Our Lakehouse architecture accelerates innovation and processes exabytes of data every day. This new pay-as-you-go offering builds off recent investments in our AWS partnership, and we’re thrilled to help our customers drive new business insights.

Building a Lakehouse on AWS just got easier

Our new pay-as-you-go basis on AWS Marketplace makes building a lakehouse even simpler with fewer steps – from set-up to billing – and provides AWS customers a seamless integration between their AWS configuration and Databricks. Benefits include:

Setup in Just a Few Clicks: No need to create a whole new account. Now, customers can use their existing AWS credentials to add a Databricks subscription directly from their AWS account.

Customers can find the Databricks Marketplace listing with a simple search of AWS Marketplace.

A self-service Quickstart video makes it easy for new signup to spin up their first workspace

A self-service Quickstart video makes it easy for new signup to spin up their first workspace

Smoother Onboarding: Once set up using AWS credentials, all account settings and roles are preserved with Databricks pay-as-you-go, enabling customers to get started right away with building their Lakehouse.

Consolidated Admin & Billing: AWS customers pay only for the resources they use and can bill against their existing EDP (Enterprise Discount Program) commitment with their Databricks usage, providing greater flexibility and scale to build a lakehouse on AWS that adapts to their needs.

Take it for a test drive: Existing AWS customers can sign also up for a free 14-day trial of Databricks from the AWS Marketplace and will be able to consolidate billing and payment under their existing AWS management account.

Simplicity combined with performance

This announcement dovetails off of recent enhancements with Databricks on AWS designed to bring flexibility and choice to customers – with the best price/performance possible.

Last month, we introduced the Public Preview of Databricks support for AWS Graviton2-based Amazon Elastic Compute Cloud (Amazon EC2) instances. Graviton processors deliver exceptional price-performance for workloads running in EC2. When used with Photon, Databricks’ high-performance query engine, this gives performance a whole new meaning. Our Engineering team ran benchmark tests and discovered that Graviton2-based Amazon EC2 instances can deliver 3x better price-performance than comparable Amazon EC2 instances for your data lakehouse workloads.

Our customers are our proofpoint

We’ve been working closely with AWS to deliver enhancements and GTM strategies that serve a common goal: helping our customers make a big impact with all of their data while reducing the complexities, cost and limitations of traditional data architectures. Our pay-as-you-go offering on AWS Marketplace and new support for Graviton are milestones in a long-term journey.

In honor of our partnership, we wanted to share some of our favorite joint customer stories that showcase the value of Lakehouse on AWS!

Comcast transforms home entertainment with voice, data and AI: Comcast connects millions of customers to personalized experiences, but previously they struggled with massive data, fragile data pipelines, and poor data science collaboration. With Databricks and AWS, they can build performant data pipelines for petabytes of data and easily manage the lifecycle of hundreds of models to create an award-winning viewer experience using voice recognition and ML. Read the full story here.

StrongArm preventatively reduces workplace injuries with data-driven insights: Industrial injury is a big problem that can have significant cost implications. StrongArm’s goal is to capture every relevant data point—roughly 1.2 million data points per day, per person—to predict injuries and prevent these runaway costs. These large volumes of time-series data made it hard to build reliable and performant ETL pipelines at scale and required significant resources. StrongArm turned to Databricks, with AWS as their cloud provider, and changed the speed with which they could go to clients with new insights, which meant making important injury prevention changes sooner. Read the full story here.

Edmunds democratizes data access for impactful data team collaboration:
Edmunds removed data siloes to ensure the inventory of vehicle listings on their website is accurate and up to date, improving overall customer satisfaction. With Databricks and AWS, they improved operational efficiencies resulting in millions of dollars in savings, and improved reporting speed by reducing processing time by 60 percent, or an average of 3-5 hours per week for the engineering team. Read the full story here.

Get started

We’re excited to further strengthen our AWS offering with Databricks’ pay-as-you-go experience on AWS Marketplace. To get started, visit the Databricks PAYGO on AWS marketplace.

--

Try Databricks for free. Get started today.

The post Building a Lakehouse Faster on AWS With Databricks: Announcing Our New Pay-as-You-Go Offering appeared first on Databricks.
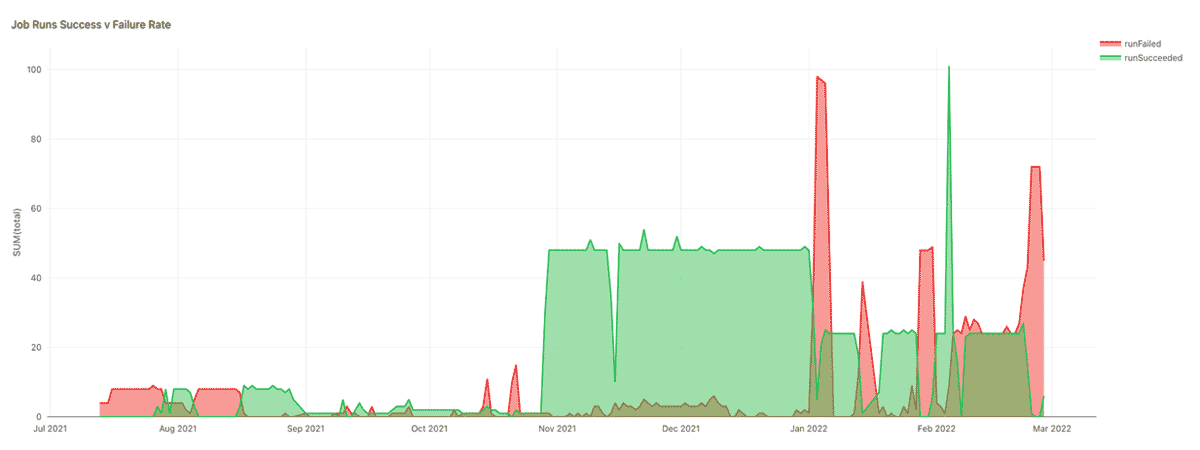
Introducing Databricks Workflows

$
0
0

Today we are excited to introduce Databricks Workflows, the fully-managed orchestration service that is deeply integrated with the Databricks Lakehouse Platform. Workflows enables data engineers, data scientists and analysts to build reliable data, analytics, and ML workflows on any cloud without needing to manage complex infrastructure. Finally, every user is empowered to deliver timely, accurate, and actionable insights for their business initiatives.

The lakehouse makes it much easier for businesses to undertake ambitious data and ML initiatives. However, orchestrating and managing production workflows is a bottleneck for many organizations, requiring complex external tools (e.g. Apache Airflow) or cloud-specific solutions (e.g. Azure Data Factory, AWS Step Functions, GCP Workflows). These tools separate task orchestration from the underlying data processing platform which limits observability and increases overall complexity for end-users.

Databricks Workflows is the fully-managed orchestration service for all your data, analytics, and AI needs. Tight integration with the underlying lakehouse platform ensures you create and run reliable production workloads on any cloud while providing deep and centralized monitoring with simplicity for end-users.

Orchestrate anything anywhere

Workflows allows users to build ETL pipelines that are automatically managed, including ingestion, and lineage, using Delta Live Tables. You can also orchestrate any combination of Notebooks, SQL, Spark, ML models, and dbt as a Jobs workflow, including calls to other systems. Workflows is available across GCP, AWS, and Azure, giving you full flexibility and cloud independence.

Reliable and fully managed

Built to be highly reliable from the ground up, every workflow and every task in a workflow is isolated, enabling different teams to collaborate without having to worry about affecting each other’s work. As a cloud-native orchestrator, Workflows manages your resources so you don’t have to. You can rely on Workflows to power your data at any scale, joining the thousands of customers who already launch millions of machines with Workflows on a daily basis and across multiple clouds.

Simple workflow authoring for every user

When we built Databricks Workflows, we wanted to make it simple for any user, data engineers and analysts, to orchestrate production data workflows without needing to learn complex tools or rely on an IT team. Consider the following example which trains a recommender ML model. Here, Workflows is used to orchestrate and run seven separate tasks that ingest order data with Auto Loader, filter the data with standard Python code, and use notebooks with MLflow to manage model training and versioning. All of this can be built, managed, and monitored by data teams using the Workflows UI. Advanced users can build workflows using an expressive API which includes support for CI/CD.

Simple workflow authoring for every user

“Databricks Workflows allows our analysts to easily create, run, monitor, and repair data pipelines without managing any infrastructure. This enables them to have full autonomy in designing and improving ETL processes that produce must-have insights for our clients. We are excited to move our Airflow pipelines over to Databricks Workflows.” Anup Segu, Senior Software Engineer, YipitData

Workflow monitoring integrated within the Lakehouse

As your organization creates data and ML workflows, it becomes imperative to manage and monitor them without needing to deploy additional infrastructure. Workflows integrates with existing resource access controls in Databricks, enabling you to easily manage access across departments and teams. Additionally, Databricks Workflows includes native monitoring capabilities so that owners and managers can quickly identify and diagnose problems. For example, the newly-launched matrix view lets users triage unhealthy workflow runs at a glance:

Workflow monitoring integrated with the lakehouse

As individual workflows are already monitored, workflow metrics can be integrated with existing monitoring solutions such as Azure Monitor, AWS CloudWatch, and Datadog (currently in preview).

“Databricks Workflows freed up our time on dealing with the logistics of running routine workflows. With newly implemented repair/rerun capabilities, it helped to cut down our workflow cycle time by continuing the job runs after code fixes without having to rerun the other completed steps before the fix. Combined with ML models, data store and SQL analytics dashboard etc, it provided us with a complete suite of tools for us to manage our big data pipeline.” Yanyan Wu VP, Head of Unconventionals Data, Wood Mackenzie – A Verisk Business

Get started with Databricks Workflows

To experience the productivity boost that a fully-managed, integrated lakehouse orchestrator offers, we invite you to create your first Databricks Workflow today.

In the Databricks workspace, select Workflows, click Create, follow the prompts in the UI to add your first task and then your subsequent tasks and dependencies. To learn more about Databricks Workflows visit our web page and read the documentation.

Watch the demo below to discover the ease of use of Databricks Workflows:

In the coming months, you can look forward to features that make it easier to author and monitor workflows and much more. In the meantime, we would love to hear from you about your experience and other features you would like to see.

--

Try Databricks for free. Get started today.

The post Introducing Databricks Workflows appeared first on Databricks.
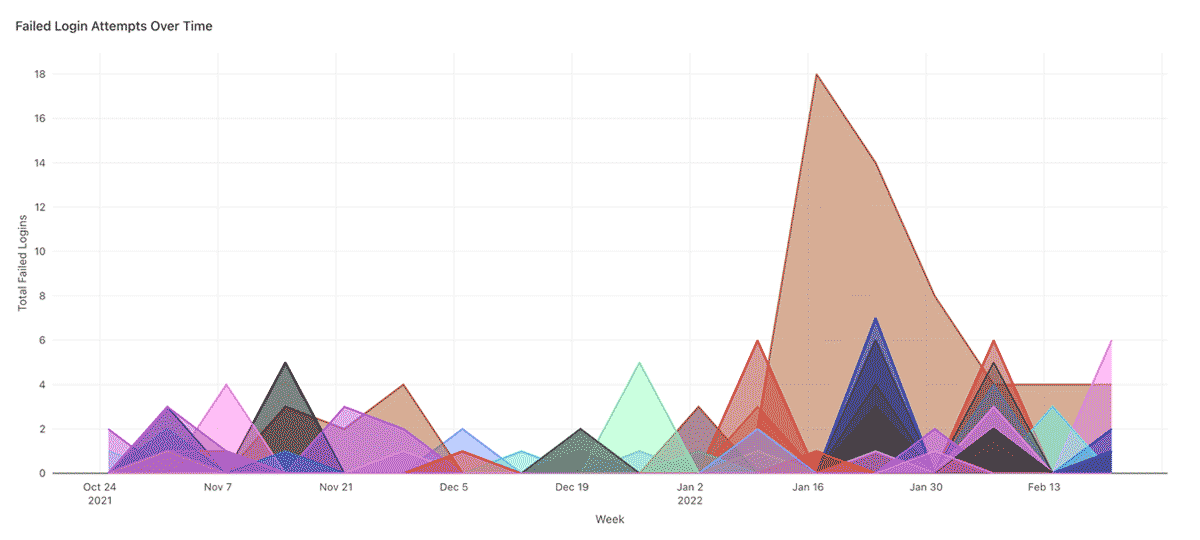

Reduce Time to Decision With the Databricks Lakehouse Platform and Latest Intel 3rd Gen Xeon Scalable Processors

$
0
0

This is a collaborative post from Databricks and Intel. We thank Swastik Chakroborty,Regional Technical Sales Director-APJ, and Lakshman Chari, Cloud ISV Partner Manager, of Intel, for their contributions.

 
The Databricks Lakehouse Platform unifies the best of data lake’s openness, scalability and flexibility with the best of data warehouse’s reliability, governance and performance. In this blog, we will look at performance aspects using Databricks Photon, which uses the latest techniques in vectorized query processing, and the latest Intel 3rd Gen Xeon scalable processors, which includes Intel Advanced Vector Extensions 512 (Intel® AVX-512).

Before we dive into the numbers, and the price/performance improvements, let’s take a moment to consider why these performance improvements are important. Consider this: as the volume of your data grows, and the requirement to deliver insights and take decisions quickly becomes important as a competitive advantage, the need to quickly process your data grows even faster. While optimizing and refactoring queries or code could help speed up workloads, analysts should focus on functional intent and business questions rather than query optimization. How do you ensure that results improve over time?

When you choose the Databricks Lakehouse Platform, you are choosing a platform that, together with our partners, consistently pushes and delivers improvements to help deliver the best value to our customers.

To examine these benefits in action, we ran a test derived from the industry-standard TPC-DS power test2. We examined the results3 before and after enabling Photon and then switching to use latest Intel 3rd Gen Xeon Scalable processors:

Photon is the native vectorized query engine on Databricks, written to be directly compatible with Apache Spark APIs so it works with your existing code. When you enable Photon, your existing code and queries can take advantage of the latest techniques in vectorized query processing to capitalize on data – and instruction-level parallelism in CPUs. This allows Photon customers to get a lower TCO and faster SLA for ETL and interactive queries.

Intel 3rd Gen Xeon Scalable processor includes Intel’s latest generation of Single Instruction Multiple Data (SIMD) instruction set, Intel® AVX-512, which boosts performance and throughput for the most demanding computational tasks such as data analytics and machine learning.

Establishing a baseline

For the baseline, we are using Azure’s E8ds_v3 virtual machines, which have Intel 1st Gen Xeon Scalable processors, and Databricks runtime (DBR) 10.3 without Photon enabled. We ran TPC-DS benchmarks during March 2022 at both 1TB and 10TB scales on 20 worker clusters sizes.

20 x E8ds_v3 ( Intel 1st Gen Xeon Scalable processors) workers, DBR 10.3 without Photon enabled

TPC-DS at 1TB TPC-DS at 10TB
Time (s) 2,265 15,324
Total cost
(Databricks Premium + VM costs)
$14 $98

The Photon effect

We then ran the same workload without any code changes on the same machines with Photon enabled.

20 x E8ds_v3 ( Intel 1st Gen Xeon Scalable processors) workers, DBR 10.3 with Photon enabled

TPC-DS at 1TB TPC-DS at 10TB
Time (s) 645 4,482
Total cost
(Databricks Premium + VM costs)
$7 $52

That’s already yielded a 1.9x price-performance increase and a 3.4x performance speedup compared to the baseline.

Unleashing the full potential with Photon and Intel 3rd Gen Xeon Scalable processors

Again the same workload without any code changes, but this time using Azure’s E8_ds_v5 virtual machines, with Intel 3rd Gen Xeon Scalable processors, and Photon enabled

20 x E8ds_v5 (Intel 3rd Gen Xeon Scalable processors) workers, DBR 10.3 with Photon enabled

  TPC-DS at 1TB TPC-DS at 10TB
Time (s) 334 2,271
Total cost
(Databricks Premium + VM costs)
$4.78 $32.47

That’s a 3x price-performance increase and a 6.7x performance speedup compared to our baseline.

Time for some graphs

Putting it all together

By enabling Databricks Photon and using Intel’s 3rd Gen Xeon Scalable processors, without making any code modifications, we were able to save ⅔ of the costs on our TPC-DS benchmark at 10TB and run 6.7 times quicker. This translates not only to cost savings but also reduced time-to-insight.

Learn more at

databricks.com/lakehouse
databricks.com/photon
intel.com/xeonscalable
intel.com/avx512


Footnotes

1 3.0x price/performance benefits and 6.7x the speed up – compared to the same TPC-DS 10TB benchmark with Intel 1st Gen Xeon processors with DBR 10.3 and without Photon enabled.

2 Derived from the power test consisting of all 99 TPC-DS queries ran in sequential order within a single stream.

3 The results shown are not comparable to an official, audited TPC benchmark.

--

Try Databricks for free. Get started today.

The post Reduce Time to Decision With the Databricks Lakehouse Platform and Latest Intel 3rd Gen Xeon Scalable Processors appeared first on Databricks.
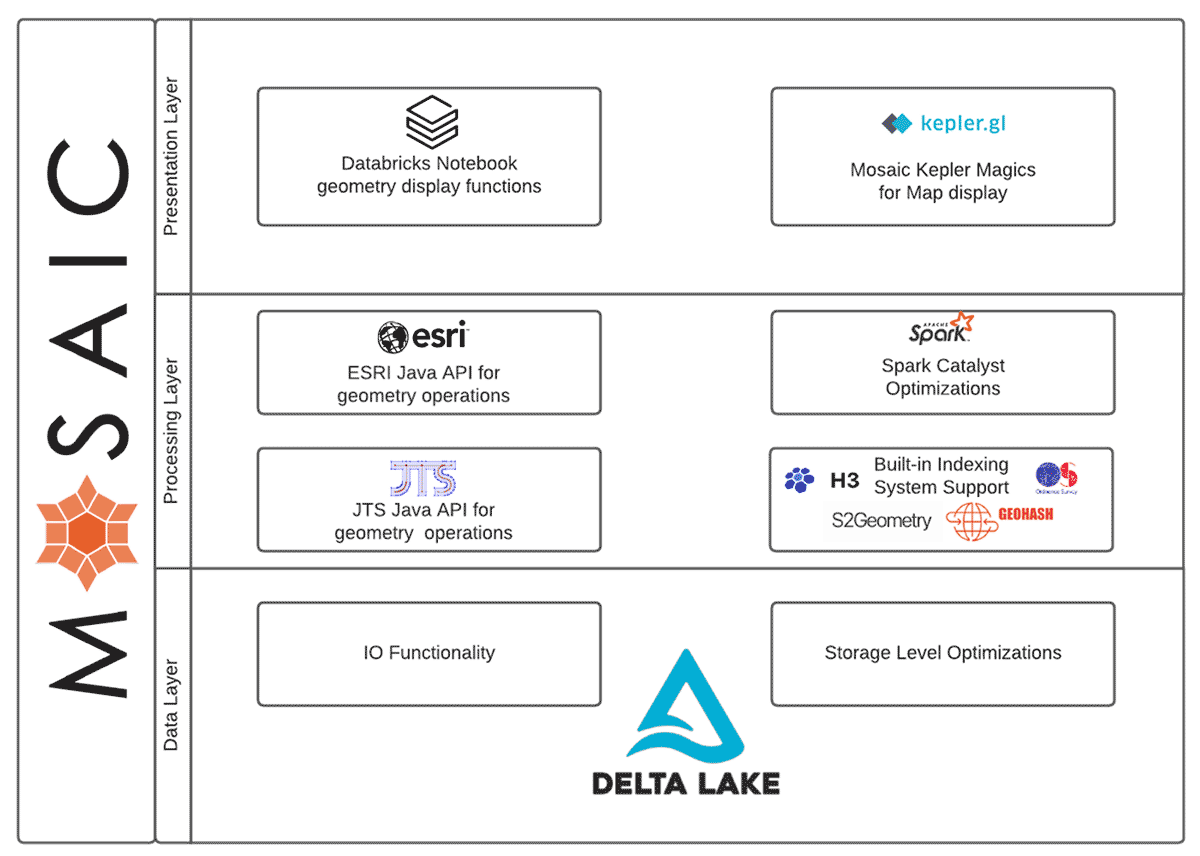
Build Scalable Real-time Applications on the Lakehouse Using Confluent & Databricks, Part 2

$
0
0

This is a collaborative post between Confluent and Databricks. We thank Paul Earsy Staff Solutions Engineer at Confluent, for their contributions.

 
In this blog we’ll be highlighting the simplified experience using Confluent’s fully-managed sink connector for Databricks on AWS. This fully-managed connector was designed specifically for the Databricks Lakehouse and provides a powerful solution to build and scale real-time applications such as application monitoring, internet of things (IoT), fraud detection, personalization and gaming leaderboards. Organizations can use an integrated capability that streams legacy and cloud data from the Confluent platform directly into the Databricks Lakehouse for data science, data analytics, machine learning and business intelligence (BI) use cases on a single platform. The direct ingestion into the Databricks Lakehouse, specifically Delta Lake is available with the Confluent product and this provides a significant ease-of-use advantage compared to other data streaming alternatives like AWS Kinesis or AWS Managed Service for Kafka (MSK).

As we touched on in our last blog: Confluent Streaming for Databricks: Build Scalable Real-time Applications on the Lakehouse, streaming data through Confluent Cloud directly into Databricks Delta Lake greatly reduces the complexity of writing manual code to build custom real-time streaming pipelines and hosting open source Apache Kafka, saving hundreds of hours of engineering resources. Once streaming data is in Delta Lake, you can unify it with batch data to build integrated data pipelines to power your mission-critical applications. Delta lake provides greater reliability than traditional data lakes with its transaction management and schema enforcement capabilities.

There are three core use cases that are enabled with the Confluent Databricks Delta Lake Sink Connector for Confluent Cloud:

  1. Streaming on-premises and multicloud data for cloud analytics: Leveraging its Apache Kafka and Confluent footprint across on-prem and clouds, Confluent can stream all of this distributed data into Delta Lake, where Databricks offers the speed and scale to manage real-time applications in production.
  2. Streaming data for analysts and business users using SQL analytics: Using Confluent and Databricks, organizations can prep, join, enrich and query streaming data sets in Databricks SQL to perform blazingly fast analytics on stream data. Data is available much faster for analysis because it is now available in the data lakehouse.
  3. Predictive analytics with ML models using streaming data: Databricks’ collaborative Machine Learning solution is built on Delta Lake so you can capture gigabytes of streaming source data directly from Confluent Cloud into Delta tables to create ML models, query and collaborate on those models in real-time.

Together, Databricks and Confluent form a powerful and complete data solution focused on helping companies modernize their legacy data infrastructure and operate at scale in real time. With Confluent and Databricks, developers can create real-time applications, enable microservices, and leverage multiple data sources driving better business outcomes.

How the Sink Connector accelerates data migration through simplified data ingestion

The Databricks Delta Lake Sink Connector for Confluent Cloud eliminates the need for the development and management of custom integrations, and thereby reduces the overall operational burden of connecting your data between Confluent Cloud and Delta Lake on Databricks. Databricks Delta Lake is an open format storage layer that delivers reliability, security, and performance on your data lake—for both streaming and batch operations. By replacing data silos with a single home for structured, semi-structured, and unstructured data, Delta Lake is the foundation of a cost-effective, highly-scalable lakehouse.

For example, enterprises can pull data from on-premises data warehouses (e.g Oracle, Teradata, Microsoft SQL Server, MySQL and others) and hundreds of popular systems (applications, SaaS applications, log streams, event streams, and others) into Confluent Cloud, pre-process and prep streaming data in ksqlDB, and send it off to Databricks Delta Lake using the fully managed sink connector.

Easy to configure experience vs. writing custom code

If you were to build a custom real time data extraction and ingest pipeline, it would involve a lot of developer resources. They would need to implement these custom pipelines, then maintain and operationalize them. These custom pipelines would also be brittle due to the complexity involved in data extraction api supported by the various source systems, api limitations and frequent api changes. Using a low-code, config based, managed data extract & ingest pipelines helps provide a low cost, scalable and maintainable solutions. This also frees up developer resources to focus on projects that provide higher business value.

Confluents Databricks Sink Connector provides a no-code, config based approach that simplifies data extraction and ingest pipelines. This flow and set of screenshots show you how easy it is to get started on connecting Confluent to Databricks.

To start using this connector

  • On the Confluent Cloud UI , navigate to the Cluster overview page. Then select Data integration -> Connectors. Then add a fully managed connector and choose the Databricks Delta Lake Sink connector.

First step to connect Confluent to Databricks.

And then to start configuring the connector

  • On the next screen, select the Kafka topics you want to get the data from, the format for the input messages and Kafka cluster credentials. Provide the details to connect to a Databricks SQL endpoint or Databricks Cluster. Provide Kafka topic to Databricks Delta table mappings. Provide details of your own staging location, where temporary data is staged before ingesting into Delta.

Configuring the Confluent Cloud’s Sink connector for Databricks.

And to finally deploy the connector

  • Click Next to review the details for your connector, and click Launch to start it. On the “Connectors” page, the status of your new connector reads “Provisioning” and then changes to “Running.” The connector is now copying data to Databricks Delta. The sink connector also creates the tables on Databricks, if they don’t already exist.

Enable a use case around predictive analytics for fraud detection

In this demo scenario, we will see how Databricks and Confluent enable predictive analytics for detecting fraud at a financial institution. At this financial institution, an increase in fraudulent transactions has started to affect the growth of the business and they want to leverage predictive analytics to reduce fraud.

Let’s say they use a database like Oracle (or any other database) to store transactions related to their business. They have implemented Salesforce to manage all of their CRM data, and hence maintain all customer account and contact data in Salesforce. They also use lots of other databases and applications that have customer and product data.

The data science team wants to harness existing customer data and apply the latest machine learning and predictive analytics to customer data with real-time financial transactions. However, there are three challenges:

  • DBAs likely don’t want the data science team to directly and frequently query the tables in the Oracle databases due to the increased load on the database servers and the potential to interfere with existing transactional activity
  • If the team makes a static copy of the data, they will need to keep that copy up to date in near real time
  • With data siloed in various data source systems, data science teams have a fragmented approach to accessing and consuming customer and product data. Therefore a central data repository, such as Delta Lake, makes it easy for work with curated/standardized/gold data

Confluent’s Oracle CDC Source Connector can continuously monitor the original database and create an event stream in the cloud with a full snapshot of all of the original data and all of the subsequent changes to data in the database, as they occur and in the same order. The Databricks Delta Lake Sink Connector can continuously consume that event stream and apply those same changes to Databricks Delta. The sink connector has been designed to work effectively with Databricks SQL.

This connector helps simplify the architecture and implementation for extracting data from the various sources and ingesting the streaming data into the Databricks Lakehouse Platform.

Below is a high-level architecture for this use case.

High-level Confluent-Databricks architecture for extracting and ingesting data from various sources into the Databricks Lakehouse.

The streaming raw data is now available as Delta tables. The raw data can now be cleansed and prepared to support the fraud analytics use case.

Delta Live Tables then helped build reliable, maintainable, fully managed data processing pipelines that help take the raw data and go through the medallion architecture (i.e., improving the structure and quality of data as it flows from bronze -> silver -> gold). Gold data is now readily made available for the data scientists working on building the machine learning (ML) models to predict fraudulent transactions.

Databricks has tools, such as, Delta Live Tables, built into the platform to help build reliable, maintainable, fully managed data processing pipelines.

Databricks AutoML helped create baseline machine learning (ML) models and notebooks. This enabled data scientists to review, select, deploy and operationalize the best ML model. The end to end ML model lifecycle is also fully managed using mlflow. This includes running/tracking the experiments, using a model registry to manage the model lifecycle, deploying the models to production and model serving.
This helped simplify the implementation of the end-to-end solution to predict fraud in real time.

Using Databricks SQL, business intelligence (BI) analysts can query for data and build dashboards. Optimized connectors for Databricks SQL available in leading business intelligence tools like Tableau, PowerBI, Looker, and others allows one to create BI dashboards.

Let’s recap how Confluent + Databricks helped support this predictive fraud analytics use case for this financial institution.

  • Confluent Cloud’s Sink Connector for Databricks helped simplify the ingest of the streaming data into the Databricks Lakehouse
  • Delta Live tables helped simplify data engineering by allowing analysts to use SQL to build managed data pipelines
  • Databricks AutoML helped simplify creating and operationalizing the machine learning models
  • Databricks SQL helped enable data analysts and BI users to explore data and create dashboards

Conclusion

With Confluent and Databricks, organizations can create real-time applications, enable microservices, and enable analysis of all data, resulting in better data-driven decisions and business outcomes. Together, we form a powerful and complete data solution focused on helping companies operate at scale in real-time.

Getting Started with Databricks and Confluent Cloud

To get started with the connector, you will need access to Databricks and Confluent Cloud. Check out the Databricks Sink Connector for Confluent Cloud documentation and take it for a spin on Databricks for free by signing up for a 14-day trial. Also check out a free trial of Confluent Cloud.

Check out the previous blog “Confluent Streaming for Databricks: Build Scalable Real-time Applications on the Lakehouse

--

Try Databricks for free. Get started today.

The post Build Scalable Real-time Applications on the Lakehouse Using Confluent & Databricks, Part 2 appeared first on Databricks.
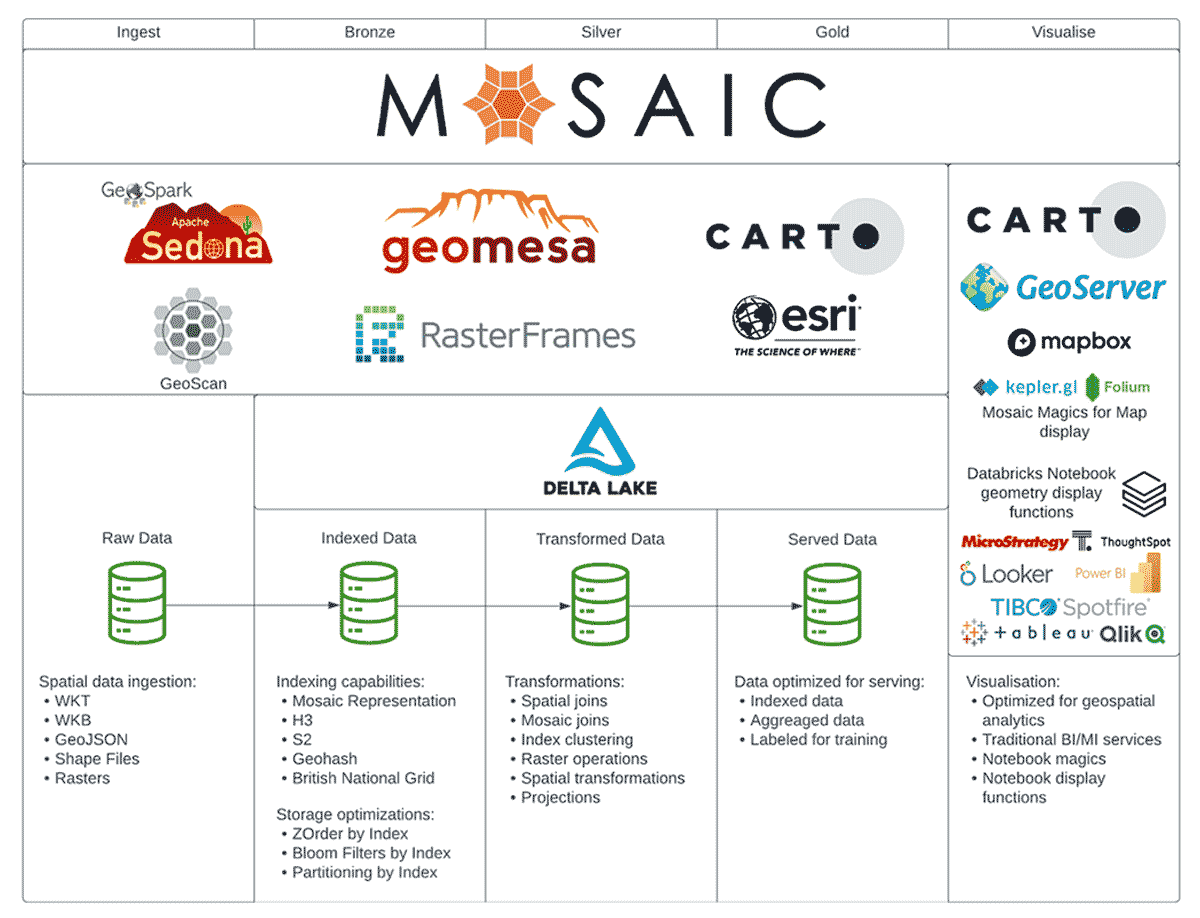
How I Built A Streaming Analytics App With SQL and Delta Live Tables

$
0
0

Planning my journey

I’d like to take you through the journey of how I used Databricks’ recently launched Delta Live Tables product to build an end-to-end analytics application using real-time data with a SQL-only skillset.

I joined Databricks as a Product Manager in early November 2021. I’m clearly still a newbie at the company but I’ve been working in data warehousing, BI, and business analytics since the mid-’90s. I’ve built a fair number of data warehouses and data marts in my time (Kimball or Inmon, take your pick) and have used practically every ETL and BI tool under the sun at one time or another.

I’m not a data engineer by today’s standards. I know SQL well, but I’m more of a clicker than a coder. My technical experience is with tools like Informatica, Trifacta (now part of Alteryx), DataStage, etc. vs. languages like Python and Scala. My persona I think, is more like what our friends at dbt labs would call an Analytics Engineer vs. a Data Engineer.

So with all this as a backdrop and in a bid to learn as many Databricks products as I can (given my newbie status in the company), I set out on the journey to build my app. And I didn’t want it to be just another boring static BI dashboard. I wanted to build something much more akin to a production app with actual live data.

Since I live in Chicago, I’m going to use the Divvy Bikes data. I’ve seen a lot of demos using their static datasets but hardly any using their real-time APIs. These APIs track the ‘live’ station status (e.g. # bikes available, # docks available, etc.) of all 842 stations across the city. Given bicycle rentals are so dependent on the weather, I’ll join this data with real-time weather information at each station using the OpenWeather APIs. That way we can see the impact of the brutal Chicago winter on Divvy Bike usage.

Capturing and ingesting the source data

Given our data sources are the Divvy Bikes and OpenWeather APIs, the first thing I need to do is figure out how to capture this data so it’s available in our cloud data lake (i.e. ADLS in my case, as my Databricks Workspace is running in Azure).

There are lots of data ingest tools I could choose for this task. Many of these, like Fivetran, are available in just a couple of clicks via our Partner Connect ecosystem. However, for the sake of simplicity, I just created 3 simple Python scripts to call the APIs and then write the results into the data lake.

Once built and tested, I configured the scripts as two distinct Databricks Jobs.

The first job gets the real-time station status every minute, returning a single JSON file with the current status of all 1,200 or so Divvy Bike stations in Chicago. A sample payload looks like this. Managing data volumes and the number of files will be of concern here. We are retrieving the status for every station, every minute. This will collect 1,440 JSON files (60 files/hour*24hrs) and ~1.7M new rows every day. At that rate, one year of data gives us ~520k JSON files and ~630M rows to process.

The second job consists of two tasks that run every hour.

Sample job to retrieve descriptive and real-time information built as part of a streaming analytics solution using Delta Live Tables and SQL.

The first task retrieves descriptive information for every station such as name, type, lat, long, etc. This is a classic ‘slowly changing dimension’ in data warehousing terms since we do not expect this information to change frequently. Even so, we will refresh this data every hour just in case it does; for example, a new station might come online, or an existing one could be updated or deactivated. Check out a sample payload here.

The second task in the job then fetches real-time weather information for each of the 1200 or so stations. This is an example payload for one of the stations. We call the API using its lat/long coordinates. Since we will call the OpenWeather API for every station we will end up with 28,800 files every day (1200*24). Extrapolating for a year gives us ~10.5M JSON files to manage.

These scripts have been running for a while now. I started them on January 4th, 2022 and they have been merrily creating new files in my data lake ever since.

Realizing my “simple” demo is actually quite complex

Knowing that I now need to blend and transform all this data, and having done the math on potential volumes, and looked at data samples a bit, this is where I start to sweat. Did I bite off more than I can chew? There are a few things that make this challenging vs. your average ‘static’ dashboard:

  1. I’ve no idea how to manage thousands of new JSON files that are constantly arriving throughout the day. I also want to capture several months of data to look at historical trends. That’s millions of JSON files to manage!
  2. How do I build a real-time ETL pipeline to get the data ready for fast analytics? My source data is raw JSON and needs cleansing, transforming, joining with other sources, and aggregating for analytical performance. There will be tons of steps and dependencies in my pipeline to consider.
  3. How do I handle incremental loads? I obviously cannot rebuild my tables from scratch when data is constantly streaming into the data lake and we want to build a real-time dashboard. So I need to figure out a reliable way to handle constantly moving data.
  4. The OpenWeather JSON schema is unpredictable. I quickly learned that the schema can change over time. For example, if it’s not snowing, you don’t get snow metrics returned in the payload. How do you design a target schema when you can’t predict the source schema!?
  5. What happens if my data pipeline fails? How do I know when it failed and how do I restart it where it left off? How do I know which JSON files have already been processed, and which haven’t?
  6. What about query performance in my dashboards? If they are real-time dashboards they need to be snappy. I can’t have unfinished queries when new data is constantly flowing in. To compound this, I’ll quickly be dealing with hundreds of millions (if not billions) of rows. How do I performance tune for this? How do I optimize and maintain my source files over time? Help!

OK, I’ll stop now. I’m getting flustered just writing this list and I’m sure there are a hundred other little hurdles to jump over. Do I even have the time to build this? Maybe I should just watch some videos of other people doing it and call it a day?

No. I will press on!

De-stressing with Delta Live Tables

OK, so next up — how to write a real-time ETL pipeline. Well, not ‘real’ real-time. I’d call this near real-time — which I’m sure is what 90% of people really mean when they say they need real-time. Given I’m only pulling data from the APIs every minute, I’m not going to get fresher data than that in my analytics app. Which is fine for a monitoring use case like this.

Databricks recently announced full availability for Delta Live Tables (aka DLT). DLT happens to be perfect for this as it offers “a simple declarative approach to building reliable data pipelines while automatically managing infrastructure at scale, so data analysts and engineers can spend less time on tooling and focus on getting value from data.” Sounds good to me!

DLT also allows me to build pipelines in SQL which means I can keep to my SQL-only goal. For what it’s worth, it also allows you to build pipelines in Python if you so choose – but that’s not for me.

The big win is that DLT allows you to write declarative ETL pipelines, meaning rather than hand-coding low-level ETL logic, I can spend my time on the ‘what’ to do, and not the ‘how’ to do it. With DLT, I just specify how to transform and apply business logic, while DLT automatically manages all the dependencies within the pipeline. This ensures all the tables in my pipeline are correctly populated and in the right order.

This is great as I want to build out a medallion architecture to simplify change data capture and enable multiple use cases on the same data, including those that involve data science and machine learning – one of the many reasons to go with a Lakehouse over just a data warehouse.

Sample Delta Lake medallion architecture used for both streaming and batch use cases.

Other big benefits of DLT include:

  • Data quality checks to validate records as they flow through the pipeline based on expectations (rules) I set
  • Automatic error handling and recovery — so if my pipeline goes down, it can recover!
  • Out-of-the-box monitoring so I can look at real-time pipeline health statistics and trends
  • Single-click deploy to production and rollback options, allowing me to follow CI/CD patterns should I choose

And what is more, DLT works in batch or continuously! This means I can keep my pipeline ‘always on’ and don’t have to know complex stream processing or how to implement recovery logic.

Ok, so I think this addresses most of my concerns from the previous section. I can feel my stress levels subsiding already.

A quick look at the DLT SQL code

So what does this all look like? You can download my DLT SQL notebook here if you want to get hands-on; it’s dead simple, but I will walk you through the highlights.

First, we build out our Bronze tables in our medallion architecture. These tables simply represent the raw JSON in a table format. Along the way, we are converting the JSON data to Delta Lake format, which is an open format storage layer that delivers reliability, security, and performance on the data lake. We are not really transforming the data in this step. Here’s an example for one of the tables:

Example bronze table, representing the raw JSON in a table format.

First, notice that we have defined this as a ‘STREAMING’ live table. This means the table will automatically support updates based on continually arriving data without having to recompute the entire table.

You will also notice that we are also using Auto Loader (cloud_files) to read the raw JSON from object storage (ADLS). Auto Loader is a critical part of this pipeline, and provides a seamless way to load the raw data at low cost and latency with minimal DevOps effort.

Auto Loader incrementally processes new files as they land on cloud storage so I don’t need to manage any state information. It efficiently tracks new files as they arrive by leveraging cloud services without having to list all the files in a directory. Which is scalable even with millions of files in a directory. It is also incredibly easy to use, and will automatically set up all the internal notifications and message queue services required for incremental processing.

It also handles schema inference and evolution. You can read more on that here but in short, it means I don’t have to know the JSON schema in advance, and it will gracefully handle ‘evolving’ schemas over time without failing my pipeline. Perfect for my OpenWeather API payload – yet another stress factor eliminated.

Once I have defined all my Bronze level tables I can start doing some real ETL work to clean up the raw data. Here’s an example of how I create a ‘Silver’ medallion table:

Example silver table used to do the real ETL work of cleaning up the raw data.

You’ll notice a number of cool things here. First, it is another streaming table, so as soon as the data arrives in the source table (raw_station_status), it will be streamed over to this table right away.

Next, notice that I have set a rule that station_id is NOT NULL. This is an example of a DLT expectation or data quality constraint. I can declare as many of these as I like. An expectation consists of a description, a rule (invariant), and an action to take when a record fails the rule. Above I decided to drop the row from the table if a NULL station_id is encountered. Delta Live Tables captures Pipeline events in logs so I can easily monitor things like how often rules are triggered to help me assess the quality of my data and take appropriate action.

I also added a comment and a table property as this is a best practice. Who doesn’t love metadata?

Finally, you can unleash the full power of SQL to transform the data exactly how you want it. Notice how I explode my JSON into multiple rows and perform a whole bunch of datetime transformations for reporting purposes further downstream.

Handling slowly changing dimensions

The example above outlines ETL logic for loading up a transactional or fact table. So the next common design pattern we need to handle is the concept of slowly changing dimensions (SCD). Luckily DLT handles these too!

Databricks just announced DLT support for common CDC patterns with a new declarative APPLY CHANGES INTO feature for SQL and Python. This new capability lets ETL pipelines easily detect source data changes and apply them to datasets throughout the lakehouse. DLT processes data changes into the Delta Lake incrementally, flagging records to be inserted, updated, or deleted when handling CDC events.

Our station_information dataset is a great example of when to use this.

Sample dataset where rows can be appended or updated using Delta Live Tables new APPLY CHANGES INTO feature for SQL and Python.

Instead of simply appending, we update the row if it already exists (based on station_id) or insert a new row if it does not. I could even delete records using the APPLY AS DELETE WHEN condition but I learned a long time ago that we never delete records in a data warehouse. So this is classified as an SCD type 1.

Deploying the data pipeline

I’ve only created bronze and silver tables in my pipeline so far but that’s ok. I could create gold level tables to pre-aggregate some of my data ahead of time enabling my reports to run faster, but I don’t know if I need them yet and can always add them later.

So the deployed data pipeline currently looks like this:

Sample streaming analytics pipeline with bronze and silver tables built with Delta Live Tables and SQL.

3 bronze (raw) tables, an intermediate view (needed for some JSON gymnastics), and 3 silver tables that are ready to be reported on.

Deploying the pipeline was easy, too. I just threw all of my SQL into a Notebook and created a continuous (vs. triggered) DLT pipeline. Since this is a demo app I haven’t moved it into production yet but there’s a button for that, I can toggle between development and production modes here to change the underlying infrastructure the pipeline runs on. In development mode, I can avoid automatic retries and cluster restarts, but switch these on for production. I can also start and stop this pipeline as much as I want. DLT just keeps track of all the files it has loaded so knows exactly where to pick up from.

Creating amazing dashboards with Databricks SQL

The final step is to build out some dashboards to visualize how all this data comes together in real-time. The focus of this particular blog is more on DLT and the data engineering side of things, so I’ll talk about the types of queries I built in a follow-up article to this.

You can also download my dashboard SQL queries here.

My queries, visualizations, and dashboards were built using Databricks SQL (DB SQL). I could go on at length about the amazing record-breaking capabilities of the Photon query engine, but that is also for another time.

Included with DB SQL are data visualization and dashboarding capabilities, which I used in this case, but you can also connect your favorite BI or Data Visualization tool, all of which work seamlessly.

I ended up building 2 dashboards. I’ll give a quick tour of each.

The first dashboard focuses on real-time monitoring. It shows the current status of any station in terms of the availability of bikes/docks along with weather stats for each station. It also shows trends over the last 24 hrs. The metrics displayed for ‘now’ are never more than one minute old, so it’s a very actionable dashboard. It’s worth noting that 67.22°F is nice and warm for Chicago in early May!

Databricks SQL dashboard with real-time data provided by the streaming pipeline built using Delta Live Tables.

Another cool feature is that you can switch to any day, hour, and minute to see what the status was in the past. For example, I can change my ‘Date and Time’ filter to look at Feb 2nd, 2022 at 9 am CST to see how rides were impacted during a snowstorm.

Sample Databricks SQL dashboard with a 'Date and Time' filter.

I can also look at stations with zero availability on a map in real-time, or for any date and time in the past.

Sample Databricks SQL dashboard with real-time mapping capabilities.

The second dashboard shows trends over time from when the data was first collected until now:

Sample Databricks SQL dashboard showing trends over time.

In terms of dashboard query performance, all I can say is that I haven’t felt the need to create any aggregated or ‘Gold’ level tables in my medallion architecture yet. SQL query performance is just fine as-is. No query runs for any longer than ~3 seconds, and most run within a second or two.

Apart from the exceptional query performance of the Photon engine, one of the key benefits of DLT is that it also performs routine maintenance tasks such as a full OPTIMIZE operation followed by VACUUM on my pipeline tables every 24 hours. This not only helps improve query performance but also reduces costs by removing older versions of tables that are no longer needed.

Summary

I’ve come to the end of this part of my journey, which was also my first journey with Databricks. I’m surprised at how straightforward it was to get here considering many of the concerns I outlined earlier. I achieved my goal to build a full end-to-end analytics app with real-time data without needing to write any code or pick up the batphone to get the assistance of a ‘serious’ data engineer.

There are lots of data and analytics experts with similar backgrounds and skill sets to me, and I feel products like Delta Live Tables will truly unlock Databricks to way more data and analytics practitioners. It will also help more sophisticated data engineers by streamlining and automating laborious operational tasks so they can focus on their core mission — innovating with data.

If you would like to learn more about Delta Live Tables please visit our web page. There you will find links to eBooks, technical guides to get you started, and webinars. You can also watch a recorded demo walking through the Divvy Bike demo on our YouTube channel and download the demo assets on Github.

Thanks!

--

Try Databricks for free. Get started today.

The post How I Built A Streaming Analytics App With SQL and Delta Live Tables appeared first on Databricks.

Day In the Life of A Customer Success Engineer

$
0
0

At Databricks, Bricksters operate with a unified goal to make our customers successful in every part of their data strategy. This objective dictates every aspect of our organization – from engineering to customer success. Our engineers have built the very first data lakehouse, which offers one simple platform for our customers to unify all of their data, analytics, and AI workloads. After a company is sold on Lakehouse, Databricks ensure they are successful through dedicated customer success teams and partnership programs. This combination of product innovation and investments in customer success is a huge factor of Databricks growth. We’re rapidly expanding our hiring, continue to support thousands of customers and earlier this year were is why Databricks is the only cloud-native vendor named a Leader in both Gartner Magic Quadrants: Cloud Database Management Systems and Data Science and Machine Learning Platforms.

What does Customer Success mean at Databricks?

Customer Success is a partnership between Databricks and our customers that enables them to unlock the full potential of Databricks products to ultimately realize their business outcomes. There are multiple teams – product, customer support, community and so forth – that form the customer success organization. This blog post will highlight one of the most customer-facing roles in our organization (we like to think of them as the “quarterbacks” at team Databricks): customer success engineers (CSE).

The team at the 2022 company kickoff

A CSE is the customer’s most trusted advisor. They are a highly technical breed of Databricks experts, who come from diverse backgrounds, such as consulting, FAANGs, and academia, that all share a common passion for customer success. Take myself as an example. Before joining Databricks, I was a Data Engineering Manager at Accenture. I designed, developed, and productionized complex data and analytics solutions for various Fortune 500 companies and government entities in the healthcare, telecommunication, insurance, and financial spaces.

Many CSEs join Databricks and find that their previous roles, while they may not be specifically customer-success centric, require the same skill sets that make the transition quite seamless. CSEs possess a wide range of duties, which we’ll get into below; but overall, they must be customer obsessed, versatile and have an appetite for learning new technologies.

But what exactly does day-to-day life look like for a CSE at Databricks? Here’s a snapshot of what to expect:

Proactively guide and advise customers – our engineering team is constantly rolling out new innovations at a pace that can be overwhelming if not enabled effectively. CSEs work to understand each customer’s individual needs and then curate product recommendations and private preview access to new features. For example, I recently worked with a customer to adopt Delta Lake. I began by coordinating a series of enablement sessions to explain the inherent optimizations native to the storage format. We embarked on a proof of concept (POC) to test performance speed on a 1.6 terabyte dataset currently in Parquet and the results were remarkable. The customer was able to reduce their average query runtime by 500%, from 20 mins to 4 mins simply by running 2 lines of optimizations: Z-Order and Optimize.

Provide technical guidance and orchestrate help from other(SMEs– most CSEs have technical backgrounds and are equipped to handle technical queries from our customers. But we don’t work in silo, so when a question beyond our scope arises, we collaborate with our army of Specialized & Resident Solution Architects (SSA, RSA), who are experts in many subject areas: streaming, machine learning, integrations, and of course: Apache Spark™! Many of my customers specifically choose to build their architecture with Databricks because our founders also built Spark, so naturally, we have some of the most renowned Spark experts available in the industry, cough cough Matei.

Track and communicate status – one of the key responsibilities of CSEs is to work with customers to understand their specific needs and productionize their use cases, and needless to say: we go to great lengths to ensure success. For example, a new customer of mine specifically told us, “we decided to go with Databricks because we need your Spark expertise to process Petabytes of HTML data.” To deliver on that promise, we’ve hosted enablement sessions that cover Spark optimizations and tuning, provide designated SSA resources to design their data architecture, and even had RSAs spend weeks productionizing their most important data engineering pipelines.

Onboard teams through enablement sessions and workshops – CSEs craft custom enablement plans for each customer to assist with Databricks adoption. This includes helping the team access the Databricks academy, delivering enablement sessions and workshops that cover Databricks fundamentals to more advanced topics such as Databricks administration, Cost Optimizations, to MLflow.

While CSEs do have a lot of responsibilities, our actions are highly impactful to our customers that are trying to solve the world’s toughest data problems. As our modern society doubles the amount of data collected each year, helping our customers harness their data and unlock their use cases on the Lakehouse platform has been fulfilling nonetheless.

Databricks Lakehouse Platform offering

This is just the beginning – Join us!

An integral part of being a customer success engineer is working and aligning with multiple teams across the organization. This includes product managers, engineering, marketing, solutions architects, account executives, and more. Working with such a diverse group of teams also allows us to learn from the very best in the business, and I think that is a rare and amazing benefit of working at a company like Databricks. If you are looking to learn something new or expand on an already established skill, chances are you can easily find someone to help you along the way.

At the same time, leveraging the perspectives and knowledge of these various groups allows us to empower our customers with the best solutions, practices, and support. Our customers are on a journey to solve the toughest problems that face their business, and we are a direct link to helping them get there. We work with customers across almost every industry vertical, and there is no shortage of bleeding-edge problems to partner on and solve together.

On that note, we are hiring! If this blog has piqued your interest and you are interested in rewarding career opportunity, please apply on our Careers at Databricks page!

If this blog has piqued your interest and you are interested in embarking on a challenging and rewarding career opportunity please apply on our Careers at Databricks page!

--

Try Databricks for free. Get started today.

The post Day In the Life of A Customer Success Engineer appeared first on Databricks.

Five Simple Steps for Implementing a Star Schema in Databricks With Delta Lake

$
0
0

Most data warehouse developers are very familiar with the ever-present star schema. Introduced by Ralph Kimball in the 1990s, a star schema is used to denormalize business data into dimensions (like time and product) and facts (like transactions in amounts and quantities). A star schema efficiently stores data, maintains history and updates data by reducing the duplication of repetitive business definitions, making it fast to aggregate and filter.

The common implementation of a star schema to support business intelligence applications has become so routine and successful that many data modelers can practically do them in their sleep. At Databricks, we have produced so many data applications and are constantly looking for best practice approaches to serve as a rule of thumb, a basic implementation that is guaranteed to lead us to a great outcome.

Just like in a traditional data warehouse, there are some simple rules of thumb to follow on Delta Lake that will significantly improve your Delta star schema joins.

Here are the basic steps to success:

  1. Use Delta Tables to create your fact and dimension tables
  2. Optimize your file size for fast file pruning
  3. Create a Z-Order on your fact tables
  4. Create Z-Orders on your dimension key fields and most likely predicates
  5. Analyze Table to gather statistics for Adaptive Query Execution Optimizer

1. Use Delta Tables to create your fact and dimension tables

Delta Lake is an open storage format layer that provides the ease of inserts, updates, deletes, and adds ACID transactions on your data lake tables, simplifying maintenance and revisions. Delta Lake also provides the ability to perform dynamic file pruning to optimize for faster SQL queries.

The syntax is simple on Databricks Runtimes 8.x and newer where Delta Lake is the default table format. You can create a Delta table using SQL with the following:

CREATE TABLE MY_TABLE (COLUMN_NAME STRING)

Before the 8.x runtime, Databricks required creating the table with the USING DELTA syntax.

Sample star schema and dimensional attributes typically used Delta Lake tables.

2. Optimize your file size for fast file pruning

Two of the biggest time sinks in an Apache Spark™ query are the time spent reading data from cloud storage and the need to read all underlying files. With data skipping on Delta Lake, queries can selectively read only the Delta files containing relevant data, saving significant time. Data skipping can help with static file pruning, dynamic file pruning, static partition pruning and dynamic partition pruning.

One of the first things to consider when setting up data skipping is the ideal data file size – too small and you will have too many files (the well-known “small-file problem”); too large and you won’t be able to skip enough data.

A good file size range is 32-128MB (1024*1024*32 = 33554432 for 32MB of course). Again, the idea is that if the file size is too big, the dynamic file pruning will skip to the right file or files, but they will be so large it will still have a lot of work to do. By creating smaller files, you can benefit from file pruning and minimize the I/O retrieving the data you need to join.

You can set the file size value for the entire notebook in Python:

spark.conf.set("spark.databricks.delta.targetFileSize", 33554432)

Or in SQL:

SET spark.databricks.delta.targetFileSize=33554432

Or you can set it only for a specific table using:

ALTER TABLE (database).(table) SET TBLPROPERTIES (delta.targetFileSize=33554432)

If you happen to be reading this article after you have already created tables, you can still set the table property for the file size and, when optimizing and creating the ZORDER, the files will be proportioned to the new file size. If you have already added a ZORDER, you can add and/or remove a column to force a re-write before arriving at the final ZORDER configuration. Read more about ZORDER in step 3.

More complete documentation can be found here, and for those who like Python or Scala in addition to SQL, the full syntax is here.

As Databricks continues to add features and capabilities, we can also Auto Tune the file size based on the table size. For smaller databases, the above setting will likely provide better performance but for larger tables and/or just to make it simpler, you can follow the guidance here and implement the delta.tuneFileSizesForRewrites table property.

3. Create a Z-Order on your fact tables

To improve query speed, Delta Lake supports the ability to optimize the layout of data stored in cloud storage with Z-Ordering.
To improve query speed, Delta Lake supports the ability to optimize the layout of data stored in cloud storage with Z-Ordering, also known as multi-dimensional clustering. Z-Orders are used in similar situations as clustered indexes in the database world, though they are not actually an auxiliary structure. A Z-Order will cluster the data in the Z-Order definition, so that rows like column values from the Z-order definition are collocated in as few files as possible.

Most database systems introduced indexing as a way to improve query performance. Indexes are files, and thus as the data grows in size, they can become another big data problem to solve. Instead, Delta Lake orders the data in the Parquet files to make range selection on object storage more efficient. Combined with the stats collection process and data skipping, Z-Order is similar to seek vs. scan operations in databases, which indexes solved, without creating another compute bottleneck to find the data a query is looking for.

For Z-Ordering, the best practice is to limit the number of columns in the Z-Order to the best 1-4. We chose the foreign keys (foreign keys by use, not actually enforced foreign keys) of the 3 largest dimensions which were too large to broadcast to the workers.

OPTIMIZE MY_FACT_TABLE 
  ZORDER BY (LARGEST_DIM_FK, NEXT_LARGEST_DIM_FK, ...)

Additionally, if you have tremendous scale and 100’s of billions of rows or Petabytes of data in your fact table, you should consider partitioning to further improve file skipping. Partitions are effective when you are actively filtering on a partitioned field.

4. Create Z-Orders on your dimension key fields and most likely predicates

Although Databricks does not enforce primary keys on a Delta table, since you are reading this blog, you likely have dimensions and a surrogate key exists – one that is an integer or big integer and is validated and expected to be unique.

One of the dimensions we were working with had over 1 billion rows and benefitted from the file skipping and dynamic file pruning after adding our predicates into the Z-Order. Our smaller dimensions also had Z-Orders on the dimension key field and were broadcasted in the join to the facts. Similar to the advice on fact tables, limit the number of columns in the Z-Order to the 1-4 fields in the dimension that are most likely to be included in a filter in addition to the key.

OPTIMIZE MY_BIG_DIM 
  ZORDER BY (MY_BIG_DIM_PK, LIKELY_FIELD_1, LIKELY_FIELD_2)

5. Analyze Table to gather statistics for Adaptive Query Execution Optimizer

One of the major advancements in Apache Spark™ 3.0 was the Adaptive Query Execution, or AQE for short. As of Spark 3.0, there are three major features in AQE, including coalescing post-shuffle partitions, converting sort-merge join to broadcast join, and skew join optimization. Together, these features enable the accelerated performance of dimensional models in Spark.

In order for AQE to know which plan to choose for you, we need to collect statistics about the tables. You do this by issuing the ANALYZE TABLE command. Customers have reported that collecting table statistics has significantly reduced query execution for dimensional models, including complex joins.

ANALYZE TABLE MY_BIG_DIM COMPUTE STATISTICS FOR ALL COLUMNS

Conclusion

By following the above guidelines, organizations can reduce query times – in our example, from 90 seconds to 10 seconds on the same cluster. The optimizations greatly reduced the I/O and ensured that we only processed the correct content. We also benefited from the flexible structure of Delta Lake in that it would both scale and handle the types of queries that will be sent ad hoc from the Business Intelligence tools.

In addition to the file skipping optimizations mentioned in this blog, Databricks is investing heavily in improving the performance of Spark SQL queries with Databricks Photon. Learn more about Photon and the performance boost it will provide to all of your Spark SQL queries with Databricks.

Customers can expect their ETL/ELT and SQL query performance to improve by enabling Photon in the Databricks Runtime. Combining the best practices outlined here, with the Photon-enabled Databricks Runtime, you can expect to achieve low latency query performance that can outperform the best cloud data warehouses.

Build your star schema database with Databricks SQL today.

--

Try Databricks for free. Get started today.

The post Five Simple Steps for Implementing a Star Schema in Databricks With Delta Lake appeared first on Databricks.
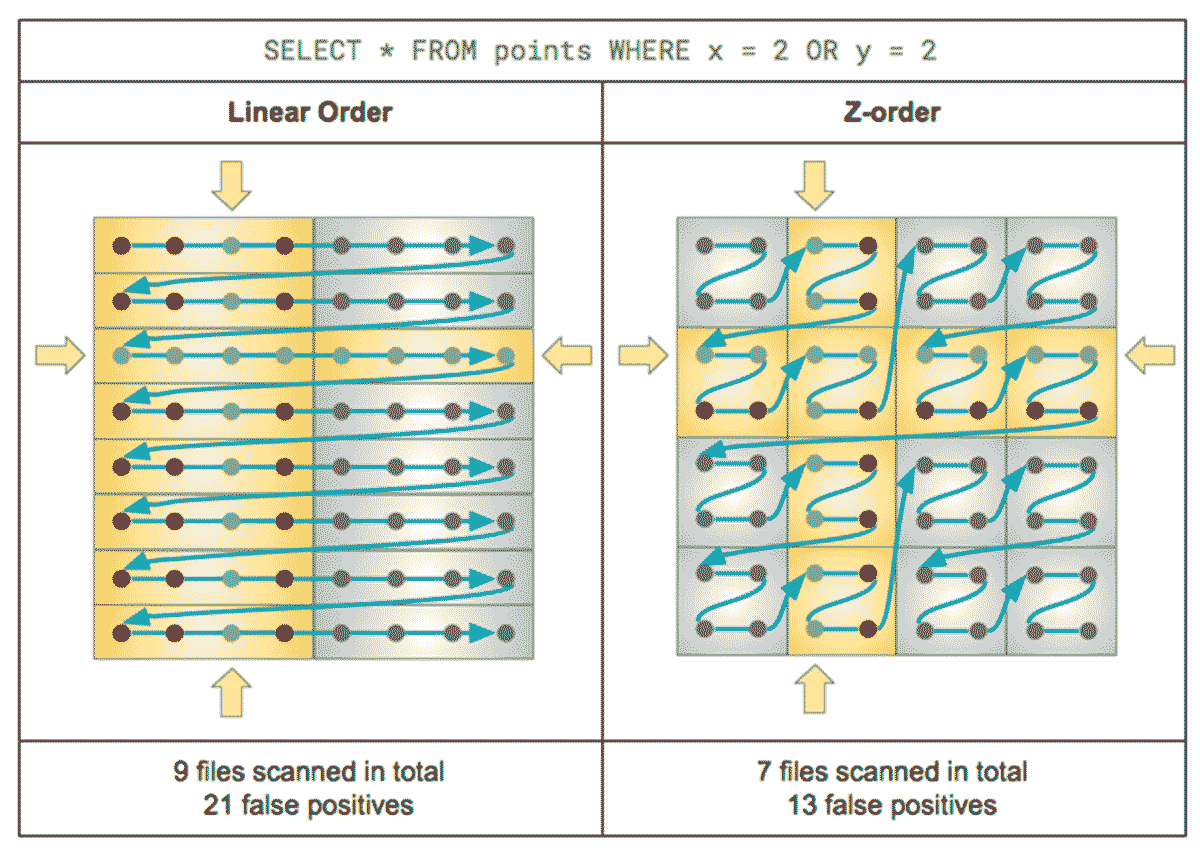
Viewing all 1874 articles
Browse latest View live