Quantcast
Channel: Databricks
Viewing all 1874 articles
Browse latest View live

Design Patterns for Real-time Insights in Financial Services

$
0
0

Personalization is a competitive differentiator for most every financial services institution (FSIs, for short), from banking to insurance and now investment management platforms. While every FSI wants to offer intelligent and real-time personalization to customers, the foundations are often glossed over or implemented with incomplete platforms, leading to stale insights, long time-to-market, and loss of productivity due to the need to glue streaming, AI, and reporting services together.

This blog will demonstrate how to lay a robust foundation for real-time insights for financial services use cases with the Databricks Lakehouse platform, from OLTP database Change Data Capture (CDC) data to reporting dashboard. Databricks has long supported streaming, which is native to the platform. The recent release of Delta Live Tables (DLT) has made streaming even simpler and more powerful with new CDC capabilities. We have covered a guide to CDC using DLT in a recent comprehensive blog. In this blog, we focus on streaming for FSIs and show how these capabilities help streamline new product differentiators and internal insights for FSIs.

Why streaming ingestion is critical

Before getting into technical details, let’s discuss why Databricks is best for personalization use cases, and specifically why implementing streaming should be the first step. Many Databricks customers who are implementing Customer 360 projects or full-funnel marketing strategies typically have the base requirements below. Note the temporal (time-related) data flow.

FSI Data Flow and Requirements

  1. User app saves and updates data such as clickstream, user updates, and geolocation data – requires operational databases
  2. Third party behavioral data is delivered incrementally via object storage or is available in a database in a cloud account – requires streaming capabilities to incrementally add/update/delete new data in single source of truth for analytics
  3. FSI has an automated process to export all database data including user updates, clickstream, and user behavioral data into data lake – requires Change Data Capture (CDC) ingestion and processing tool, as well as support for semi-structured and unstructured data
  4. Data engineering teams run automated data quality checks and ensure the data is fresh – requires data quality tool and native streaming
  5. Data science teams use data for next best action or other predictive analytics – requires native ML capabilities
  6. Analytics engineers and Data analysts will materialize data models and use data for reporting – requires dashboard integration and native visualization

The core requirements here are data freshness for reporting, data quality to maintain integrity, CDC ingestion, and ML-ready data stores. In Databricks, these map directly to Delta Live Tables (notably Auto Loader, Expectations, and DLT’s SCD Type I API), Databricks SQL, and Feature Store. Since reporting and AI-driven insights depend upon a steady flow of high-quality data, streaming is the logical first step to master.

 Illustration depicting the 360° customer view and streaming behavioral, transactional and other data needed for personalization and financial services decision-making. Personalization can be derived from past purchases on concerts or sporting events, for example.

Consider, for example, a retail bank wanting to use digital marketing to attract more customers and improve brand loyalty. It is possible to identify key trends in customer buying patterns and send personalized communication with exclusive product offers in real time tailored to the exact customer needs and wants. This is a simple, but an invaluable use case that’s only possible with streaming and change data capture (CDC) – both capabilities required to capture changes in consumer behavior and risk profiles.

For a sneak peak at the types of data we handle in our reference DLT pipeline, see the samples below. Notice the temporal nature of the data – all banking or lending systems have time-ordered transactional data, and a trusted data source means having to incorporate late-arriving and out-of-order data. The core datasets shown include transactions from, say, a checking account (Figure 2), customer updates, but also behavioral data (Figure 3) which may be tracked from transactions or upstream third-party data.

Figure 2 - Sample per customer checking transactions over time data invaluable for constructing personalized banking experiences.

Figure 3 - Sample per customer spending behavior over time data invaluable for constructing personalized banking experiences.

Getting started with Streaming

In this section, we will demonstrate a simple end-to-end data flow so that it is clear how to capture continuous changes from transactional databases and store them in a Lakehouse using Databricks streaming capabilities.

Our starting point are records mocked up from standard formats from transactional databases. The diagram below provides an end-to-end picture of how data might flow through an FSI’s infrastructure, including the many varieties of data which ultimately land in Delta Lake, are cleaned, and summarized and served in a dashboard. There are three main processes mentioned in this diagram, and in the next section we’ll break down some prescriptive options for each one.

End-to-end picture of how data might flow through a financial services company’s firm’s infrastructure, illustrating the myriad data which ultimately land in Delta Lake, and then cleaned, and summarized and served in a dashboard.

End-to-end architecture of how data might flow through an FSI’s infrastructure, illustrating the myriad data which ultimately land in Delta Lake, is cleaned, and summarized and served in a dashboard.

Process #1 – Data ingestion

Native structured streaming ingestion option

With the proliferation of data that customers provide via banking and insurance apps, FSIs have been forced to devise strategies around collecting this data for downstream teams to consume for various use cases. One of the most basic decisions these companies face is how to capture all changes from app services which customers have in production: from users, to policies, to loan apps and credit card transactions. Fundamentally, these apps are backed by transactional data stores, whether it’s MySQL databases or more unstructured data residing in NoSQL databases such as MongoDB.

Luckily, there are many open source tools, like Debezium, that can ingest data out of these systems. Alternatively, we see many customers writing their own stateful clients to read in data from transactional stores, and write to a distributed message queue like a managed Kafka cluster. Databricks has tight integration with Kafka, and a direct connection along with a streaming job is the recommended pattern when the data needs to be as fresh as possible. This setup enables near real-time insights to businesses, such as real-time cross-sell recommendations or real-time views of loss (cash rewards effect on balance sheets). The pattern is as follows:

  1. Set up CDC tool to write change records to Kafka
  2. Set up Kafka sink for Debezium or other CDC tool
  3. Parse and process Change Data Capture (CDC) records in Databricks using Delta Live Tables, first landing data directly from Kafka into Bronze tables

Considerations

Pros
  • Data arrives continuously with lower latencies, so consumers get results in near real-time without relying on batch updates
  • Full control of the streaming logic
  • Delta Live Tables abstracts cluster management away for the bronze layer, while enabling users to efficiently manage resources by offering auto-scaling
  • Delta Live Tables provides full data lineage, and seamless data quality monitoring for the landing into bronze layer
Cons
  • Directly reading from Kafka requires some parsing code when landing into the Bronze staging layer
  • This relies on extra third party CDC tools to extract data from databases and feed into a message store rather than using a tool that establishes a direct connection

Partner ingestion option

The second option for getting data into a dashboard for continuous insights is Databricks Partner Connect, the broad network of data ingestion partners that simplify data ingestion into Databricks. For this example, we’ll ingest data via a Delta connector created by Confluent, a robust managed Kafka offering which integrates closely with Databricks. Other popular tools like Fivetran & Arcion have hundreds of connectors to core transactional systems.

Partner Connect on Databricks

Both options abstract away much of the core logic for reading raw data and landing it in Delta Lake through the use of COPY INTO commands. In this pattern, the following steps are performed:

  1. Set up CDC tool to write change records to Kafka (same as before)
  2. Set up the Databricks Delta Lake Sink Connector for Confluent Cloud and hook this up to the relevant topic

The main difference between this option and the native streaming option is the use of Confluent’s Delta Lake Sink Connector. See the trade-offs for understanding which pattern to select.

Considerations

Pros
  • Low-code CDC through partner tools supports high speed replication of data from on-prem legacy sources, databases, and mainframes (e.g. Fivetran, Arcion, and others with direct connection to databases)
  • Low-code data ingestion for data platform teams familiar with streaming partners (such as Confluent Kafka) and preferences to land data into Delta Lake without the use of Apache Spark™
  • Centralized management of topics and sink connectors in Confluent Cloud (similarly with Fivetran)
Cons
  • Less control over data transformation and payload parsing with Spark and third party libraries in the initial ETL stages
  • Databricks cluster configuration required for the connector

File-based ingestion

Many data vendors — including mobile telematics providers, tick data providers, and internal data producers — may deliver files to clients. To best handle incremental file ingestion, Databricks introduced Auto Loader, a simple, automated streaming tool which tracks state for incremental data such as intraday feeds for trip data, trade-and-quote (TAQ) data, or even alternative data sets such as sales receipts to predict earnings forecasts.

Auto Loader is now available to be used in the Delta Live Tables pipelines, enabling you to easily consume hundreds of data feeds without having to configure lower level details. Auto Loader can scale massively, handling millions of files per day with ease. Moreover, it is simple to use within the context of Delta Live Tables APIs (see SQL example below):

CREATE INCREMENTAL LIVE TABLE customers
AS SELECT * FROM cloud_files("/databricks-datasets/retail-org/customers/", "csv", map("delimiter", "\t"))

Process #2 – Change Data Capture

Change Data Capture solutions are necessary since they ultimately save changes from core systems to a centralized data store without imposing additional stress on transactional databases. With abundant streams of digital data, capturing changes to customers’ behavior are paramount to personalizing the banking or claims experience.

From a technical perspective, we are using Debezium as our highlighted CDC tool. Of importance to note is the sequence key, which is Debezium’s datetime_updated epoch time, which Delta Live Tables (DLT) uses to sort through records to find the latest change and apply to the target table in real time. Again, because a user journey has an important temporal component, the APPLY CHANGES INTO functionality from DLT is an elegant solution since it abstracts the complexity of having to update the user state – DLT simply updates the state in near real-time with a one-line command in SQL or Python (say, updating customer preferences in real-time from 3 concert events attended to 5, signifying an opportunity for a personalized offer).

In the code below, we are using SQL streaming functionality which allows us to specify a continuous stream landing into a table to which we apply changes to see the latest customer or aggregate update. See the full pipeline configuration below. The full code is available here.

Here are some basic terms to note:

  • The STREAMING keyword indicates a table (like customer transactions) which accept incremental insert/updates/deletes from a streaming source (e.g. Kafka)
  • The LIVE keyword indicates the dataset is internal, meaning it has already been saved using the DLT APIs and comes with all the auto-managed capabilities (including auto-compaction, cluster management, and pipeline configurations) that DLT offers
  • APPLY CHANGES INTO is the elegant CDC API that DLT offers, handling out-of-order and late-arriving data by maintaining state internally — without users having to write extra code or SQL commands.

Sample queries illustrating how simple it is to parse change feeds from a CDC format and apply changes into a target Delta Lake table.

CREATE STREAMING LIVE TABLE customer_patterns_silver_copy
(
 CONSTRAINT customer_id EXPECT (customer_id IS NOT NULL) ON VIOLATION DROP ROW
)
TBLPROPERTIES ("quality" = "silver")
COMMENT "Cleansed Bronze customer view (i.e. what will become Silver)"
AS SELECT json.payload.after.* , json.payload.op
FROM stream(live.customer_patterns_bronze);


APPLY CHANGES INTO live.customer_patterns_silver
FROM stream(live.customer_patterns_silver_copy)
 KEYS (customer_id)
 APPLY AS DELETE WHEN op = "d"
 SEQUENCE BY datetime_updated;

Process #3 – Summarizing Customer Preferences and Simple Offers

To cap off the simple ingestion pipeline above, we now highlight a Databricks SQL dashboard to show what types of features and insights are possible with the Lakehouse. All of the metrics, segments, and offers seen below are produced from the real-time data feeds mocked up for this insights pipeline. These can be scheduled to refresh every minute, and more importantly, the data is fresh and ML-ready. Metrics to note are customer lifetime, prescriptive offers based on a customer’s account history and purchasing patterns, and cash back losses and break even thresholds. Simple reporting on real-time data can highlight key metrics that will inform how to release a specific product, such as cash back offers. Finally, reporting dashboards (Databricks or BI partners such as Power BI or Tableau) can surface these insights; when AI insights are available, they can easily be added to such a dashboard since the underlying data is centralized in one Lakehouse.

Databricks SQL dashboard showing how streaming hydrates the Lakehouse and produces actionable guidance on offer losses, opportunities for personalized offers to customers, and customer favorites for new products

Databricks SQL dashboard showing how streaming hydrates the Lakehouse and produces actionable guidance on offer losses, opportunities for personalized offers to customers, and customer favorites for new products

Conclusion

This blog highlights multiple facets of the data ingestion process, which is important to support various personalization use cases in financial services. More importantly, Databricks supports near real-time use cases natively, offering fresh insights and abstracted APIs (Delta Live Tables) for handling change data, supporting both Python and SQL out-of-the-box.

With more banking and insurance providers incorporating more personalized customer experiences, it will be critical to support the model development but more importantly, create a robust foundation for incremental data ingestion. Ultimately, Databricks’ Lakehouse platform is second-to-none in that it delivers both streaming and AI-driven personalization at scale to deliver higher CSAT/NPS, lower CAC/churn, and happier and more profitable customers.

To learn more about the Delta Live Tables methods applied in this blog, find all the sample data and code in this GitHub repository.

--

Try Databricks for free. Get started today.

The post Design Patterns for Real-time Insights in Financial Services appeared first on Databricks.


TD Modernizes Data Environment With Databricks to Drive Value for Its Customers

$
0
0

Since 1955, TD Bank Group has aimed to give customers and communities the confidence to thrive in a changing world. While that order has grown taller and more complex with each passing decade, TD has consistently risen to the challenge. 

This Q&A — between Junta Nakai, Global Head – Financial Services & Sustainability GTM at Databricks and Jonathan Hollander, Vice President, Enterprise Data Technology Platforms at TD Bank — highlights TD’s technology transformation journey and why they are transitioning to a new, modern data estate with Delta Lake and the Azure cloud, designed to boost analytical capabilities to help power enhanced customer experiences. 

Through this transformation, they have been able to simplify their technology stack and put themselves in a position to extract the most value from their data for the betterment of their customers. 

Junta: Tell us about the genesis of TD’s journey toward the cloud and what the drivers were that led you to this modernization effort?

Jonathan: Like many companies, TD was at an inflection point when we decided to establish a new data environment on the cloud. Based on the direction of the industry, we knew we would be better served to invest our capital in the transition to the cloud and the modernization of our development environments, which in addition would provide enhanced tooling and capabilities to our business end-users.

Junta: Can you share how you are currently using Delta Lake and the value the architecture has provided your organization?

Jonathan: Today, we’re predominantly leveraging Databricks in a couple of key ways: first, the creation of highly performant and reliable data pipelines for ingestion and data transformation at large scale. Second, we’re utilizing Delta Lake, which allows us to provide a single source of truth for our data. 

Junta: How has the ability to federate your data allowed TD to more easily support downstream analytics and ML needs?

Jonathan: By centralizing our data, we will be able to give teams fast and secure access, enabling them to feed accurate and immediate analytics. We have 15,000 data pipelines in place that feed data to our Enterprise Data Lake and Curated assets, and we leverage a leading data visualization tool, so that our business community can access the latest and most accurate data through interactive dashboards and reports for better decision making. We’ve also built out a centralized Data-as-a-Service platform team that’s responsible for ingesting data from our systems of record into our Enterprise Data Lake, for the development of Curated data sets to support our business segments and enterprise functions, and to administer the tooling that supports data, analytics and reporting across the enterprise.

Junta: What’s been the most unexpected benefit of moving to Delta Lake?

Jonathan: That would be Recruiting. Competition for tech talent is at an all-time high and data engineers want to use the latest and greatest technologies. The Databricks platform has a unique ability to enable collaboration between different data teams working on exciting use cases that will help attract to TD the talented people we need to continue accelerating innovation. 

Junta: Looking ahead, how will data analytics and ML continue to transform your business and what role will Databricks and the cloud have in that journey?

Jonathan: With Delta Lake and Azure as our foundation, TD is in a prime position to derive critical and real-time business decisions and unlock new customer insights. Next steps toward this vision include enhanced self-service analytics capabilities to empower our business stakeholders and analysts to make data-driven decisions to streamline operations, identify new market opportunities, and mitigate risk for our customers. Furthermore, making Databricks fully available across data engineering, data science and the business will fuel new cutting-edge use cases to boost operational efficiencies across our business and new customer-centric innovations — from personalized customer support to marketing products and services — that increase levels of customer engagement and drive value.

Interested in learning about how FSIs are using Databricks? Read about our Lakehouse for Financial Services.

--

Try Databricks for free. Get started today.

The post TD Modernizes Data Environment With Databricks to Drive Value for Its Customers appeared first on Databricks.

Arcuate – Machine Learning Model Exchange With Delta Sharing and MLflow

$
0
0

Stepping into this brave new digital world we are certain that data will be a central product for many organizations. The way to convey their knowledge and their assets will be through data and analytics. During the Data + AI Summit 2021, Databricks announced Delta Sharing, the world’s first open protocol for secure and scalable real-time data sharing. This simple REST secure data sharing protocol can become a differentiating factor for your data consumers and the ecosystem you are building around your data products.

Delta Sharing, the world's first open protocol for secure and scalable real-time data sharing.

Since the preview launch, we have seen tremendous engagement from customers across industries to collaborate and develop a data-sharing solution fit for all purposes and open to all. Customers have already shared petabytes of data using the Delta Sharing REST APIs. Through our customer conversations, there is a lot of anticipation of how Delta Sharing can be extended to non-tabular assets, such as machine learning experiments and models.

Arcuate – a Databricks Labs project that extends Delta Sharing for ML

Platforms like MLflow have emerged as a go-to option for many data scientists, ensuring smooth transition/experience when managing the machine learning lifecycle. MLflow is an open-source platform developed by Databricks to manage the ML lifecycle, including experimentation, reproducibility, deployment, and a central model registry.

Due to MLflow ubiquity, Arcuate combines MLflow with Delta Lake to leverage Delta Sharing capabilities to enable machine learning models exchange.

Using Delta Sharing also allows Arcuate to share other relevant metadata such as training parameters, model accuracy, artifacts, etc.

The project name takes inspiration from the term, arcuate delta – the wide fan-shaped river delta. We believe that enabling model exchange will have a wide impact on many digitally connected industries.

How Arcuate works with Delta Sharing to share machine learning models

How it works

Arcuate is provided as a Python library that can be installed on a Databricks cluster, or on your local machine. It integrates directly with MLflow, offering options to extract either an MLflow experiment, or an MLflow model into a Delta table. These tables are then shared via Delta Sharing (how it works), allowing recipients to load them into their own MLflow server.

For simplicity, Arcuate comes with two sets of APIs for both providers & recipients:

  • Python APIs to be used in any Python programs.
  • IPython magic %arcuate that provides SQL syntax in a notebook.

The end-to-end workflow would look like this:

  • Experiment or train models in any environment (including Databricks), store it in MLflow
  • Add an MLflow experiment to a Delta Sharing share:
# export the experiment experiment_name to table_name, and add it to share_name
export_experiments(experiment_name, table_name, share_name)

  • Add an MLflow model to a Delta Sharing share:
  • # export the model model_name to table_name, and add it to share_name
    export_models(model_name, table_name, share_name)  
    
    
  • Recipients can then load MLflow models/experiments seamlessly:
  • df = delta_sharing.load_as_pandas(delta_sharing_coordinate)
    
    # import the shared table as experiment_name
    import_experiments(df, experiment_name)
    
    
    df = delta_sharing.load_as_pandas(delta_sharing_coordinate)
    
    # import the model
    import_models(df, model_name)


    Roadmap

    This first version of Arcuate is just a start. As we develop the project, we can extend the implementation to sharing other objects, such as dashboards or arbitrary files. We believe that the future of data sharing is open, and we are thrilled to bring this approach to other sharing workflows.

    Getting started with Arcuate

    With Delta Sharing, for the first time ever, we have a data sharing protocol that is truly open. Now with Arcuate, we are able to have an open ML model sharing protocol.

    We will soon release Arcuate as a Databricks Labs project, so please keep an eye out for it. To try out the open source project Delta Sharing release, follow the instructions at delta.io/sharing. Or, if you are a Databricks customer, sign up for updates on our service. We are very excited to hear your feedback!

    --

    Try Databricks for free. Get started today.

    The post Arcuate – Machine Learning Model Exchange With Delta Sharing and MLflow appeared first on Databricks.

    Detecting Stale, Missing, Corrupted, and Anomalous Data in Your Lakehouse With Databricks and Anomalo

    $
    0
    0

    This is a collaborative post from Databricks and Anomalo. We thank Amy Reams, VP Business Development, Anomalo, for her contributions.

     
    An organization’s data quality erodes naturally over time as the complexity of the data increases, dependencies are introduced in code, and third-party data sources are added. Databricks customers can now use Anomalo, the complete data quality platform, to understand and monitor the data quality health of their tables.

    Unlike traditional rules-based approaches to data quality, Anomalo provides automated checks for data quality using machine learning, which automatically adapts over time to stay resilient as your data and business evolves. When the system detects an issue, it provides a rich set of visualizations to contextualize and explain the issue, as well as an instant root-cause analysis that points to the likely source of the problem. This means your team spends more time making data-driven decisions, and less time investigating and fire-fighting issues with your data.

    Furthermore, Anomalo is designed to make data health visible and accessible for all stakeholders: from data scientists and engineers, to BI analysts, to executives. Anyone can easily add no-code rules and track key metrics for datasets they care about. Anomalo lets you investigate individual rows and columns, or get a high level summary of the health for your entire lakehouse.

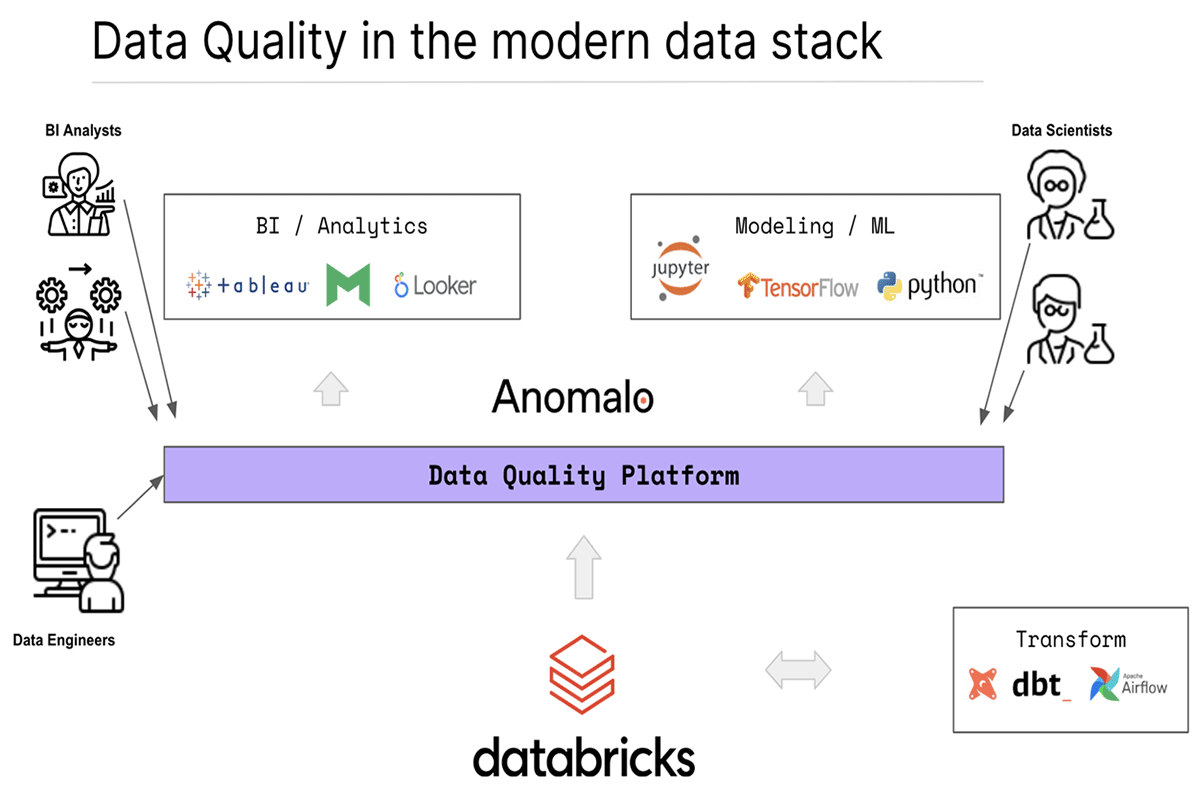
    Data quality in the modern data stack, as exemplified by Databricks and Anomolo.

    Monitoring data quality in your Lakehouse tables

    The Databricks Lakehouse Platform combines the best elements of data lakes and data warehouses to deliver the reliability, strong data governance, and performance of data warehouses with the openness, flexibility, and machine learning support of data lakes.

    By connecting to Databricks, Anomalo brings a unifying layer that ensures you can trust the quality of your data before it is consumed by various business intelligence and analytics tools or modeling and machine learning frameworks. Anomalo is focused on providing transparent monitoring and insights into the individual tables in your lakehouse.

    1. Connecting Anomalo to Databricks

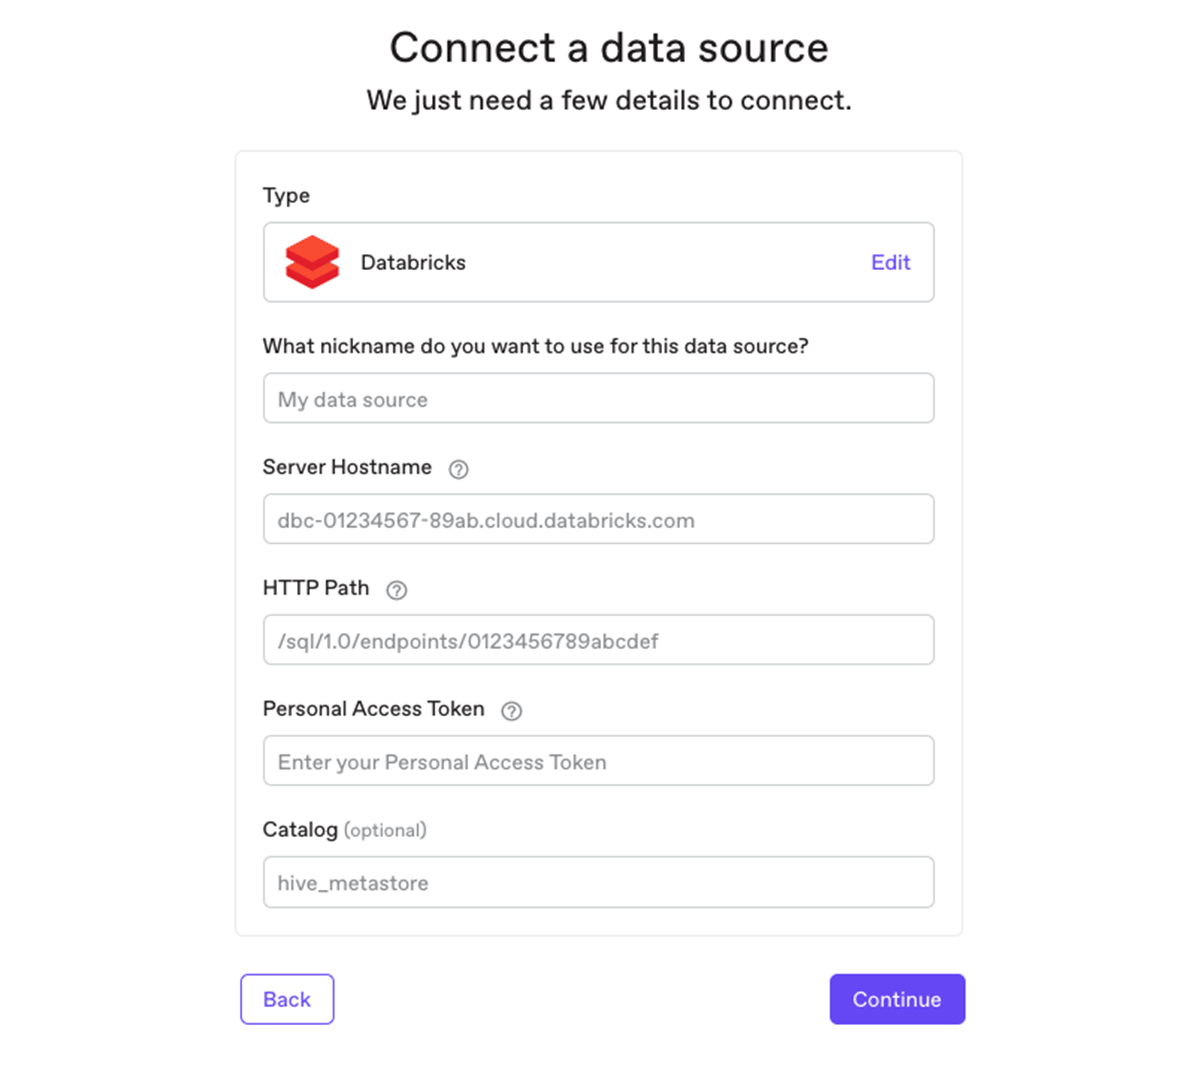
    Connecting Anomalo to your Databricks Lakehouse Platform is as easy as adding a new data source in Anomalo in just a few clicks.

    Connecting Anomalo to your Databricks Lakehouse Platform is as easy as adding a new data source in Anomalo in just a few clicks.

    2. Identifying missing and anomalous data

    Once Anomalo is connected to Databricks, you can configure any table to monitor data quality issues. Anomalo will then automatically monitor tables for four key characteristics:

    • data freshness,
    • data volume,
    • missing data, and
    • table anomalies.

    Freshness and volume checks look for data that’s delivered late, or if the amount of data received is less than usual. Missing data might occur if a segment of data was dropped or null data has spiked in a column. Table anomalies, or anomaly detection, include duplicate data, changes in the schema of the table, as well as other significant changes inside the raw data, such as changes in continuous distributions, categorical values, time durations, or even relationships between columns.

    Once connected to Databricks, data teams can configure any table for Anomalo to automatically monitor for missing and anomalous data.

    3. Setting up no-code validation rules and key metrics

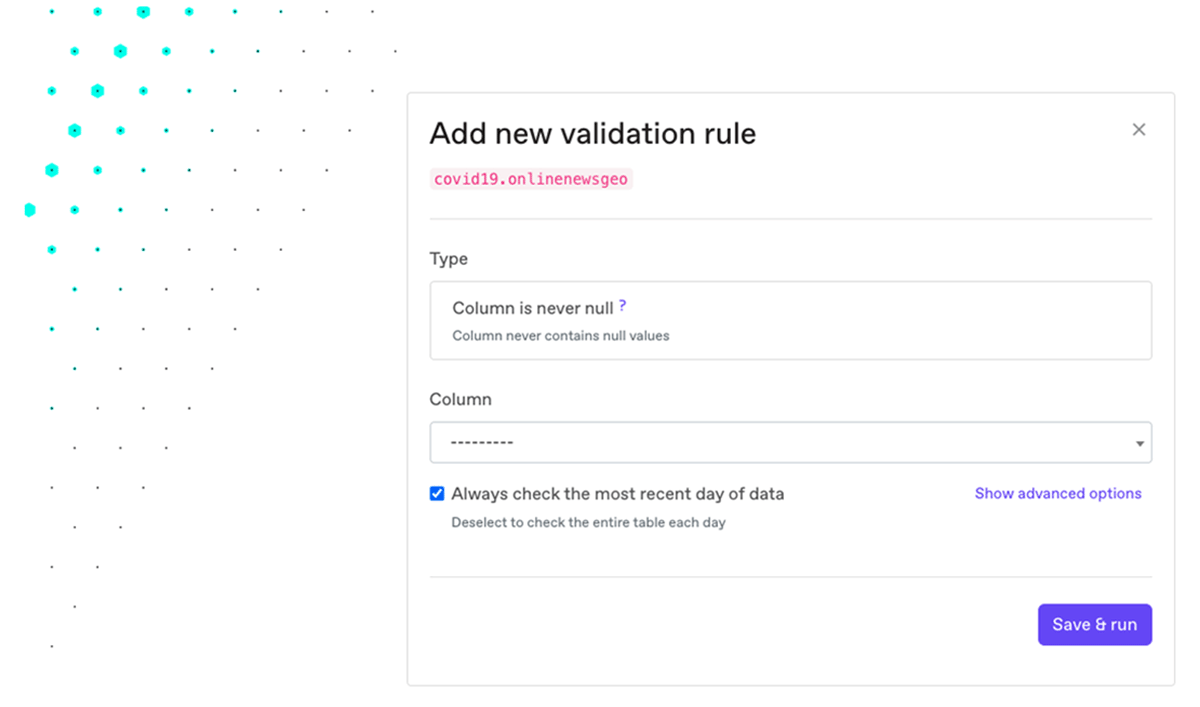
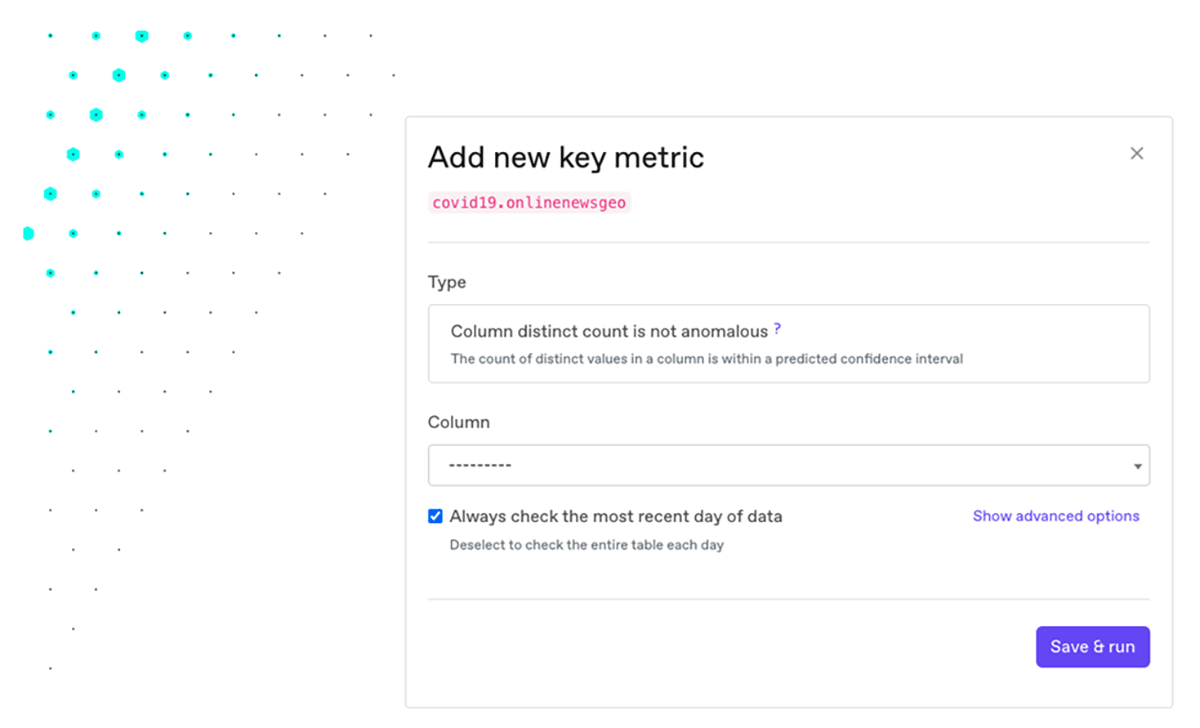
    Besides the automatic checks that come built into Anomalo, anyone can add their own checks with no code (or with SQL). This lets a domain expert introduce constraints that certain data should conform to, even if they’re not an engineer. You can also add key metrics that are important for your company, or metrics that show whether the data is trending in the right direction.

    Through the Anomalo UI, any internal user can quickly specify data requirements and KPIs. Arbitrarily complex checks can also be defined with SQL.

    Through the UI, any internal user can quickly specify data requirements and KPIs. Arbitrarily complex checks can also be defined with SQL.

    4. Alerting and root-cause analysis

    If your data fails any automatic monitoring or is outside the bounds of the rules and metrics you specify, Anomalo immediately issues an alert. Teams can subscribe to these real-time alerts via email, Slack, Microsoft Teams, or PagerDuty. A fully-featured API is also available.

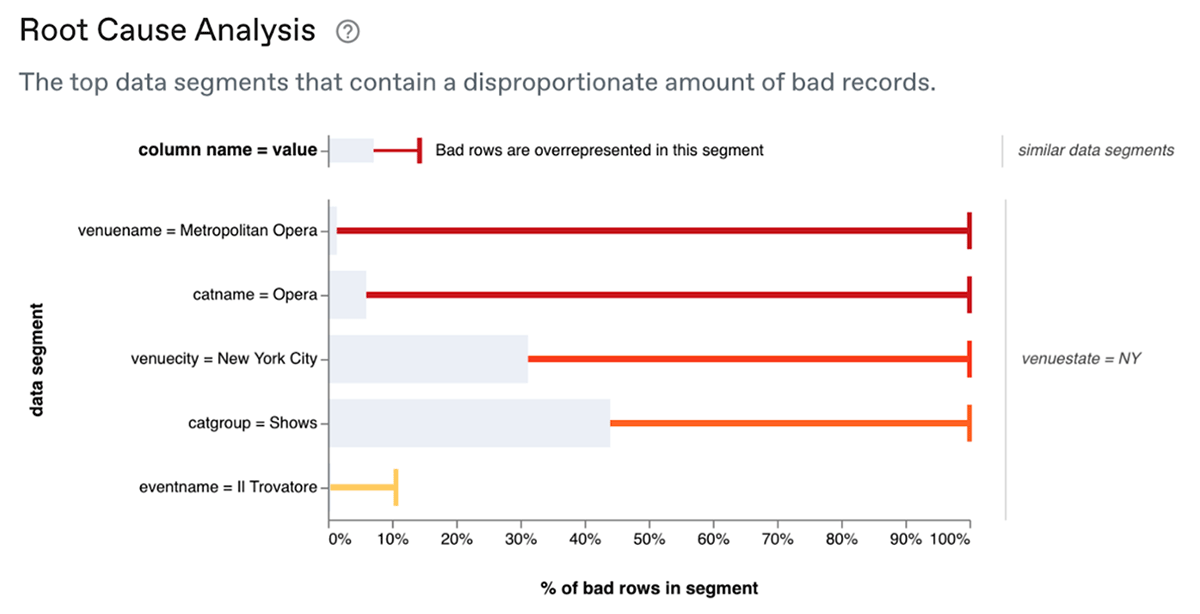
    To triage data issues, it’s important to understand the impact and quickly identify the source. Users can go into Anomalo to see the percentage of affected rows, as well as a deeper root cause analysis, including the location of the failure in the table and samples of good rows and bad rows.

    With the Databricks-Anomalo data quality monitoring solution, users can see the percentage of affected rows as well as a deeper root cause analysis right from Anomalo UI.

    5. Understanding the data health of your lakehouse

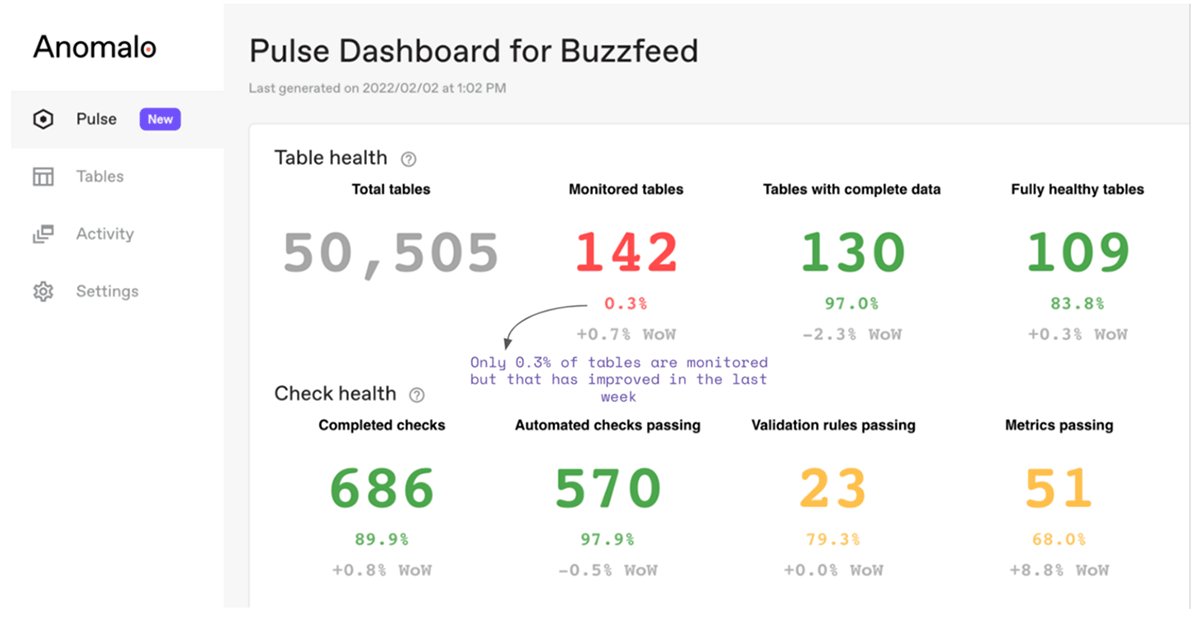
    Anomalo’s Pulse dashboard also gives users a high-level overview of their data quality to provide insights into data coverage, arrival times, trends, and repeat offenders. When you can make sense of the big picture health of the data in your organization’s lakehouse, you can identify problem areas and strategies for improvement.

    Anomalo’s Pulse dashboard also gives users a high-level overview of their data quality to get insight into data coverage, arrival times, trends, and repeat offenders.

    Getting started with Databricks and Anomalo

    Democratizing your data goes hand-in-hand with democratizing your data quality. Anomalo is a platform that helps you spot and fix issues with your data before they affect your business, as well as providing much needed visibility into the overall picture of your data health. Databricks customers can learn more about Anomalo at anomalo.com, or get started with Anomalo today by requesting a free demo.

    --

    Try Databricks for free. Get started today.

    The post Detecting Stale, Missing, Corrupted, and Anomalous Data in Your Lakehouse With Databricks and Anomalo appeared first on Databricks.

    ARC Uses a Lakehouse Architecture for Real-time Data Insights That Optimize Drilling Performance and Lower Carbon Emissions

    $
    0
    0

    This is a collaborative post between Databricks and ARC Resources. We thank Ala Qabaja, Senior Cloud Data Scientist, ARC Resources, for their contribution.

     
    As a leader in responsible energy development, Canadian company ARC Resources Ltd. (ARC) was looking for a way to optimize drilling performance to reduce time and costs, while also minimizing fuel consumption to lower carbon emissions.

    To do so, they required a data analytics solution that could ingest and visualize field operational data, such as well logs, in real-time to optimize drilling performance. ARC’s data team was tasked with delivering an analytics dashboard that could provide drilling engineers with the ability to see key operational metrics for active well logs compared side-by-side against historical well logs. In order to achieve near real-time results, the solution needed the right streaming and dashboard technologies.

    ARC has deployed the Databricks Lakehouse Platform to enable its drilling engineers to monitor operational metrics in near real-time, so that we can proactively identify any potential issues and enable agile mitigation measures. In addition to improving drilling precision, this solution has helped us in reducing drilling time for one of our fields. Time saving translates to reduction in fuel used and therefore a reduction in CO2 footprint that result from drilling operations.

    Selecting Data Lakehouse Architecture

    For the project, ARC needed a streaming solution that would make it easy to ingest an ongoing stream of live events, as well as historical data points. It was critical that ARC’s business users could see metrics from an active well(s), in addition to selected historical wells at the same time.

    With these requirements, the team needed to create data alignment normalized on drilling depth between streaming and historical well logs. Ideally, the data analytics solution wouldn’t require replaying and streaming of historical data for each active well, instead leveraging Power BI’s data integration features to provide this functionality.

    This is where Delta Lake, an open storage format for the data lake, provided the necessary capabilities for working with the streaming and batch data required for well operations. After researching potential solutions, the project team determined that Delta Lake had all of the features needed to meet ARC’s streaming and dashboarding requirements. During the process, the team identified four main advantages provided by Delta Lake that made it an appropriate choice for the application:

    1. Delta Lake can be used as a Structured Streaming sink, which enables the team to incrementally process data in near real-time.
    2. Delta Lake can be used to store historical data and can be optimized for fast query performance, which the team needed for downstream reporting and forecasting applications.
    3. Delta Lake provides the mechanism to update/delete/insert records as needed and with the necessary velocity.
    4. Power BI provides the ability to consume Delta Lake tables in both direct and import modes, which allows users to analyze streaming data and historical data with minimal overhead. Not only does this decrease high ingress/outgress data flows, but also gives users the option to select a historical well of their choice, and the flexibility to change it for added analysis and decision-making capability.

    These characteristics solved all the pieces of the puzzle and enabled seamless data delivery to Power BI.

    Data ingestion and transformation following the Medallion Architecture

    For active well logs, data is received into ARC’s Azure tenant through internet of things (IoT) edge devices, which are managed by one of ARC’s partners. Once received, messages are delivered to an Azure IoT Hub instance. From there, all data ingestion, calculation, and cleaning logic is done through Databricks.

    First, Databricks reads the data through a Kafka connector, and then writes it to the Bronze storage layer. Once there, another structured stream process picks it up, applies de-duplication and column renaming logic, and finally lands the data in the Silver layer. Once in the Silver layer, a final streaming process picks up changed data, applies calculations and aggregations, and directs the data into the active stream and the historical stream. Data in the active stream is landed in the Gold layer and gets consumed by the dashboard. Data in the historical stream also lands in the Gold layer where it gets consumed for machine learning experimentation and application, in addition to being a source for historical data for the dashboard.

    ARC’s well log data pipeline

    Enabling core business use cases with the Power BI dashboard

    Optimizations

    The goal for the dashboard was to refresh the data every minute, and for a complete refresh cycle to finish within 30 seconds, on average. Below are some of the obstacles the team overcame in the journey to deliver real-time analysis.

    In the first version of the report, it took 3-4 minutes for the report to make a complete refresh, which was too slow for business users. To achieve the 30-second SLA, the team implemented the following changes:

    • Improved Data Model: In the data model, historical and active data streams resided in separate tables. Historical data needed to refresh on a nightly basis and therefore, import mode was used in PowerBI. For active data, the team used direct query mode so the dashboard would display it in near real-time. Both tables contain contextual data used for filtering and numeric data used for plotting. The data model was also improved by implementing the following changes:
      • Instead of querying all of the columns in these tables at once, the team added a view layer in Databricks and selected only the required columns. This minimized I/O and improved query performance by 20-30 seconds.
      • Instead of querying all rows for historical data, the team filtered the view to only select the rows that were required for offset analysis purposes. With these filters, I/O was significantly reduced, improving performance by 50-60 seconds.
      • The project team redesigned the data model so that contextual data was loaded in a separate table from numeric data. This helped in reducing the size of the data model by avoiding repeating text data with low cardinality across the entire table. In other words, the team broke this flat table into fact and dimensional tables. This improved performance by 10-20 seconds.
      • By removing the majority of Power BI Data Analysis Expressions (DAX) calculations that were applied on the active well, and pushing these calculations to the view layer in Databricks, we improved performance by 10 seconds.
    • Reduce Visuals: Every visualization translates into one or more queries from Power BI to Databricks SQL, which results in more traffic and latency. Therefore, the team decided to remove some of the visualizations that were not absolutely necessary. This improved performance by another 10 seconds.
    • Power BI Configurations: Updating some of the data source settings helped improve performance by 20-30 seconds.
    • Load Balancing: Spinning up 2-3 clusters on the Databricks side to handle query load played a big factor in improving performance and reducing queue time for queries.

    Sample data joins underlying ARC PowerBI dashboard for its field well log data

    Final thoughts

    Performing near real-time BI is challenging in and of itself when you are streaming logs or IoT data in real-time. It is just as challenging to construct a near real-time dashboard that combines high-speed insight with large historical analytics in one view. ARC utilized Spark Structured Streaming, the lakehouse architecture, and Power BI to do just that: create a unified dashboard that allows monitoring of key operational parameters for active well logs, and compare them to well log data for historical wells of interest. The ability to combine real-time streaming logs from live oil wells with enriched historical data from all wells supported the key use case.

    As a result, the team was able to derive operational metrics in near real-time by utilizing the power of structured streaming, Delta Lake architecture, the speed and scalability of Databricks SQL, and the advanced dashboarding capabilities that Power BI provides.

    About ARC Resources Ltd.

    ARC Resources Ltd. (ARC) is a global leader in responsible energy development, and Canada’s third-largest natural gas producer and largest condensate producer. With a diverse asset portfolio in the Montney resource play in western Canada, ARC provides a long-term approach to strategic thinking, which delivers meaningful returns to shareholders.

    Learn more at arcresources.com.


    Acknowledgment:
    This project was completed in collaboration with Databricks professional services, NOV – MD Totco and BDO Lixar.

    --

    Try Databricks for free. Get started today.

    The post ARC Uses a Lakehouse Architecture for Real-time Data Insights That Optimize Drilling Performance and Lower Carbon Emissions appeared first on Databricks.

    Invest in your career at Data + AI Summit! Get 75% off certifications.

    $
    0
    0

    Data & AI skills are in demand like never before, and there is no better place to skill up than Databricks Academy, which offers a range of training and certification aimed at a variety of skillsets and technology interests.  Join us at the Data + AI Summit, June 27 – 30, live in San Francisco or free from anywhere, and benefit from 75% discount on Databricks certifications, in addition to 25% off training!

    What can you expect from these training programs? Hear from our community firsthand:

    “Databricks training and certifications are best-in-class. Their hands-on, notebook-first approach has made learning the platform so much more digestible. Their training offers a great balance between concepts, architecture slides, and jumping right into actually implementing the solution on the platform. It’s the best way to learn!” – Luke Fore, ML Engineering Manager at Accenture 

    “The data engineer certification from Databricks provided the foundation and know-how required before starting our development in Azure.” – Jennifer Romero-Higgins, Principal Data Architect at American Airlines

    Top five reasons to get certified at Summit:

    • Full slate of free and paid hands-on training workshops across the spectrum of data lakehouse technologies, from Delta Lake to Apache Spark™ programming to managing ML models with MLflow. 
    • Certification across job profiles, from data engineers and data scientists to platform administrators.
    • Data + AI Summit discounts, in-person or online, with 25% off training and 75% off certifications.
    • VIP treatment for certified professionals at the Summit, including dedicated seating at our keynote and invites to after parties and an exclusive AMA with community leaders.
    • Exclusive swag for certified professionals at the Summit – sneak peek below!

    This jacket image is subject to change

    Sign up for training and certification at Data + AI Summit today! 

    --

    Try Databricks for free. Get started today.

    The post Invest in your career at Data + AI Summit! Get 75% off certifications. appeared first on Databricks.

    Guide to Retail & Consumer Goods at Data + AI Summit 2022

    $
    0
    0

    Check out our guide to Retail & Consumer Goods at Data + AI Summit to help plan your Summit experience.


    Every year, data leaders, practitioners and visionaries from across the globe and industries join Data + AI Summit to discuss the latest trends in big data. For data teams in the Retail & Consumer Goods industry, we’re excited to announce a full agenda of Retail & Consumer Goods sessions. Leaders from Anheuser-Busch, IKEA, Wehkamp, 84.51 and other industry organizations will share how they are using data to impact real-life use cases like sales forecasting, on-shelf availability, recommendations, churn analysis and more.

    Retail and Consumer Goods Industry Forum

    Join us on Tuesday, June 28 at 3:30 pm PT for our Retail & Consumer Goods Forum. During our capstone event, you’ll have the opportunity to hear keynotes and panel discussions with data analytics and AI leaders on the most pressing topics in the industry. Here’s a rundown of what attendees will get to explore:

    Keynote

    In this keynote, Vik Gupta, Vice President of Ads Engineering at Instacart, will cover the rise of retail media networks and the importance of performance measurement. Vik will share how ad platforms, like Instacart Ads, benefit retail and consumer goods brands by unlocking new digital monetization capabilities, data, and insights on shopping behavior.

    Panel Discussion

    Join our esteemed panel of data and AI leaders from some of the biggest names in retail and consumer goods as they discuss how data is being used to improve customer experience through personalization, optimize supply chains and build a robust partner ecosystem.

    84.51°: Nick Hamilton, VP of Engineering
    PetSmart: Elpida Ormanidou, VP of Analytics and Insights
    Gap: Vimal Kohli, VP & Head of Data Science & Analytics
    Walgreens: Mike Maresca, Global Chief Technology Officer
    Shipt: Barry Ralston, Director of Engineering, Analytics Data Platform

    Retail & Consumer Goods Breakout Sessions

    Here’s an overview of some of our most highly-anticipated Retail & Consumer Goods sessions at this year’s summit:

    Building a Data Lakehouse for Data Science at DoorDash
    Hien Luu, Sr. Engineering Manager, DoorDash
    Brian Dirking, Partner Marketing, Databricks

    Learn about how DoorDash moved from a data warehouse to a lakehouse architecture to increase data transparency, lower costs, and handle both streaming and batch data. Luu will share how DoorDash’s new efficiencies are enabling them to tackle more advanced use cases such as NLP and image classification.

    Learn more


    Powering Up the Business With the Lakehouse
    Ricardo Simon Moreira Wagenmaker, Data Engineer, Wehkamp

    Discover how Wehkamp has built a lakehouse to provide reliable and on-time data to the business, while making this access compliant with GDPR. Unlocking data sources that were previously scattered across the company and democratizing the data access has enabled Wehkamp to empower the business with more, better and faster data.

    Learn more


    Quick to Production with the Best of Both Apache Spark and Tensorflow on Databricks

    Ronny Mathew, Data Science Manager, Rue Gilt Groupe

    Check out how Rue Guilt Group is leveraging the best features of both Apace Spark and TensorFlow, how to go from single node training to distributed training with very few extra lines of code, how to leverage MLflow as a central model store, and finally, using these models for batch and real-time inference.

    Learn more


    Setting Up On-Shelf Availability Alerts at Scale With Databricks and Azure
    Kashyap Kasinarasimhan, Senior Director, Tredence

    Learn about Tredence’s On-Shelf Availability Accelerator – a robust quick-start guide that is the foundation for a full Out Of Stock of Supply Chain Solution. Hear how the OSA solution has helped Datarbicks customers focus on driving sales through improved stock availability on the shelves.

    Learn more


    Building and Scaling Machine Learning-Based Products in the World’s Largest Brewery
    Dr. Renata Castanha, Technical Product Manager, AI/ML, Anheuser-Busch InBev

    Hear how Anheuser-Busch InBev (Brazil) has been developing and growing an ML platform product to democratize and evolve AI usage within the full company.

    Learn more


    This is just a glimpse of what’s in store. Check out the full list of Retail & Consumer Goods talks at Data + AI Summit.

    Demos on Popular Data + AI Use Case in Retail & Consumer Goods

    Attendees will also have the opportunity to deep dive into key use cases with these live demos:

    Drive faster, more accurate decisions with real-time retail

    Learn how to build highly scalable streaming data pipelines leveraging Delta Live Tables to obtain a real-time view of your operations.

    Personalize interactions with propensity scoring

    See how to develop propensity scores for your customers — using Databricks Feature Store and MLflow — to determine how to best personalize interactions and increase revenue.

    Sign-up for the Retail & Consumer Goods Experience at Summit!

    Register for the Data + AI Summit to take advantage of all the amazing Retail & Consumer Goods sessions, demos and talks scheduled to take place. Registration is free! In the meantime, download our Guide to Retail & Consumer Goods Sessions at Data + AI Summit 2022.

    --

    Try Databricks for free. Get started today.

    The post Guide to Retail & Consumer Goods at Data + AI Summit 2022 appeared first on Databricks.

    How to Monitor Streaming Queries in PySpark

    $
    0
    0

    Streaming is one of the most important data processing techniques for ingestion and analysis. It provides users and developers with low latency and real-time data processing capabilities for analytics and triggering actions. However, monitoring streaming data workloads is challenging because the data is continuously processed as it arrives. Because of this always-on nature of stream processing, it is harder to troubleshoot problems during development and production without real-time metrics, alerting and dashboarding.

    Structured Streaming in Apache Spark™ addresses the problem of monitoring by providing:

    Until now, the Observable API has been missing in PySpark, which forces users to use the Scala API for their streaming queries to avail the functionality of alerting and dashboarding with other external systems. The lack of this functionality in Python has become more critical as the importance of Python grows, given that almost 70% of notebook commands run on Databricks are in Python.

    In Databricks Runtime 11, we’re happy to announce that the Observable API is now available in PySpark. In this blog post, we introduce the Python Observable API for Structured Streaming, along with a step-by-step example of a scenario that adds alerting logic into a streaming query.

    Observable API

    Developers can now send streaming metrics to external systems, e.g., for alerting and dashboarding with custom metrics, using a combination of the streaming query listener interface and the Observable API in PySpark. The Streaming Query Listener interface is an abstract class that has to be inherited and should implement all methods as shown below:

    from pyspark.sql.streaming import StreamingQueryListener
    
    
    class MyListener(StreamingQueryListener):
        def onQueryStarted(self, event):
            """
            Called when a query is started.
    
            Parameters
            ----------
            event: :class:`pyspark.sql.streaming.listener.QueryStartedEvent`
                The properties are available as the same as Scala API.
    
            Notes
            -----
            This is called synchronously with
            meth:`pyspark.sql.streaming.DataStreamWriter.start`,
            that is, ``onQueryStart`` will be called on all listeners before
            ``DataStreamWriter.start()`` returns the corresponding
            :class:`pyspark.sql.streaming.StreamingQuery`.
            Do not block in this method as it will block your query.
            """
            pass
    
        def onQueryProgress(self, event):
            """
            Called when there is some status update (ingestion rate updated, etc.)
    
            Parameters
            ----------
            event: :class:`pyspark.sql.streaming.listener.QueryProgressEvent`
                The properties are available as the same as Scala API.
    
            Notes
            -----
            This method is asynchronous. The status in
            :class:`pyspark.sql.streaming.StreamingQuery` will always be
            latest no matter when this method is called. Therefore, the status
            of :class:`pyspark.sql.streaming.StreamingQuery`.
            may be changed before/when you process the event.
            For example, you may find :class:`StreamingQuery`
            is terminated when you are processing `QueryProgressEvent`.
            """
            pass
    
        def onQueryTerminated(self, event):
            """
            Called when a query is stopped, with or without error.
    
            Parameters
            ----------
            event: :class:`pyspark.sql.streaming.listener.QueryTerminatedEvent`
                The properties are available as the same as Scala API.
            """
            pass
    
    
    my_listener = MyListener()
    

    Note that they all work asynchronously.

    • StreamingQueryListener.onQueryStarted is triggered when a streaming query is started, e.g., DataStreamWriter.start.
    • StreamingQueryListener.onQueryProgress is invoked when each micro-batch execution is finished.
    • StreamingQueryListener.onQueryTerminated is called when the query is stopped, e.g., StreamingQuery.stop.

    The listener has to be added in order to be activated via StreamingQueryManager and can also be removed later as shown below:

    spark.streams.addListener(my_listener)
    spark.streams.removeListener(my_listener)
    

    In order to capture custom metrics, they have to be added via DataFrame.observe. The custom metrics are defined as arbitrary aggregate functions such as count("value") as shown below.

    df.observe("name", count(column), ...)

    Error Alert Scenario

    In this section, we will describe an example of a real world use case with the Observable API. Suppose you have a directory where new CSV files are continuously arriving from another system, and you have to ingest them in a streaming fashion. In this example, we will use a local file system for simplicity so that the API can be easily understood. The code snippets below can be copied and pasted in the pyspark shell for you to run and try out.

    First, let’s import the necessary Python classes and packages, then create a directory called my_csv_dir that will be used in this scenario.

    import os
    import shutil
    import time
    from pathlib import Path
    
    from pyspark.sql.functions import count, col, lit
    from pyspark.sql.streaming import StreamingQueryListener
    
    # NOTE: replace `basedir` with the fused path, e.g., "/dbfs/tmp" in Databricks
    # notebook.
    basedir = os.getcwd()  # "/dbfs/tmp"
    
    # My CSV files will be created in this directory later after cleaning 'my_csv_dir'
    # directory up in case you already ran this example below.
    my_csv_dir = os.path.join(basedir, "my_csv_dir")
    shutil.rmtree(my_csv_dir, ignore_errors=True)
    os.makedirs(my_csv_dir)
    

    Next, we define our own custom streaming query listener. The listener will alert when there are too many malformed records during CSV ingestion for each process. If the malformed records are more than 50% of the total count of processed records, we will print out a log message. However, in production scenarios, you can connect to the external systems instead of simply printing out.

    # Define my listener.
    class MyListener(StreamingQueryListener):
        def onQueryStarted(self, event):
            print(f"'{event.name}' [{event.id}] got started!")
        def onQueryProgress(self, event):
            row = event.progress.observedMetrics.get("metric")
            if row is not None:
                if row.malformed / row.cnt > 0.5:
                    print("ALERT! Ouch! there are too many malformed "
                          f"records {row.malformed} out of {row.cnt}!")
                else:
                    print(f"{row.cnt} rows processed!")
        def onQueryTerminated(self, event):
            print(f"{event.id} got terminated!")
    
    
    # Add my listener.
    my_listener = MyListener()
    spark.streams.addListener(my_listener)
    

    To activate the listener, we add it before the query in this example. However, it is important to note that you can add the listener regardless of the query start and termination because they work asynchronously. This allows you to attach and detach to your running streaming queries without halting them.

    Now we will start a streaming query that ingests the files in my_csv_dir directory. During processing, we also observe the number of malformed records and processed records. The CSV data source stores malformed records at _corrupt_record, by default, so we will count the column for the number of malformed records.

    # Now, start a streaming query that monitors 'my_csv_dir' directory.
    # Every time when there are new CSV files arriving here, we will process them.
    my_csv = spark.readStream.schema(
        "my_key INT, my_val DOUBLE, _corrupt_record STRING"
    ).csv(Path(my_csv_dir).as_uri())
    # `DataFrame.observe` computes the counts of processed and malformed records,
    # and sends an event to the listener.
    my_observed_csv = my_csv.observe(
        "metric",
        count(lit(1)).alias("cnt"),  # number of processed rows
        count(col("_corrupt_record")).alias("malformed"))  # number of malformed rows
    my_query = my_observed_csv.writeStream.format(
        "console").queryName("My observer").start()
    

    Now that we have defined the streaming query and the alerting capabilities, let’s create CSV files so they can be ingested in a streaming fashion:

    # Now, we will write CSV data to be processed in a streaming manner on time.
    # This CSV file is all well-formed.
    with open(os.path.join(my_csv_dir, "my_csv_1.csv"), "w") as f:
        _ = f.write("1,1.1\n")
        _ = f.write("123,123.123\n")
    
    time.sleep(5)  # Assume that another CSV file arrived in 5 seconds.
    
    # Ouch! it has two malformed records out of 3. My observer query should alert it!
    with open(os.path.join(my_csv_dir, "my_csv_error.csv"), "w") as f:
        _ = f.write("1,1.123\n")
        _ = f.write("Ouch! malformed record!\n")
        _ = f.write("Arrgggh!\n")
    
    time.sleep(5)  # OK, all done. Let's stop the query in 5 seconds.
    my_query.stop()
    spark.streams.removeListener(my_listener)
    

    Here we will see that the query start, termination and processes are logged properly. Because there are two malformed records in the CSV files, the alert is raised properly with the following error message:

    ...
    ALERT! Ouch! there are too many malformed records 2 out of 3!
    ...

    Conclusion

    PySpark users are now able to set their custom metrics and observe them via the streaming query listener interface and Observable API. They can attach and detach such logic into running queries dynamically when needed. This feature addresses the need for dashboarding, alerting and reporting to other external systems.

    The Streaming Query Listener interface and Observable API are available in DBR 11 Beta, and expected to be available in the future Apache Spark. Try out both new capabilities today on Databricks through DBR 11 Beta.

    The Streaming Query Listener interface and Observable API are available in DBR 11 Beta, and expected to be available in the future Apache Spark.

    --

    Try Databricks for free. Get started today.

    The post How to Monitor Streaming Queries in PySpark appeared first on Databricks.


    Guide to Financial Services Sessions at Data + AI Summit 2022

    $
    0
    0

    Download our Financial Services Guide to Data + AI Summit to help plan your Summit experience.


    Every year, data leaders, practitioners and visionaries from across the globe and industries join the Data + AI Summit to discuss the latest trends in big data. For data teams in the financial services industry, we’re excited to announce a full agenda of Financial Services sessions. Leaders from Capital One, J.P. Morgan, HSBC, Nasdaq, TD Bank, S&P Global, Nationwide, Northwestern Mutual, BlockFi (crypto) and many more will share how they are using data and machine learning (ML) to digitally transform and make smarter decisions that minimize risk, accelerate innovation and drive sustainable value creation.

    Financial Services Forum

    Data is at the core of nearly every innovation in the financial services industry. Leaders across banking and capital markets, payment companies and fintechs, insurance and wealth management firms are harnessing the power of data and analytics.

    Join us on Tuesday, June 28 at 3:30 PM PT for our Financial Services Forum, our most popular industry event at Data + AI Summit. During our capstone event, you’ll have the opportunity to join sessions with thought leaders from some of the biggest global brands.

    Featured Speakers:
    Jack Berkowitz, Chief Data Officer, ADP
    Junta Nakai, Global Industry Lead, Financial Services, Databricks
    Paul Wellman, VP, Executive Product Owner, TD Bank
    Arup Nanda, Managing Director, CTO Enterprise Cloud Data Ecosystem, J.P. Morgan
    Geping Chen, Head of Data Engineering, Geico
    Mona Soni, Chief Technology Officer, Sustainable1, S&P Global
    Jeff Parkinson, VP, Core Data Engineering, Northwestern Mutual
    Christopher Darringer and Shraddha Shah, Point72 Asset Management
    Ken Priyadarshi, Global Strategy and Transactions CTO, EY

    Financial Services Breakout Sessions

    Here’s an overview of some of our most highly anticipated Financial Services sessions at this year’s summit:

    HSBC: Cutting the Edge in Fighting Cybercrime — Reverse-Engineering a Search Language to Cross-Compile It to PySpark
    Abigail Shriver, HSBC | Jude Ken-Kwofie, HSBC | Serge Smertin, Databricks

    Traditional security information and event management (SIEM) tools do not scale well for data sources with 30TB per day, which led HSBC to create a Cybersecurity Lakehouse with Delta Lake and Apache Spark. In this talk, you’ll learn how to implement (or reverse-engineer) a language with Scala and translate it into what Spark understands, the Catalyst engine.

    Learn more


    Toward Dynamic Microstructure: The Role of ML in the Next Generation of Exchanges
    Michael O’Rourke, SVP, Engineering & AI/ML, Nasdaq | Douglas Hamilton, AVP, Machine Intelligence Lab)

    What role will AI and ML in ensuring the efficiency and transparency of the next generation of markets? In this session, Douglas and Michael will show how Nasdaq is building dynamic microstructures that reduce the inherent frictions associated with trading, and give insights into their application across industries.

    Learn more


    FutureMetrics: Using Deep Learning to Create a Multivariate Time Series Forecasting
    Matthew Wander, Data Scientist, TD Bank

    Liquidity forecasting is one of the most essential activities at any bank. TD Bank, the largest of the Big Five based in Canada, has to provide liquidity for half a trillion dollars in products, and forecast it to remain within a $5BN regulatory buffer. The use case was to predict liquidity growth over short to moderate time horizons: 90 days to 18 months. Models must perform reliably in a strict regulatory framework, and accordingly, validating such a model to the required standards is a key area of focus for this talk.

    Learn more


    Domain-Driven Data (3D) Lakehouse for Insurance
    Kiran Karnati, AVP, Data Management, Enterprise Data Office, Nationwide Insurance

    What is 3D lakehouse? Your data lakehouse is only as strong as the weakest data pipeline flowing through it. In this talk, Kiran explains how the most successful lakehouse implementations are those with non-monolithic, modularized data domain products, implemented as a unified trusted data platform enabling business intelligence, AI/ML and downstream consumption use cases, all from the same platform.

    Learn more


    Protecting Personally Identifiable Information (PII)/PHI Data in Data Lake via Column Level Encryption
    Keyuri Shah, Lead Engineer, Northwestern Mutual Insurance

    Data breach is a concern for any data collection company, including Northwestern Mutual. Every measure is taken to avoid identity theft and fraud for customers; however, these preventive methods are still not sufficient if the security perimeter around it is not updated periodically. A multiple layer of encryption is the most common approach utilized to avoid breaches, but unauthorized internal access to this sensitive data still poses a threat.

    Learn more


    How Robinhood Built a Streaming Lakehouse to Bring Data Freshness From 24 Hours to Less Than 15 Minutes
    Balaji Varadarajan, Robinhood Markets | Vikrant Goel, Robinhood

    Robinhood’s data lake is the bedrock foundation that powers business analytics, product experimentation and other machine learning applications throughout the organization. Come join this session where the speakers share their journey of building a scalable streaming data lakehouse with Spark, Postgres and other leading open source technologies.

    Learn more


    Building an Operational ML Organization From Zero for Cryptocurrency
    Anthony Tellez, BlockFi | Brennan Lodge, BlockFi

    BlockFi is a cryptocurrency platform that allows its clients to grow wealth through various financial products capabilities, including loans, trading and interest accounts. In this presentation the speakers showcase their journey of adopting Databricks to build an operational nerve center for analytics across the company.

    Learn more


    A Modern Approach to Big Data in Finance
    Bill Dague, Nasdaq | Leonid Rosenfeld, Nasdaq

    In this live demonstration of Delta Sharing combined with Nasdaq Data Fabric, the speakers address the unique challenges associated with working with big data for finance (volume of data, disparate storage, variable sharing protocols). Leveraging open source technologies, like Databricks Delta Sharing, in combination with a flexible data management stack allows Nasdaq to be more nimble in testing and deploying more strategies.

    Learn more


    Running a Low-Cost, Versatile Data Management Ecosystem With Apache SparkTM at Core
    Shariff Mohammed, Capital One

    This presentation demonstrates how Capital One built an ETL data processing ecosystem completely on AWS cloud using Spark at its core. While data engineers are required to be skilled to code in one programming language (Apache Spark), pipeline code can be executed on AWS EC2 or EMR to optimize distributed computing. This presentation also demonstrates how a UI-based ETL tool built with Spark as a back-end can run on the same infrastructure, which improves ease of development and maintenance.

    Learn more


    Check out the full list of Financial Services talks at Summit.


    Demos on Popular Data + AI Use Cases in Financial Services

    Hyper-Personalization at Scale Rapidly Deploy Data Into Value-at-Risk Models Claims Automation Metadata Ingestion Framework

    Sign up for the Financial Services Experience at Summit!

    --

    Try Databricks for free. Get started today.

    The post Guide to Financial Services Sessions at Data + AI Summit 2022 appeared first on Databricks.

    Automate Your Data and ML Workflows With GitHub Actions for Databricks

    $
    0
    0

    As demand for data and machine learning (ML) applications grows, businesses are adopting continuous integration and deployment practices to ensure they can deploy reliable data and AI workflows at scale. Today we are announcing the first set of GitHub Actions for Databricks, which make it easy to automate the testing and deployment of data and ML workflows from your preferred CI/CD provider. For example, you can run integration tests on pull requests, or you can run an ML training pipeline on pushes to main. By automating your workflows, you can improve developer productivity, accelerate deployment and create more value for your end-users and organization.

    GitHub Actions for Databricks simplify CI/CD workflows

    Today, teams spend significant time setting up CI/CD pipelines for their data and AI workloads. Crafting these CI/CD pipelines can be a painstaking process and requires stitching together multiple APIs, creating custom plugins, and then maintaining these plugins. GitHub Actions for Databricks are first-party actions that provide a simple and easy way to run Databricks notebooks from GitHub Actions workflows. With the release of these actions, you can now easily create and manage automation workflows for Databricks.

    What can you do with GitHub Actions for Databricks?

    We are launching two new GitHub Actions in the GitHub marketplace that will help data engineers and scientists run notebooks directly from GitHub.

    You can use the actions to run notebooks from your repo in a variety of ways. For example, you can use them to perform the following tasks:

    • Run a notebook on Databricks from the current repo and await its completion
    • Run a notebook using library dependencies in the current repo and on PyPI
    • Run an existing notebook in the Databricks Workspace
    • Run notebooks against different workspaces – for example, run a notebook against a staging workspace and then run it against a production workspace
    • Run multiple notebooks in series, including passing the output of a notebook as the input to another notebook

    Below is an example of how to use the newly introduced action to run a notebook in Databricks from GitHub Actions workflows.

    name: Run a notebook in databricks on PRs
    
    on:
     pull_request:
    
    jobs:
     run-databricks-notebook:
       runs-on: ubuntu-latest
       steps:
         - name: Checkout repo
           uses: actions/checkout@v2
         - name: Run a databricks notebook
           uses: databricks/run-notebook@v0
           with:
             local-notebook-path: path/to/my/databricks_notebook.py
             databricks-host: https://adb-XXXX.XX.dev.azuredatabricks.net
             databricks-token: ${{ secrets.DATABRICKS_TOKEN }}
             git-commit: ${{ github.event.pull_request.head.sha }}
             new-cluster-json: >
               {
                 "num_workers": 1,
                 "spark_version": "10.4.x-scala2.12",
                 "node_type_id": "Standard_D3_v2"
               }
    

    Get started with the GitHub Actions for Databricks

    Ready to get started or try it out for yourself? You can read more about GitHub Actions for Databricks and how to use them in our documentation: Continuous integration and delivery on Databricks using GitHub Actions.

    --

    Try Databricks for free. Get started today.

    The post Automate Your Data and ML Workflows With GitHub Actions for Databricks appeared first on Databricks.

    Getting Started with Personalization through Propensity Scoring

    $
    0
    0

    Consumers increasingly expect to be engaged in a personalized manner. Whether it’s an email message promoting products to complement a recent purchase, an online banner announcing a sale on products in a frequently browsed category, or content aligned with expressed interests, consumers have an increasing number of choices for where they spend their money and prefer to do so with outlets that recognize their personal needs and preferences.

    A recent survey by McKinsey highlights that nearly three-quarters of consumers now expect personalized interactions as part of their shopping experience. The research included with this survey highlights that companies that get this right stand to generate 40% more revenue through personalized engagements, making personalization a key differentiator for top retail performers.

    Still, many retailers struggle with personalization. A recent survey by Forrester finds only 30% of US and 26% of UK consumers believe retailers do a good job of creating relevant experiences for them. In a separate survey by 3radical, only 18% of respondents felt strongly that they received customized recommendations, while 52% expressed frustration from receiving irrelevant communications and offers. With consumers increasingly empowered to switch brands and outlets, getting personalization right has become a priority for an increasing number of businesses.

    Personalization is a journey

    To an organization new to personalization, the idea of delivering one-to-one engagements seems daunting. How do we overcome siloed processes, poor data stewardship and concerns over data privacy to assemble the data needed for this approach? How do we craft content and messaging that feels truly personalized with only limited marketing resources? How do we ensure the content we create is effectively targeted to individuals with evolving needs and preferences?

    While much of the literature on personalization highlights cutting edge approaches that stand out for their novelty (but not always their effectiveness), the reality is that personalization is a journey. In the early phases, emphasis is placed on leveraging first-party data where privacy and customer trust are more easily maintained. Fairly standard predictive techniques are applied to bring proven capabilities forward. As value is demonstrated and the organization develops not only comfort with these new techniques but also the various ways they can be integrated into their practices, more sophisticated approaches are then employed.

    Propensity scoring Is often a first step towards personalization

    One of the first steps in the personalization journey is often the examination of sales data for insights into individual customer preferences. In a process referred to as propensity scoring, companies can estimate customers’ potential receptiveness to an offer or to content related to a subset of products. Using these scores, marketers can determine which of the many messages at their disposal should be presented to a specific customer. Similarly, these scores can be used to identify segments of customers that are more or less receptive to a particular form of engagement.

    The starting point for most propensity scoring exercises is the calculation of numerical attributes (features) from past interactions. These features may include things such as a customer’s frequency of purchases, percentage of spend associated with a particular product category, days since last purchase, and many other metrics derived from the historical data. The historical period immediately following the period from which these features were calculated are then examined for behaviors of interest such as the purchasing of a product within a particular category or the redemption of a coupon. If the behavior is observed, a label of 1 is associated with the features. If it is not, a label of 0 is assigned.

    Using the features as predictors of the labels, data scientists can train a model to estimate the probability the behavior of interest will occur. Applying this trained model to features calculated for the most recent period, marketers can estimate the probability a customer will engage in this behavior in the foreseeable future.

    With numerous offers, promotions, messages and other content at our disposal, numerous models, each predicting a different behavior, are trained and applied to this same feature set. A per-customer profile consisting of scores for each of the behaviors of interest is compiled and then published to downstream systems for use by marketing in the orchestration of various campaigns.

    Databricks provides critical capabilities for propensity scoring

    As straightforward as propensity scoring sounds, it’s not without its challenges. In our conversations with retailers implementing propensity scoring, we often encounter the same three questions:

    1. How do we maintain the 100s and sometimes 1,000s of features that we use to train our propensity models?
    2. How do we rapidly train models aligned with new campaigns that the marketing team wishes to pursue?
    3. How do we rapidly re-deploy models, retrained as customer patterns drift, into the scoring pipeline?

    At Databricks, our focus is on enabling our customers through an analytics platform built with the end-to-end needs of the enterprise in mind. To that end, we’ve incorporated into our platform features such as the Feature Store, AutoML and MLFlow, all of which can be employed to address these challenges as part of a robust propensity scoring process.

    Feature Store

    The Databricks Feature Store is a centralized repository that enables the persistence, discovery and sharing of features across various model training exercises. As features are captured, lineage and other metadata are captured so that data scientists wishing to reuse features created by others may do so with confidence and ease. Standard security models ensure that only permitted users and processes may employ these features, so that data science processes are managed in accordance with organizational policies for data access.

    AutoML

    Databricks AutoML allows you to quickly generate models by leveraging industry best practices. As a glass box solution, AutoML first generates a collection of notebooks representing different model variations aligned with your scenario. While it iteratively trains the different models to determine which works best with your dataset, it allows you to access the notebooks associated with each of these. For many data science teams, these notebooks become an editable starting point for the further exploration of model variations, which ultimately allow them to arrive at a trained model they feel confident can meet their objectives.

    MLFlow

    MLFlow is an open source machine learning model repository, managed within the Databricks platform. This repository allows the Data Science team to track and analyze the various model iterations generated by both AutoML and custom training cycles alike. Its workflow management capabilities allow organizations to rapidly move trained models from development into production so that trained models can more immediately have an impact on operations.

    When used in combination with the Databricks Feature Store, models persisted with MLFlow retain knowledge of the features used during training. As models are retrieved for inference, this same information allows the model to retrieve relevant features from the Feature Store, greatly simplifying the scoring workflow and enabling rapid deployment.

    Building a propensity scoring workflow

    Using these features in combination, we see many organizations implementing propensity scoring as part of a three-part workflow. In the first part, data engineers work with data scientists to define features relevant to the propensity scoring exercise and persist these to the Feature Store. Daily or even real-time feature engineering processes are then defined to calculate up-to-date feature values as new data inputs arrive.

    Figure 1. A three-part propensity scoring workflow

    Next, as part of the inference workflow, customer identifiers are presented to previously trained models in order to generate propensity scores based on the latest features available. Feature Store information captured with the model allows data engineers to retrieve these features and generate the desired scores with relative ease. These scores may be persisted for analysis within the Databricks platform, but more typically are published to downstream marketing systems.

    Finally, in the model-training workflow, data scientists periodically retrain the propensity score models to capture shifts in customer behaviors. As these models are persisted to MLFLow, change management processes are employed to evaluate the models and elevate those models that meet organizational criteria to production status. In the next iteration of the inference workflow, the latest production version of each model is retrieved to generate customer scores.

    To demonstrate how these capabilities work together, we’ve constructed an end-to-end workflow for propensity scoring based on a publicly available dataset. This workflow demonstrates the three legs of the workflow described above, and shows how to employ key Databricks features to build an effective propensity scoring pipeline.

    Download the assets here, and use this as a starting point for building your own foundation for personalization using the Databricks platform.

    --

    Try Databricks for free. Get started today.

    The post Getting Started with Personalization through Propensity Scoring appeared first on Databricks.

    Building ETL pipelines for the cybersecurity lakehouse with Delta Live Tables

    $
    0
    0

    Databricks recently introduced Workflows to enable data engineers, data scientists, and analysts to build reliable data, analytics, and ML workflows on any cloud without needing to manage complex infrastructure. Workflows allows users to build ETL pipelines that are automatically managed, including ingestion, and lineage, using Delta Live Tables. The benefits of Workflows and Delta Live Tables easily apply to security data sources, allowing us to scale to any volume or latency required for our operational needs.

    In this article we’ll demonstrate some of the key benefits of Delta Live Tables for ingesting and processing security logs, with a few examples of common data sources we’ve seen our customers load into their cyber Lakehouse.

    Delta Live Tables for the cyber lakehouse

    Working with security log data sources in Databricks

    The first data source we’ll cover is CloudTrail, which produces logs that can be used to monitor activity in our AWS accounts. CloudTrail logs are published to an S3 bucket in compressed JSON format every 5 minutes. While JSON makes these logs simple to query, this is an inefficient format for analytical and reporting needs, especially at the scale required for months or even years of data. In order to support incident response and advanced monitoring or ML use cases, we’d get much better performance and reliability, not to mention data versioning if we were to use a more efficient open-source format like Delta Lake.

    CloudTrail also has a fairly complex, highly nested schema that may evolve over time as new services are brought on board or request/response patterns change. We want to avoid having to manually manage schema changes or, even worse, potentially lose data if the event parsing fails at runtime. This requires a flexible but reliable schema evolution that minimizes downtime and avoids any code changes that could break our SLAs.

    On AWS, we can also use VPC flow logs to monitor and analyze the network traffic flowing through our environments. Again, these are delivered to an S3 bucket with a configurable frequency and either in text or Parquet format. The schema and format in this case is more consistent than CloudTrail, but again we want to make this data available in a reliable and performant manner for our cyber threat analytical and reporting needs.

    Finally, for another example of network monitoring we use Zeek logs. Similar to VPC flow logs these help us monitor network activity within our environment, but Zeek generates more detailed logs based on the protocol and includes some lightweight detections for unusual activity.

    For all three data sources we want pipelines that are simple to implement, deploy, and monitor. For ensuring the quality and reliability of the data we’re also going to use Delta Live Tables expectations. This is a declarative model for defining data quality constraints and how to handle records as they’re ingested by the pipeline. Delta Live Tables provides built-in monitoring for these conditions, which we can also use for threat detections for our data sources.

    Implementation with Delta Live Tables

    For these three use cases our sample logs land on S3 and are ingested incrementally into our Lakehouse using Delta Live Tables (DLT). DLT is a new declarative model for defining data flow pipelines, based on Structured Streaming and Delta Lake. With DLT we can build reliable, scalable, and efficient data pipelines with automatic indexing, file optimization, and even integrated data quality controls. What’s more, Databricks manages the operational complexities around deploying and executing our DLT pipelines (including retries and autoscaling based on the backlog of incoming data) so we can just focus on declaring the pipeline, and letting DLT worry about everything else.

    For more details about DLT, please see previous articles such as Announcing the Launch of Delta Live Tables and Implementing Intelligent Data Pipelines with Delta Live Tables.

    CloudTrail

    The first pipeline we’ll review is for CloudTrail. As described earlier, AWS lands compressed JSON files containing our CloudTrail logs in an S3 bucket. We use Databricks Auto Loader to efficiently discover and load new files each execution. In production scenarios we suggest using file notification mode, in which S3 events are pushed to an SQS topic. This avoids having to perform slower S3 file listings to detect new files.

    We also enable Auto Loader’s schema inference mode given the large and complex schema for CloudTrail files. This uses a sampling from new files to infer the schema, saving us from having to manually define and manage the schema ourselves. As the schema changes, Delta Live Tables automatically merges those changes downstream to our target Delta tables as part of the transaction.

    In the case of CloudTrail, there are a few columns we prefer keeping in a loosely typed format: requestParameters, responseElements, resources, serviceEventDetails, and additionalEventData. These parameters all have different structures depending on the service being called and the request/response of the event. With schema inference, in this case we’ll end up with large, highly nested columns from a superset of all possible formats, where most values will be null for each event. This will make the columns difficult to understand and visualize for our security analysts. Instead, we can use schema hints to tell Auto Loader to treat these particular columns as simple map types with string key/value pairs. This keeps the structure clean and easier to use for analysts, while still preserving the information we need.

    CloudTrail pipeline built as part of a Cybersecurity lakehouse.

    Finally, to ensure we’re ingesting properly parsed and formatted data, we apply DLT expectations to each entry. Each CloudTrail entry is an array of Record objects, so if the file is properly parsed we expect one or more values in the array. We also shouldn’t see any columns failing to parse and ending up in the rescued data column, so we verify that with our expectations too. We run these checks before any additional processing or storage, which in DLT is done using a view. If either of these quality checks fail we stop the pipeline to immediately address the issues and avoid corrupting our downstream tables.

    Once the data passes these quality checks, we explode the data to get one row per event and add a few enrichment columns such as eventDate for partitioning, and the original source filename.

    Zeek and VPC Flow Logs

    We can apply this same model for Zeek and VPC flow logs. These logs are more consistent as they have a fixed format compared to CloudTrail, so we define the expected schemas up-front.

    The pipeline for VPC flow logs is very simple. Again, it uses Auto Loader to ingest the new files from S3, does some simple conversions from Unix epoch time to timestamps for the start and end columns, then generates an eventDate partition column. Again, we use data quality expectations to ensure that the timestamp conversions have been successful.

    @dlt.table(
      name="vpc_flow_logs",
      partition_cols=["eventDate"],
      table_properties={
        "quality": "bronze", 
        "pipelines.autoOptimize.managed": "true",
        "delta.autoOptimize.optimizeWrite": "true",
        "delta.autoOptimize.autoCompact": "true"
      }
    )
    @dlt.expect_all_or_fail({
      "valid start timestamp": "start is not null",
      "valid end timestamp": "end is not null"
    })
    def vpc_flow_logs():
      return (spark
              .readStream
              .format("cloudfiles")
              .options(**options)
              .schema(flow_logs_schema)
              .load(ingest_path)
              .withColumn("filename", input_file_name())
              .withColumn("start", to_timestamp(from_unixtime("start")))
              .withColumn("end", to_timestamp(from_unixtime("end")))
              .withColumn("eventDate", to_date("start")))
    

    The Zeek pipeline uses a slightly different pattern to reduce code and simplify managing several tables for each type of log. Each one has a defined schema, but rather than also defining a table for each individually, we do so dynamically at run time using a helper method that takes in a table name, log source path, and schema. This method then generates a table dynamically based on those parameters. All of the log sources have some common columns such as a timestamp so we apply some simple conversions and data quality checks, just as we did for the VPC flow logs.

    # This method dynamically generates a live table based on path, schema, and table name

    def generate_table(log_path, schema, table_name):
      @dlt.table(
        name=table_name,
        partition_cols=["eventDate"],
        table_properties={
          "quality": "bronze", 
          "pipelines.autoOptimize.managed": "true",
          "delta.autoOptimize.optimizeWrite": "true",
          "delta.autoOptimize.autoCompact": "true"
        }
      )
      @dlt.expect_or_fail("valid timestamp", "ts is not null")
      def gen_table():
        return (spark
                .readStream
                .schema(schema)
                .format("cloudfiles")
                .options(**options)
                .load(ingest_path + '/' + log_path)
                .withColumn("filename", input_file_name())
                .withColumn("ts", to_timestamp(from_unixtime("ts"))) # all sources have the same core fields like ts
                .withColumn("eventDate", to_date("ts")))
    
    generate_table("conn*", conn_schema, "conn")
    generate_table("dhcp*", dhcp_schema, "dhcp")
    generate_table("dns*", dns_schema, "dns")
    generate_table("http*", http_schema, "http")
    generate_table("notice*", notice_schema, "notice")
    generate_table("ssl*", ssl_schema, "ssl")
    

    Finally, to identify any suspicious activity from Zeek’s built-in detections, we join the connections table with the notices table to create a silver alerts table. Here, we use watermarking and a time-based join to ensure we don’t have to maintain boundless state, even in the case of late or out-of-order events.

    To identify any suspicious activity from the built-in detections provided by Zeek, Databricks  joins the connections table with the notices table to create a silver alerts table.

    When DLT executes the pipeline, the runtime builds the dependency graph for all the base tables and the alert table. Again, here we rely on DLT to scale based on the number of concurrent streams and amount of ingested data.

    Conclusion

    With a few lines of code for each pipeline, the result is a well-optimized and well-structured security lakehouse that is far more efficient than the original raw data we started with. These pipelines can run as frequently as we need: either continuously for low-latency, or on a periodic basis such as every hour or day. DLT will scale or retry the pipelines as necessary, and even manage the complicated end-to-end schema evolution for us, greatly reducing the operational burden required to maintain our cyber lakehouse.

    In addition, the Databricks Lakehouse Platform lets you store, process and analyze your data at multi-petabyte scale, allowing for much longer retention and lookback periods and advanced threat detection with data science and machine learning. What’s more, you can even query them via your SIEM tool, providing a 360 degree view of your security events.

    You can find the code for these 3 pipelines here: CloudTrail, VPC flow logs, Zeek.

    We encourage you to try Delta Live Tables on Databricks for your own data sources and look forward to your questions and suggestions. You can reach us at cybersecurity@databricks.com.

    --

    Try Databricks for free. Get started today.

    The post Building ETL pipelines for the cybersecurity lakehouse with Delta Live Tables appeared first on Databricks.

    Guide to Manufacturing Sessions at Data + AI Summit 2022

    $
    0
    0

    Download our guide to Manufacturing Industry Sessions at the Data + AI Summit to help plan your Summit experience.

     
    Data + AI Summit is fast approaching. Every year, data leaders, practitioners and visionaries from across the globe join Data + AI Summit to hear from Manufacturing, Logistics & Transportation, Energy and Technology peers and thought leaders about how they are leveraging data to speed products to market, improve operations, build agile supply chains and ultimately deliver higher return on capital invested (ROCI).

    For data teams in the Manufacturing industry, we’re excited to announce a full agenda of Manufacturing sessions. Leaders from Corning, Honeywell, John Deere, Collins Aerospace, Fedex and Tredence will share how they are using data to improve access to data, predict failures using digital twins, democratize data, and power innovation with real-world data.

    Manufacturing Industry Forum

    Join us on Wednesday, June 29th at 3:30pm PT for our Manufacturing Forum. During our capstone event, you’ll have the opportunity to join keynote and panel discussions with data analytics and AI leaders on the most pressing topics in the Manufacturing industry. Here’s a rundown of what attendees will get to explore:


    Muthu Sabarethinamn, Vice President, Enterprise Analytics & IT at Honeywell
    Keynote
    In this keynote, Muthu Sabarethinamn, Vice President, Enterprise Analytics & IT at Honeywell will share his perspectives on three imperatives driving and influencing the future of data and AI in Manufacturing 

    Forum Panel

    Join our esteemed panel of data and AI leaders from John Deere, Honeywell and Collins Aerospace discuss how data is being used to improve product performance, expand business opportunities with new lines of business, and transform manufacturing operations with efficiency and agility.


    Muthu Sabarethinamn, Vice President, Enterprise Analytics & IT at Honeywell

    Aimee DeGrauwe, Digital Product Manager

    Peter Conrardy– Executive Director, Data and Digital Systems

    Rob Saker
    RVP GTM Retail and Manufacturing

    Manufacturing Breakout Sessions

    Here’s an overview of some of our most highly-anticipated Manufacturing sessions at this year’s summit:

    Why a Data Lakehouse is Critical During the Manufacturing Apocalypse

    Heather Urbanek, Director, Digital and Advanced Analytics
    Brad Nicholas, Director, Digital Platforms, IT Emerging Technology
    Corning Inc.

    COVID has changed the way that we work and the way that we must do business. Supply chain disruptions have impacted manufacturers’ ability to manufacture and distribute products. Logistics and the lack of labor have forced us to staff differently. The existential threat is real and we must change the way that we analyze data and solve problems real time in order to stay relevant.

    In this session, you’ll learn about Corning’s journey, why the data lake and digital tech is essential to survival in this new world, some practical examples of how machine learning and data pipelines enable faster decision making, and why businesses cannot survive without these capabilities.

    Learn more

    Predicting and Preventing Machine Downtime with AI and Expert Alerts

    Jayashree Karnam, Engineering Manager – Proactive Services & Customer Product Support
    Jeremy Goebel, Manager, Aftermarket Enablement Solutions
    John Deere

    Machine and equipment failure in the field can be extremely costly for a John Deere customer. While customers expect reliability with their products, unexpected failures can happen in the field. Fixing them reactively can be time consuming and costly. John Deere equipment operators sometimes have small windows of time to complete a task (harvest, planting, construction, etc.) and could be working in distant remote locations. A reactive approach to equipment failure and downtime should be avoided at all costs.

    John Deere’s central Machine Health Monitoring Center analyzes data from thousands of connected machines. Their Product Systems Data Scientists & Analysts identify trends within the data, determine causes, and develop new and improved preventative-maintenance and repair protocols called Expert Alerts.

    Here is the story of how Apache Spark, Delta Lake and Lakehouse framework helped John Deere achieve this mission.

    Learn more

    Applied Predictive Maintenance in Aviation: Without Sensor Data

    David Taylor, Data Scientist
    Randy Provence, Data Engineer
    FedEx

    David and Randy will show how using Azure Databricks Lakehouse is modernizing FedEx’s data & analytics environment, which delivers new capability to create custom predictive models for hundreds of families of aircraft components without sensor data. FedEx currently has over 95% success rate with over $1.3 million in avoided operational impact costs in FY21.

    Learn More

    Smart Manufacturing: Real-time Process Optimization with Databricks

    Vamsi Krishna Bhupasamudram, Director Industry X.0
    Ashwin Voorkarra, Sr. Architect IoT Analytics
    Tredence

    Learn more about how a Fortune 500 aluminum rolled stock manufacturer is leveraging Tredence service and technical solutions and the Databricks Lakehouse for Manufacturing based AIoT Industrial internet of things (IIoT) solutions to improve productivity by +20%

    Learn More

    Demos on Data + AI Use Cases in Manufacturing

    Global Solution Integrator – Tredence

    • Leveraging Digital Twins to Predict Failure and Promote Uptime of a Continuous Process
    • Sancus — an AI-powered Data Quality Management Tool That Creates Master Data From Diverse Sources While Maintaining and Tracking Data Quality Over Time
    • A 360 View of Your Supply Chain With a Supply Chain Control Tower
    • Machine Learning at the Edge

    Databricks

    • Real-Time Monitoring of KPIs of Manufacturing Facilities
    • Delivering Digital Twins on the Lakehouse
    • Improving Supply Chain Agility With Part Level Forecasting
    • Demonstrating Predictive Maintenance on Rotating Equipment (wind turbine)
    • Object Detection and Classification on Live Image Streams — Computer Vision
    • Predictive Maintenance of Progressive Cavity Pumps

    Join the Manufacturing Experience at Summit!

    Make sure to register for the Data + AI Summit to take advantage of all the amazing Healthcare and Life Sciences sessions, demos and talks scheduled to take place. Registration is free!

    In the meantime, download our Guide to Manufactuirng Sessions at Data + AI Summit 2022.

    --

    Try Databricks for free. Get started today.

    The post Guide to Manufacturing Sessions at Data + AI Summit 2022 appeared first on Databricks.

    Can’t-miss Sessions Featuring MLflow

    $
    0
    0

    Data + AI Summit is the global event for the data community, where practitioners, leaders and visionaries come together to engage in thought-provoking dialogue and share the latest innovations in data and AI.

    At this year’s Data + AI Summit, we’re excited to share some of the best sessions featuring MLflow. Leading innovators from across the industry – including Doordash, Databricks, and element61 – are joining us to share how they are using MLflow to streamline the ML lifecycle to deliver on their top use cases and goals.

    Can’t-miss sessions featuring MLflow

    As the adoption of data and AI continue to skyrocket across industries, the need for an easy-to-use tool to streamline the ML lifecycle can’t be underestimated. MLflow was created to help data scientists and developers with the complex process of ML model development, which typically includes the steps to build, train, tune, deploy, and manage machine learning models.

    If you are a data scientist or ML engineer, here are three sessions highlighting the use of MLflow worth the price of admission.

    MLOps at DoorDash
    Tuesday, 5:30 PM (PDT)

    Hien Luu, DoorDash

    Streamlining ML development and productionization are important ingredients to realize the power of ML. But doing so is easier said than done as infrastructure complexities can slow progress. Join this session to learn how DoorDash is approaching MLOps, the challenges they faced, how Databricks and MLflow fit into their infrastructure, and lessons learned from their experiences.

    MLOps on Databricks: A How-To Guide
    Tuesday, 5:30 PM (PDT)

    • Niall Turbitt, Databricks
    • Rafi Kurlansik, Databricks
    • Joseph Bradley, Databricks

    Building and deploying machine learning (ML) models can be complex. At Databricks, we see firsthand how customers develop their MLOps approaches—those that work well, and those that do not. In this session, we show how your organization can build robust MLOps practices incrementally. We will unpack general principles which can guide your organization’s decisions for MLOps, presenting the most common target architectures we observe across customers.

    Implementing an End-to-End Demand Forecasting Solution Through Databricks and MLflow
    Thursday, 8:30 AM (PDT)

    • Ivana Pejeva, element61
    • Yoshi Coppens, element61

    In the retail industry, understanding customer demand is critical to driving revenue and profitability. With massive volumes of data captured daily, retailers are leveraging ML to streamline operations by forecasting customer demand and optimizing supply chain management. This session focuses on how element61 is helping top retailers improve efficiencies and sharpen fresh product production and delivery planning. By leveraging the Lakehouse Platform, they benefit from the power of Delta Lake, Feature Store, and MLflow to build a highly reliable ML factory.

    Expert MLOps trainings featuring MLflow

    Ready to streamline the ML lifecycle with Databricks Machine Learning, MLflow, and other Databricks capabilities? Check out the following training sessions tailored to your level of experience and topic of interest.

    Training: Managing Machine Learning Models
    Monday, 8:00 AM (PDT)

    • Audience: Machine learning engineers, data scientists
    • Duration: Half-day
    • Hands-on labs: Yes

    Build the foundation for efficient model management and operations at scale — from model tracking to automating the ML lifecycle — using Databricks ML, MLflow, Databricks Autologging, and more.

    Training: Deploying Machine Learning Models
    Monday, 8:00 AM (PDT)

    • Audience: Machine learning engineers, data scientists
    • Duration: Half-day
    • Hands-on labs: Yes

    Model deployment is arguably the most painful and time-consuming stage in the ML lifecycle. This training compares various model deployment strategies and provides a hands-on lab using MLflow and Spark UDFs to deploy an ML model in an incrementally processed streaming environment.

    Training: Managing Machine Learning Models
    Monday, 8:00 AM (PDT), 1:00 PM (PDT)

    • Audience: Machine learning engineers, data scientists
    • Duration: Half-day
    • Hands-on labs: Yes

    The key to accelerating the ML lifecycle is to automate the most time-consuming manual, repeated and error-prone processes. This training will teach learners how to automate the ML lifecycle and streamline model management using MLflow Tracking, MLflow Model Registry, MLflow Model Registry Webhooks, and Databricks Jobs.

    Training: Advanced Machine Learning with Databricks — Bundle: Day 1
    Monday, 8:00 AM (PDT), 1:00 PM (PDT)

    Training: Advanced Machine Learning with Databricks — Bundle: Day 2
    Thursday, 8:00 AM (PDT)

    • Audience: Machine learning engineers, data scientists
    • Duration: 2 days
    • Hands-on labs: Yes

    Ready to take your ML engineering skills to the next level? Learners will gain advanced ML engineering skills enabling them to organize, scale, and operationalize ML applications using Databricks.

    Productionizing Ethical Credit Scoring Systems with Delta Lake, Feature Store and MLFlow
    Tuesday, 4:00 PM (PDT)

    Jeanne Choo, Databricks

    This talk aims to illustrate how ethical principles can be operationalized, monitored and maintained in production using tools such as Delta Lake and MLflow, thus moving beyond only accuracy-based metrics of model performance and towards a more holistic and principled way of building machine learning systems.

    Sign up for MLflow talks at Summit!

    Make sure to register for the Data + AI Summit to take advantage of all the amazing sessions and trainings featuring MLflow. Registration is free!

    --

    Try Databricks for free. Get started today.

    The post Can’t-miss Sessions Featuring MLflow appeared first on Databricks.

    Guide to Public Sector Sessions at Data + AI Summit 2022

    $
    0
    0

    Every year, data leaders, practitioners and visionaries from across the globe and industries join the Data + AI Summit to discuss the latest trends in big data. For data teams in the Public Sector, we’re excited to announce a full agenda of Public Sector sessions. Leaders from USPS OIG, CDC, Veterans Affairs, US Air Force, State of CA, SOCOM, DoD Advana and many other industry organizations will share how they are using data to modernize agency operations and make smarter decisions that minimize risk, accelerate innovation and improve citizen services.

    Public Sector Forum

    Data is at the core of nearly every innovation in the Public Sector. Leaders across the Federal, State and Local government are harnessing the power of data and analytics.

    Join us on Wednesday, June 29 at 11am PT for our Public Sector Forum, our most popular industry event at Data + AI Summit. During our capstone event, you’ll have the opportunity to join sessions with thought leaders from some of the most innovative government agencies.

    Featured Speakers:
    Howard Levenson, VP Federal, Databricks
    Rishi Tarar, Chief Enterprise Architect, CDC
    Alan Sim, CDO, CDC
    Thomas Kenney, CDO SOCOM
    Fredy Diaz, Analytics Director at USPS Office of Inspector General
    John S. Scott, MD, Acting Director, Data Management and Analytics, US Department of Veterans Affairs
    Cody Ferguson, Data Operations Lead, DoD Advana
    Brad Corwin, Chief Data Scientist, Booz Allen Hamilton

    Public Sector breakout sessions

    Here’s an overview of some of our most highly-anticipated PublicSector sessions at this year’s summit:

    Migrating Complex SAS Processes to Databricks – Case Study
    Jessie Beaumont, Tensile AI LLC and Uday Kumar, Akira Technologies

    Many federal agencies use SAS software for critical operational data processes. While SAS has historically been a leader in analytics, it has often been used by data analysts for ETL purposes as well. However, modern data science demands on ever-increasing volumes and types of data require a shift to modern, cloud architectures and data management tools and paradigms for ETL/ELT. In this presentation, we will provide a case study at Centers for Medicare and Medicaid Services (CMS) detailing the approach and results of migrating a large, complex legacy SAS process to modern, open-source/open-standard technology – Spark SQL & Databricks – to produce results ~75% faster and without reliance on proprietary constructs of the SAS language. The technical and business benefits derived from this modernization effort will be detailed in this presentation.

    Learn more


    Cloud and Data Science Modernization of Veterans Affairs Financial Service Center with Azure Databricks
    David Fuller, Chief, Data Analytics Division, US Department of Veterans Affairs and Cary Moore, Senior Solutions Architect, Databricks

    The Department of Veterans Affairs (VA) is home to over 420,000 employees, provides health care for 9.16 million enrollees and manages the benefits of 5.75 million recipients. The VA also hosts an array of financial management, professional, and administrative services at their Financial Service Center (FSC), located in Austin, Texas. The FSC is divided into various service groups organized around revenue centers and product lines, including the Data Analytics Service (DAS). To support the VA mission, in 2021 FSC DAS continued to press forward with their cloud modernization efforts, successfully achieving four key accomplishments. This talk discusses FSC DAS’ cloud and data science modernization accomplishments in 2021, lessons learned, and what’s ahead.

    Learn more


    Implementing a Framework for Data Security and Policy at a Large Public Sector Agency
    Dave Thomas, Principal, Deloitte and Danny Holloway, CTO, Public Sector, Immuta

    Most large public sector and government agencies all have multiple data-driven initiatives being implemented or considered across functional domains. But, as they scale these efforts they need to ensure data security and quality are top priorities. In this session, the presenters discuss the core elements of a successful data security and quality framework, including best practices, potential pitfalls, and recommendations based on success with a large federal agency.

    Learn more


    Enabling Advanced Analytics at The Department of State using Databricks
    Brendan Barsness, Analytics Architect, Deloitte and Mark Lopez, Specialist Master, Deloitte

    The Center for Analytics (CFA) is the State Department’s first enterprise-wide capability to transform data into valuable insights to inform foreign policy and management decisions essential to the Department’s diplomatic mission. The Department leverages Azure Databricks to enable the processing and enrichment of high-volume datasets, sourced from operational applications, that feed downstream analytic products.

    This session will provide an overview of the different analytic use cases implemented using Azure Databricks for scalable data processing and enrichment in a secure environment. We will show how integrating Azure Databricks into CFA analytic workflows has enabled advanced analytics by providing a scalable, repeatable data engineering process.

    Learn more


    Secure Data Distribution and Insights with Databricks on AWS
    Kayla Grieme, Solutions Architect, Databricks and Nicole Murray, Senior Solutions Architect, AWS

    In this session, we will discuss challenges faced in the public sector when expanding to AWS cloud. We will review best practices for managing access and data integrity for a cloud-based data lakehouse with Databricks, and discuss recommended approaches for securing your AWS Cloud environment. We will highlight ways to enable compliance by developing a continuous monitoring strategy and providing tips for implementation of defense in depth. This guide will provide critical questions to ask, an overall strategy, and specific recommendations to serve all security leaders and data engineers in the Public Sector.

    Learn more


    Data Lake for State Health Exchange Analytics using Databricks
    Deven Dharm, Specialist Leader, Deloitte and Perminder Bagri, Enterprise Infrastructure Chief, Office of System Integration, State of CA

    The California Healthcare Eligibility, Enrollment, and Retention System (CalHEERS)—one of the largest State-based health exchanges in the country—was looking to modernize their data warehouse (DWH) environment to support the vision that every decision to design, implement and evaluate their state-based health exchange portal was informed by timely and rigorous evidence about its consumers’ experience. The scope of the project was to replace the existing Oracle-based DWH with an analytics platform that could support a much broader range of requirements with ability to provide unified analytics capabilities including ML. The modernized analytics platform comprises a cloud native data lake and DWH solution using Databricks Lakehouse Platform along with other key technologies. This lakehouse oriented architecture provides significantly higher performance and elastic scalability to better handle larger/varying data volumes with much lower cost of ownership compared to the existing solution. The solution replaced a massive oracle-based infrastructure with a server-less solution using Databricks to ingest data from the source systems into an AWS S3 data lake where the data is curated prior to provisioning it to the downstream data marts and reports.

    Learn more


    Check out the full list of Public Sector talks at Summit.

    Demos on popular data + AI use case in public sector

    Entity Analytics Population Health SAS Migration Unlocking Sensitive Use Cases with Automated Data Access

    Sign-up for the Public Sector Experience at Summit!

    --

    Try Databricks for free. Get started today.

    The post Guide to Public Sector Sessions at Data + AI Summit 2022 appeared first on Databricks.


    Jumbo Transforms How They Delight Customers With Data-Driven Personalized Experiences

    $
    0
    0

    This is a collaborative post between Databricks and Jumbo. We thank Wendell Kuling, Manager Data Science and Analytics at Jumbo Supermarkten, for his contribution.

     
    At Jumbo, a leading supermarket chain in the Netherlands and Belgium with more than 100 years of history, we pride ourselves on a ‘customers first, data second’ approach to business. However, this doesn’t mean that data isn’t central to our mission. Rather, our organization and data teams are completely built around customer satisfaction and loyalty. Supermarkets operate in an extremely competitive and complex space, in which all components of the customer experience require optimization, including inventory, assortment selection, pricing strategies, and product importance per segment.

    When we rolled out our loyalty program, the amount of new customer data points that started coming in got our data teams to rethink about how we optimize the customer experience at scale. At its core, Jumbo seeks to delight customers and deliver optimal grocery shopping experiences. Running differentiated store formats on one hand, and personalizing messages and offers to customers on the other, made it impossible to continue working in the traditional way. That’s where data analytics and AI come in: they help us to make decisions at the scale required for personalization and differentiation.

    With the rollout of our revamped customer loyalty program, we were suddenly able to better understand a wide range of our individual customer preferences, such as which products are most important and which are often forgotten, as well as the best time of day to communicate with customers and on which channel. However, as data volumes grew exponentially, our analytics and ML capabilities began to slow as we weren’t equipped to handle such scale. Increased data volumes meant increased complexity and resources required to try to handle it from an infrastructure perspective, which impacted our ability to deliver insights in a timely manner. Long processing and querying times were unacceptable. After years on a traditional statistical software package connecting to a traditional RDBMS and analytics in Jupyter notebooks, we knew that if we wanted to best use this data and deliver shopping experiences that make a difference, it was time for us to take steps to modernize our approach and the underlying technologies that enable it. We needed a platform that was able to crunch through customer-level data and train models at a scale much more than we could handle on our individual machines.

    In addition to needing to modernize our infrastructure to help us thrive with big data analytics, we also needed better ways to increase the speed from concept to production, decrease onboarding time for new people, collaborate and deliver self-service access to data insights for our analysts and business users to help serve insights around pricing, inventory, merchandising, and customer preferences. After looking into a variety of options, we selected the Databricks Lakehouse Platform as the right solution for our needs.

    From foundational customer loyalty to exceptional customer experiences

    With Databricks’ Lakehouse implemented, we now run a substantial number of data science and data engineering initiatives in parallel to turn our millions of customers into even more loyal fans.

    As an example of data products exposed directly to customers, we’re now able to combine, on a customer level, information about purchases made online and offline which was very challenging before. This omnichannel view allows us to create a more comprehensive recommendation engine online, which has seen tremendous engagement. Now, based on past purchasing history as well as first party data collected with consent, we can serve product-relevant recommendations that pique the interests of the consumer. Obviously, this is great from a business perspective, but the real benefit is how happy it’s made our customers. Now, they’re less likely to forget important items or purchase more than they need. This balance has significantly increased customer loyalty.

    One example data products that have helped improve the customer experience, we continually run an algorithm that proactively suggests assortment optimizations to assortment managers. This algorithm needs to run at scale at acceptable costs, as it optimizes using large quantities of data on physical store and online customers, the overall market, financials and store-level geographical characteristics. Once opportunities are identified, it is presented in combination with the same breadth and depth of data upon which it was based.

    From a technical perspective, the Databricks Lakehouse architecture is able to drive these improved experiences with the help of Microsoft Azure Synapse. Together, this combo has allowed us to manage, explore and prepare data for analysis for automated (proposed) decision making, and make that analysis easy to digest via BI tools such as Power BI. With deeper insights, we have helped spread a more meaningful understanding of customer behavior and empowered our data teams to more effectively predict the products and services they would want.

    Databricks is now fully integrated into our end-to-end workflow. The process starts with a unified Lakehouse architecture, which leverages Delta Lake to standardize access to all relevant data sources (both historical and real-time). For example, Delta Lake also helps to build data pipelines that enable scalable, real-time analytics to reduce in-store stockouts for customers and at the same time reduce unnecessary food waste due to over-ordering perishables, such as fresh produce, that won’t sell. At the same time, Databricks SQL provides our data analysts with the ability to easily query our data to better understand customer service issues, processed with NLP in the background, and relate these issues to the operational performance of different departments involved. This helps us to make improvements faster that improve the customer experience most.

    [data architecture diagram here]

    We would not have been able to accelerate our modernization efforts without the expert training and technical guidance from the Databricks Academy and Customer Success Engineer, which acts as a direct injection of knowledge for our data science department. This deeper understanding of how to leverage all our data has led to significant improvements in how we manage our assortment, supply chain, make strategic decisions, and better support our customers’ evolving needs.

    Excellence has no ceiling when driven by data and AI

    By focusing on improving the customer experience through Delta Lakehouse, we were enabled beyond our initial expectations. The steps we’ve taken to modernize our approach to how we can use data have really set us up as we continue to transform our business in a way that pushes our industry forward.

    It’s remarkable to see how quickly data and AI capabilities are becoming the new normal and we are now well positioned to realize the direct impact of our efforts to be data-driven. The output of sophisticated machine learning models is considered ‘common practice’ within 4 weeks after introduction. And the speed of idea to production is counted in weeks nowadays, not months.

    Going forward, we’ll continue to see the adoption level increase, not just at Jumbo, but across all of commerce. And for those who are also embarking on a data transformation, I would strongly recommend that they take a closer look at improvement possibilities in the experience they’re providing customers. Feeding back your analytics data-products into operational processes at scale is key to transforming all areas of the business forward and successfully into the future.

    --

    Try Databricks for free. Get started today.

    The post Jumbo Transforms How They Delight Customers With Data-Driven Personalized Experiences appeared first on Databricks.

    Announcing the Availability of Data Lineage With Unity Catalog

    $
    0
    0

    We are excited to announce that data lineage for Unity Catalog, the unified governance solution for all data and AI assets on lakehouse, is now available in preview.

    This blog will discuss the importance of data lineage, some of the common use cases, our vision for better data transparency and data understanding with data lineage, and a sneak peek into some of the data provenance and governance features we’re building.

    What is data lineage and why is it important?

    Data lineage describes the transformations and refinements of data from source to insight. Lineage includes capturing all the relevant metadata and events associated with the data in its lifecycle, including the source of the data set, what other data sets were used to create it, who created it and when, what transformations were performed, what other data sets leverage it, and many other events and attributes. With a data lineage solution, data teams get an end-to-end view of how data is transformed and how it flows across their data estate.

    As more and more organizations embrace a data-driven culture and set up processes and tools to democratize and scale data and AI, data lineage is becoming an essential pillar of a pragmatic data management and governance strategy.

    To understand the importance of data lineage, we have highlighted some of the common use cases we have heard from our customers below.

    Impact analysis

    Data goes through multiple updates or revisions over its lifecycle, and understanding the potential impact of any data changes on downstream consumers becomes important from a risk management standpoint. With data lineage, data teams can see all the downstream consumers — applications, dashboards, machine learning models or data sets, etc. — impacted by data changes, understand the severity of the impact, and notify the relevant stakeholders. Lineage also helps IT teams proactively communicate data migrations to the appropriate teams, ensuring business continuity.

    Data understanding and transparency

    Organizations deal with an influx of data from multiple sources, and building a better understanding of the context around data is paramount to ensure the trustworthiness of the data. Data lineage is a powerful tool that enables data leaders to drive better transparency and understanding of data in their organizations. Data lineage also empowers data consumers such as data scientists, data engineers and data analysts to be context-aware as they perform analyses, resulting in better quality outcomes. Finally, data stewards can see which data sets are no longer accessed or have become obsolete to retire unnecessary data and ensure data quality for end business users .

    Debugging and diagnostics

    You can have all the checks and balances in place, but something will eventually break. Data lineage helps data teams perform a root cause analysis of any errors in their data pipelines, applications, dashboards, machine learning models, etc. by tracing the error to its source. This significantly reduces the debugging time, saving days, or in many cases, months of manual effort.

    Compliance and audit readiness

    Many compliance regulations, such as the General Data Protection Regulation (GDPR), California Consumer Privacy Act (CCPA), Health Insurance Portability and Accountability Act (HIPPA), Basel Committee on Banking Supervision (BCBS) 239, and Sarbanes-Oxley Act (SOX), require organizations to have clear understanding and visibility of data flow. As a result, data traceability becomes a key requirement in order for their data architecture to meet legal regulations. Data lineage helps organizations be compliant and audit-ready, thereby alleviating the operational overhead of manually creating the trails of data flows for audit reporting purposes.

    Effortless transparency and proactive control with data lineage

    The lakehouse provides a pragmatic data management architecture that substantially simplifies enterprise data infrastructure and accelerates innovation by unifying your data warehousing and AI use cases on a single platform. We believe data lineage is a key enabler of better data transparency and data understanding in your lakehouse, surfacing the relationships between data, jobs, and consumers, and helping organizations move toward proactive data management practices. For example:

    • As the owner of a dashboard, do you want to be notified next time that a table your dashboard depends upon wasn’t loaded correctly?
    • As a machine learning practitioner developing a model, do you want to be alerted that a critical feature in your model will be deprecated soon?
    • As a governance admin, do you want to automatically control access to data based on its provenance?

    All of these capabilities rely upon the automatic collection of data lineage across all use cases and personas — which is why the lakehouse and data lineage are a powerful combination.

    Here are some of the features we are shipping in the preview:

    • Automated run-time lineage: Unity Catalog automatically captures lineage generated by operations executed in Databricks. This helps data teams save significant time compared to manually tagging the data to create a lineage graph.
    • Support for all workloads: Lineage is not limited to just SQL. It works across all workloads in any language supported by Databricks – Python, SQL, R, and Scala. This empowers all personas — data analysts, data scientists, ML experts — to augment their tools with data intelligence and context surrounding the data, resulting in better insights.
    • Lineage at column level granularity: The Unity Catalog captures data lineage for tables, views, and columns. This information is displayed in real-time, enabling data teams to have a granular view of how data flows both upstream and downstream from a particular table or column in the lakehouse with just a few clicks.
    • Lineage for notebooks, workflows, and dashboards: Unity Catalog can also capture lineage associated with non-data entities, such as notebooks, workflows, and dashboards. This helps with end-to-end visibility into how data is used in your organization. As a result, you can answer key questions like, “if I deprecate this column, who is impacted?”

    • Data lineage for tables


      Data lineage for table columns


      Data Lineage for notebooks, workflows, dashboards

    • Built-in security: Lineage graphs in Unity Catalog are privilege-aware and share the same permission model as Unity Catalog. If users do not have access to a table, they will not be able to explore the lineage associated with the table, adding an additional layer of security for privacy considerations.
    • Easily exportable via REST API: Lineage can be visualized in the Data Explorer in near real-time, and retrieved via REST API to support integrations with our catalog partners.

    Getting started with data lineage in Unity Catalog

    Data lineage is in preview on AWS and Azure. To try data lineage in Unity Catalog, please reach out to your Databricks account executives.

    --

    Try Databricks for free. Get started today.

    The post Announcing the Availability of Data Lineage With Unity Catalog appeared first on Databricks.

    7 Reasons to Migrate From Your Cloud-Based Hadoop to the Databricks Lakehouse Platform

    $
    0
    0

    Over the past several years, many enterprises have migrated their legacy on-prem Hadoop workloads to cloud-based managed services like EMR, HDInsight, or DataProc. However, customers have started recognizing that the same challenges faced within their on-prem Hadoop environment (like reliability and scalability) get inherited into their existing cloud-based Hadoop platform. They observe that any cluster launch takes a long time to provision and even more time to autoscale during peak hours. As a result, they maintain long-running, overprovisioned clusters to manage the workload demands. A lot of time is spent on troubleshooting, infrastructure, resource management overhead and stitching different managed services on the cloud to maintain an end to end pipeline.

    Finally, this leads to wasted resources, complicating security and governance and escalating unnecessary costs. Customers ultimately want their data teams to be able to focus on solving business challenges, rather than troubleshooting inherited Hadoop platform issues.

    In this blog, we’ll discuss the values and benefits of migrating from a cloud-based Hadoop platform to the Databricks Lakehouse Platform.

    Here are some notable benefits and reasons to consider migration from those cloud-based Hadoop services to Databricks.

    • Simplify your architecture with the Lakehouse Platform
    • Centralized data governance and security
    • Best-in-class performance for all data workloads
    • Increased productivity gains and business value
    • Driving innovation with data and AI
    • A cloud agnostic platform
    • Benefits of Databricks Partner ecosystem

    Let’s discuss in more detail and learn about these 7 reasons.

    1) Simplify your architecture with the Lakehouse Platform

    The Databricks Lakehouse Platform combines the best elements of data lakes and data warehouses to deliver the reliability, governance and performance of data warehouses with the openness, flexibility and machine learning support of data lakes.

    Often, cloud-based Hadoop platforms are used for specific use cases like data engineering and need to be augmented with other services and products for streaming, BI, and data science use cases. This leads to a complicated architecture that creates data silos and isolated teams, posing security and governance challenges.

    The Lakehouse Platform provides a unified approach that simplifies your data stack by eliminating these complexities.

    The Lakehouse Platform provides a unified approach that simplifies the modern data stack by eliminating the complexities of data warehousing, engineering, streaming and data science/machine learning use cases.

    2) Centralized data governance and security

    Databricks brings fine-grained governance and security to lakehouse data with Unity Catalog. Unity Catalog allows organizations to manage fine-grained data permissions using standard ANSI SQL or a simple UI, enabling them to unlock their lakehouse for consumption safely. It works uniformly across clouds and data types.

    Unity Catalog moves beyond just managing tables to other data assets, such as machine learning models and files. As a result, enterprises can simplify how they govern all their data and AI assets. It is a critical architectural tenet for enterprises and one of the key reasons customers migrate to Databricks instead of using a cloud-based Hadoop platform.

    Databricks brings fine-grained governance and security to lakehouse data with Unity Catalog.

    At a high level, Unity Catalog provides the following key capabilities:

    • Centralized metadata and user management
    • Centralized data access controls
    • Data lineage
    • Data access auditing
    • Data search and discovery
    • Secure data sharing with Delta Sharing

    Apart from Unity Catalog, Databricks has features like Table Access Controls (TACLs), and IAM role credential passthrough which enable you to meet your data governance needs. For more details, visit the Data Governance documentation.

    Additionally, with Delta Lake, you automatically reap the benefits of schema enforcement and schema evolution support out of the box.

    Using Delta Sharing, you can securely share data across organizations in real time, independent of the platform on which the data resides. It is natively integrated into the Databricks Lakehouse Platform so you can centrally discover, manage and govern all of your shared data on one platform.

    3) Best-in-class performance for all data workloads

    Customers get best-in-class performance by migrating to the Databricks Photon engine, which provides high-speed query performance at a low cost for all types of workloads directly on top of the lakehouse.

    • With Photon, most analytics workloads can meet or exceed data warehouse performance without moving data into a data warehouse.
    • Photon is compatible with Apache Spark™ APIs and SQL, so getting started is as easy as turning it on.
    • Written from the ground up in C++, Photon takes advantage of modern hardware for faster queries, providing better price/performance than other cloud data warehouses. For more details, please visit the blog post at data-warehousing-performance-record

    Apart from this, Databricks Enhanced Autoscaling optimizes cluster utilization by automatically allocating cluster resources based upon workload volume, with minimal impact on the data processing latency of your pipelines. Cluster scaling is a significant concern with cloud-based Hadoop platforms, and in some cases, it takes up to 30 minutes to autoscale.

    As a result of Databricks’ superior performance compared to the cloud-based Hadoop platforms, the overall total cost of ownership dramatically decreases. Customers realize a reduced infrastructure spend and better price/performance simultaneously.

    4) Increased productivity gains and business value

    Customers can move faster, collaborate better and operate more efficiently when they migrate to Databricks.

    • Databricks removes the technical barriers that limit collaboration among analysts, data scientists, and data engineers, enabling data teams to work together more efficiently. Customers see higher productivity among data scientists, data engineers and sql analysts eliminating manual overhead.
    • Databricks’ customers significantly accelerate time-to-value, and increase revenues by enabling data engineering, data science and BI teams to build end-to-end pipelines. On the other hand, they realized that it was impossible to achieve the same using a cloud-based Hadoop platform, where multiple services must be stitched together to deliver the needed data products.

    With increased productivity, Databricks helps unlock new business use cases, accelerating and expanding value realization from business-oriented use cases.

    A recent Forrester study titled The Total Economic Impact™ (TEI) of the Databricks Unified Data Analytics Platform found that organizations deploying Databricks realize nearly $29 million in total economic benefits and a return on investment of 417% over a three-year period. They also concluded that the Databricks platform pays for itself in less than six months.

    5) Driving innovation with data and AI

    Databricks is a comprehensive, unified platform that caters to all personas critical in delivering business value from data, like data engineers, data scientists & ML engineers, as well as SQL & BI analysts. Any member of your data team can quickly build an end-to-end data pipeline, starting with data ingestion, curation, feature engineering, model training, and validation to deployment within Databricks. On top of that, the data processing can be interchangeably implemented in both batch and streaming, utilizing the Lakehouse architecture.

    Unlike cloud-based Hadoop platforms, Databricks constantly strives to innovate and provide its users with a modern data platform experience. Here are some of the notable platform features available to anyone using Databricks:

    Lakehouse interoperability using Delta on any cloud storage

    Delta Lake is an open format storage layer that delivers reliability, security and performance on your data lake — for both streaming and batch operations. By replacing data silos with a single home for structured, semi-structured and unstructured data, Delta Lake is the foundation of a cost-effective, highly scalable lakehouse. Compared to other alternative open format storage layers like Iceberg and Hudi, Delta Lake is the most performant and widely used format in the Lakehouse architecture.

    ETL development using Delta Live Tables

    Delta Live Tables (DLT) is the first ETL framework that uses a simple declarative approach to building reliable data pipelines and automatically managing your infrastructure at scale, so that data analysts and engineers can spend less time on tooling and focus on getting value from data. With DLT, engineers are able to treat their data as code and apply modern software engineering best practices like testing, error handling, monitoring and documentation to deploy reliable pipelines at scale.

    Easy & automatic data ingestion with Auto Loader

    One of the most common challenges is simply ingesting and processing data from cloud storage into your Lakehouse consistently and automatically. Databricks Auto Loader simplifies the data ingestion process by scaling automated data loading from cloud storages in streaming or batch mode.

    Bring your warehouse to the data lake using Databricks SQL

    Databricks SQL (DB SQL) allows customers to operate a multi-cloud lakehouse architecture within their data lake, and provides up to 12x better price/performance than traditional cloud data warehouses, open-source big data frameworks, or distributed query engines.

    Managing the complete machine learning lifecycle with MLflow

    MLflow, an open-source platform developed by Databricks, helps manage the complete machine learning lifecycle with enterprise reliability, security and scale. One immediately realizes the benefits of being able to perform experiment tracking, model management and model deployment with ease.

    Automate your Machine Learning Lifecycle with AutoML

    Databricks AutoML allows you to generate baseline machine learning models and notebooks quickly. ML experts can accelerate their workflow by fast-forwarding through the usual trial-and-error and focusing on customizations using their domain knowledge, and citizen data scientists can quickly achieve usable results with a low-code approach.

    Build your Feature Store within the Lakehouse

    Databricks provides data teams with the ability to create new features, explore and reuse existing ones, publish features to low-latency online stores, build training data sets and retrieve feature values for batch inference using Databricks Feature Store. It is a centralized repository of features. It enables feature sharing and discovery across your organization and also ensures that the same feature computation code is used for model training and inference.

    Reliable orchestration with Workflows

    Databricks Workflows is the fully-managed orchestration service for all your data, analytics, and AI needs. You can create and run reliable production workloads on any cloud while providing deep and centralized monitoring with simplicity for end-users. Workflows allow users to build ETL pipelines that are automatically managed, including ingestion, and lineage, using Delta Live Tables. You can also orchestrate any combination of Notebooks, SQL, Spark, ML models, and dbt as a Jobs workflow, including calls to other systems.

    6) A cloud agnostic platform

    A multi-cloud strategy is becoming essential for organizations that need an open platform to do unified data analytics, all the way from ingestion, to BI and AI.

    • With data in multiple clouds, organizations can’t afford to be constrained by one cloud’s native services, since their existence now depends on the data residing on their cloud storage.
    • Organizations need a multi-cloud platform that provides visibility, control, security and governance in a consistent manner for all their teams regardless of which clouds they are using.
    • The Databricks Lakehouse Platform empowers customers to leverage multiple clouds through a unified data platform that uses open standards.

    As a cloud-agnostic platform, Databricks workloads run similarly across any cloud platform while leveraging the existing data lake on each cloud storage. As a user, once you migrate the workloads to Databricks, you can use the same open source code interchangeably on any cloud. It mitigates the risks of locking you in a cloud-native Hadoop platform.

    7) Benefits of Databricks Partner ecosystem

    Databricks is an integral part of the modern data stack, enabling digital natives and enterprises to mobilize data assets for more informed decisions fast. It has a rich partner ecosystem (over 450 partners globally) that allows this to occur seamlessly across the various phases of a data journey, from data ingestion, building data pipelines, data governance, data science and machine learning to BI/Dashboards.

    Within Databricks, Partner Connect allows you to integrate your lakehouse with popular data platforms like dbt, Fivetran, Tableau, Labelbox, etc. and set it up in a few clicks with pre-built integrations.

    Unlike cloud-based Hadoop platforms, with Databricks, you can build your end to end pipeline with just a few clicks and rapidly expand the capabilities of your lakehouse. To find out more about Databricks technology partners, visit www.databricks.com/technology.

    With its rich partner ecosystem, Databricks allows you to seamlessly mobilize your data assets across the various phases of the data journey.

    Next Steps

    Migration from one platform to another is not an easy decision to make. It involves
    evaluating the current architecture, reviewing the challenges and pain points, and validating the suitability and sustainability of the new platform. However, organizations always look to do more with their data and stay competitive by empowering their data teams with innovative technologies to do more analytics and AI, while reducing infrastructure maintenance and administration burdens. To achieve these near and long-term goals, customers need a solution that goes beyond the legacy on-prem or cloud-based Hadoop solutions. Explore each of the 7 reasons in this blog and see how these can bring values to your business.

    For more information about the Databricks migration values and offerings, visit www.databricks.com/migration.

    --

    Try Databricks for free. Get started today.

    The post 7 Reasons to Migrate From Your Cloud-Based Hadoop to the Databricks Lakehouse Platform appeared first on Databricks.

    Guide to Media & Entertainment Sessions at Data + AI Summit 2022

    $
    0
    0

    Download our guide to Communications, Media & Entertainment at Data + AI Summit to help plan your Summit experience.

     
    The time for Data + AI Summit is here! Every year, data leaders, practitioners and visionaries from across the globe and industries come together to discuss the latest trends in big data. For data teams in Communications, Media & Entertainment, we have organized a stellar lineup of sessions with industry leaders including Adobe, Axciom, AT&T, Condé Nast, Discovery, LaLiga, WarnerMedia and many more. We are also featuring a series of interactive solution demos to help you get started innovating with AI.

    Media & Entertainment Forum

    There are few industries that have been disrupted more by the digital age than media & entertainment. With the consumer expectation for entertainment everywhere, teams are building smarter, more personalized experiences making data and AI table stakes for success.

    Join us on Wednesday, June 29 at 330pm PT for our Media & Entertainment Forum, one of the most popular industry events at Data + AI Summit. During our capstone event, you’ll have the opportunity to join sessions with thought leaders from some of the biggest global brands.

    Featured Speakers:

    • Steve Sobel, Global Industry Leader, Media & Entertainment, Databricks
    • Duan Peng, SVP, Global Data & AI, WarnerMedia Direct-to-Consumer
    • Martin Ma, Group VP, Engineering, Discovery
    • Rafael Zambrano López, Head of Data Science, LaLiga
    • Bhavna Godhania, Senior Director, Strategic Partnerships, Acxiom
    • Michael Stuart, VP, Marketing Science, Condé Nast
    • Bin Mu, VP, Data and Analytics, Adobe

    Communications, Media & Entertainment Breakout Sessions

    Here’s an overview of some of our most highly-anticipated Communications, Media & Entertainment sessions at this year’s summit:

    Building and Managing a Platform for 13+ PB Delta Lake and Thousands of Users — AT&T Story
    Praveen Vemulapalli, AT&T

    Every CIO/CDO is going through a digital transformation journey in some shape or form for agility, cost savings and competitive advantage. We all know that data is pure and factual. It can lead to a greater understanding of a business, and when translated correctly into information can provide human and business systems valuable insights to make better decisions.

    The Lakehouse paradigm helps realize these benefits through adoption of the key open source technologies such as Delta Lake, Spark and MLflow that Databricks provides with enterprise features.

    In this talk, walk through the cloud journey of migrating 13+ PB of Hadoop data along with thousands of user workloads. As the owner of the platform team for Chief Data Office at AT&T, Praveen will share some of the key challenges and architectural decisions made along the way for a successful Databricks deployment.

    Learn more


    Ensuring Correct Distributed Writes to Delta Lake in Rust With Formal Verification
    QP Hou, Neuralink

    Rust guarantees zero memory access bugs once a program compiles. However, one can still introduce logical bugs in the implementation.

    In this talk, QP will first give a high-level overview on common formal verification methods used in distributed system designs and implementations. Then, learn about how the team used TLA+ and Stateright to formally model delta-rs’ multi-writer S3 back-end implementation. The end result of combining both Rust and formal verification is that they ended up with an efficient native Delta Lake implementation that is both memory safe and logical bug-free!

    Learn more


    How AT&T Data Science Team Solved an Insurmountable Big Data Challenge on Databricks with Two Different Approaches using Photon and RAPIDS Accelerator for Apache Spark
    Chris Vo, AT&T | Hao Zhu, NVIDIA

    Data-driven personalization is an insurmountable challenge for AT&T’s data science team because of the size of datasets and complexity of data engineering. More often, these data preparation tasks not only take several hours or days to complete, but some of these tasks fail to complete affecting productivity.

    In this session, the AT&T Data Science team will talk about how RAPIDS Accelerator for Apache Spark and Photon runtime on Databricks can be leveraged to process these extremely large datasets resulting in improved content recommendation, classification, etc while reducing infrastructure costs. The team will compare speedups and costs to the regular Databricks runtime Apache Spark environment. The size of tested datasets vary from 2TB – 50TB, which consists of data collected from for 1 day to 31 days.

    The talk will showcase the results from both RAPIDS accelerator for Apache Spark and Databricks Photon runtime.

    Learn more


    Technical and Tactical Football Analysis Through Data
    Rafael Zambrano, LaLiga Tech

    How LaLiga uses and combines eventing and tracking data to implement novel analytics and metrics, thus helping analysts to better understand the technical and tactical aspects of their clubs. This presentation will explain the treatment of these data and its subsequent use to create metrics and analytical models.

    Learn more


    Beyond Daily Batch Processing: Operational Trade-Offs of Microbatch, Incremental and Real-Time Processing for Your ETLs (and Your Team’s Sanity)
    Valerie Burchby, Netflix

    Are you considering converting some batch daily pipelines to a real-time system? Perhaps restating multiple days of batch data is becoming unscalable for your pipelines. Maybe a short SLA is music to your stakeholders’ ears. If you’re Flink-curious or possibly just sick of pondering your late arriving data, this discussion is for you.

    On the Streaming Data Science and Engineering team at Netflix, we support business-critical daily batch, hourly batch, incremental and real-time pipelines with a rotating on-call system. In this presentation, Valerie discusses the trade-offs between these systems, with an emphasis on operational support when things go sideways. Valerie will also share some learnings about “goodness of fit” per processing type amongst various workloads, with an eye for keeping your data timely and your colleagues sane.

    Learn more


    Streaming Data Into Delta Lake With Rust and Kafka
    Christian Williams, Scribd

    The future of Scribd’s data platform is trending towards real time. A notable challenge has been streaming data into Delta Lake in a fast, reliable and efficient manner. To help address this problem, the data team developed two foundational open source projects: delta-rs, to allow Rust to read/write Delta Lake tables, and kafka-delta-ingest, to quickly and cheaply ingest structured data from Kafka.

    In this talk, Christian reviews the architecture of kafka-delta-ingest and how it fits into a larger real-time data ecosystem at Scribd.

    Learn more


    Building Telecommunication Data Lakehouse for AI and BI at Scale
    Mo Namazi, Vodafone

    Vodafone AU aims to build best practices for machine learning on Cloud Platforms to adapt many different industrial needs.

    This session will talk through the journey of building Lakehouse, analytics pipeline, data product and ML system for internal and external purposes. It’ll also focus on how Vodafone AU practices machine learning development and operation at scale, minimises the deployment and maintenance costs, and rolls out rapid changes with adequate secure governance. More specifically, it defines a common framework cross different functional teams (such as Data Scientist, ML Engineer, DevOps Engineer, etc.) to collaboratively working on producing predictive results efficiently with managed services via reducing technical overhead within a ML system. With tools and features like Spark, MLflow, and Databricks, it becomes viable to easily adapt machine learning capability into use cases such as Customer Profiling, Call Centre Analytics, Network Analytics, etc.

    Learn more


    Building Recommendation Systems Using Graph Neural Networks
    Swamy Sriharsha, Condé Nast

    RECKON (RECommendation systems using KnOwledge Networks) is a machine learning project centered around improving the entities’ intelligence.

    RECKON uses a GNN based encoder-decoder architecture to learn representations for important entities in their data by leveraging both their individual features and the interactions between them through repeated graph convolutions.

    Personalized recommendations play an important role in improving users’ experience and retaining them. Swamy will walk through some of the techniques incorporated in RECKON and an end-end building of this product on Databricks, along with the demo.

    Learn more


    Tools for Assisted Spark Version Migrations, From 2.1 to 3.2+
    Holden Karau, Netflix

    This talk will look at the current state of tools to automate library and language upgrades in Python and Scala and apply them to upgrading to the new version of Apache Spark. After doing a very informal survey, it seems that many users are stuck on no longer supported versions of Spark, so this talk will expand on the first attempt at automating upgrades (2.4 -> 3.0) to explore the problem all the way back to 2.1.

    Learn more


    Real-Time Cost Reduction Monitoring and Alerting
    Ofer Ohana, Huuuge Games | David Sellam, Huuuge Games

    Huuuge Games is building a state-of-the-art data and AI platform that serves as a unified data hub for all company needs and for all data and AI business insights.

    They built a real-time cost monitoring infrastructure to closely monitor in real-time the cost boundaries for various dimensions, such as the technical area of the data system, specific engineering team, individual, process and more. The cost monitoring infrastructure is supported by intuitive tools for the definition of cost monitoring criteria and for the definition of real-time alerts.

    In this lecture, Ofer and David will present several use cases for which their cost monitoring infrastructure enables them to detect problematic code, architecture and individual use of their infrastructure. Furthermore, they will demonstrate, thanks to this infrastructure, how they’ve been able to save money, facilitate the use of the Databricks platform, increase user satisfaction, and have comprehensive visibility of the data ecosystem.

    Learn more


    Check out the full list of Communications, Media & Entertainment talks at Summit.

    Demos on Popular Data + AI Use Cases for Media & Entertainment

    Real-Time Bidding Stadium Analytics Mitigating Toxicity Multi-Touch Attribution

    Sign-up for the Communications, Media & Entertainment Experience at Summit!

    --

    Try Databricks for free. Get started today.

    The post Guide to Media & Entertainment Sessions at Data + AI Summit 2022 appeared first on Databricks.

    Databricks on Google Cloud Security Best Practices

    $
    0
    0

    The lakehouse paradigm enables organizations to store all of their data in one location for analytics, data science, machine learning (ML), and business intelligence (BI). Bringing all of the data together into a single location increases productivity, breaks down barriers to collaboration, and accelerates innovation.

    As organizations prepare to deploy a data lakehouse, they often have questions about how to implement their policy-governed security and controls to ensure proper access and auditability. Some of the most common questions include:

    • Can I bring my own VPC (network) for Databricks on Google Cloud? (e.g., Shared VPC)
    • How can I make sure requests to Databricks ( Webapp or the APIs) originate from within an approved network (e.g., users need to be on a corporate VPN while accessing a Databricks workspace)?
    • How can Databricks compute instances have only private IP’s?
    • Is it possible to audit Databricks related events (e.g., who did what and when)?
    • How do I prevent data exfiltration?
    • How do I manage Databricks Personal Access Tokens?

    In this article, we’ll address these questions and walk through cloud security features and capabilities that enterprise data teams can utilize to bake their Databricks environment as per their governance policy.

    Databricks on Google Cloud

    Databricks on Google Cloud is a jointly developed service that allows you to store all your data on a simple, open lakehouse platform that combines the best of data warehouses and data lakes to unify all your analytics and AI workloads. It is hosted on the Google Cloud Platform (GCP), running on Google Kubernetes Engine (GKE) and providing built-in integration with Google Cloud Identity, Google Cloud Storage, BigQuery, and other Google Cloud technologies. The platform enables true collaboration between different data personas in any enterprise, including Data Engineers, Data Scientists, Data Analysts and SecOps / Cloud Engineering.

    Built upon the foundations of Delta Lake, MLflow, Koalas, Databricks SQL and Apache Spark™, Databricks on Google Cloud is a GCP Marketplace offering that provides one-click setup, native integrations with other Google cloud services, an interactive workspace, and enterprise-grade security controls and identity and access management (IAM) to power Data and AI use cases for small to large global customers. Databricks on Google Cloud leverages Kubernetes features like namespaces to isolate clusters within the same GKE cluster.

    Bring your own network

    How can you set up the Databricks Lakehouse Platform in your own enterprise-managed virtual network, in order to do necessary customizations as required by your network security team? Enterprise customers should begin using customer-managed virtual private cloud (VPC) capabilities for their deployments on the GCP environment. Customer-managed VPCs enable you to comply with a number of internal and external security policies and frameworks, while providing a Platform-as-a-Service approach to data and AI to combine the ease of use of a managed platform with secure-by-default deployment. Below is a diagram to illustrate the difference between Databricks-managed and customer-managed VPCs:

    Differences between Databricks-managed and customer-managed VPCs

    Enable secure cluster connectivity

    Deploy your Databricks workspace in subnets without any inbound access to your network. Clusters will utilize a secure connectivity mechanism to communicate with the Databricks cloud infrastructure, without requiring public IP addresses for the nodes. Secure cluster connectivity is enabled by default at Databricks workspace creation on Google Cloud.

    Secure cluster connectivity is enabled by default at Databricks workspace creation on Google Cloud.

    Control which networks are allowed to access a workspace

    Configure allow-lists and block-lists to control the networks that are allowed to access your Databricks workspace.

    With Databricks on GCP, you can configure allow-lists and block-lists to control the networks that are allowed to access your Databricks workspace.

    Trust but verify with Databricks

    Get visibility into relevant platform activity in terms of who’s doing what and when, by configuring Databricks audit logs and other related Google Cloud Audit Logs.

    Securely accessing Google Cloud Data sources from Databricks

    Understand the different ways of connecting Databricks clusters in your private virtual network to your Google Cloud Data Sources in a cloud-native secure manner. Customers can choose from Private Google Access, VPC Service Controls or Private Service Connect features to read/write to data sources like BQ, Cloud SQL, GCS.

    Data exfiltration protection with Databricks

    Learn how to utilize cloud-native security constructs like VPC Service Controls to create a battle-tested secure architecture for your Databricks environment, that helps you prevent Data Exfiltration. Most relevant for organizations working with personally identifiable information (PII), protected health information (PHI) and other types of sensitive data.

    Token management for Personal Access Tokens

    For use cases that require the Databricks Personal Access Tokens (PAT), we recommend to allow only the required users to be able to configure those tokens. If you cannot use AAD tokens for your jobs workloads, we recommend creating PAT tokens for service principals rather than individual users.

    Token management with Databricks on GCP.

    What’s next?

    The lakehouse architecture enables customers to take an integrated and consistent approach to data governance and access, giving organizations the ability to rapidly scale from a single use case to operationalizing a data and AI platform across many distributed data teams.

    Bookmark this page, as we’ll keep it updated with the new security-related capabilities & controls. If you want to try out the mentioned features, get started by creating a Databricks workspace in your own managed VPC.

    --

    Try Databricks for free. Get started today.

    The post Databricks on Google Cloud Security Best Practices appeared first on Databricks.

    Viewing all 1874 articles
    Browse latest View live