Quantcast
Channel: Databricks
Viewing all 1874 articles
Browse latest View live

Delta Live Tables Announces New Capabilities and Performance Optimizations

$
0
0

Since the availability of Delta Live Tables (DLT) on all clouds in April (announcement), we’ve introduced new features to make development easier, enhanced automated infrastructure management, announced a new optimization layer called Project Enzyme to speed up ETL processing, and enabled several enterprise capabilities and UX improvements.

DLT enables analysts and data engineers to quickly create production-ready streaming or batch ETL pipelines in SQL and Python. DLT simplifies ETL development by allowing you to define your data processing pipeline declaratively. DLT comprehends your pipeline’s dependencies and automates nearly all operational complexities.

Delta Live Tables has grown to power production ETL use cases at leading companies all over the world since its inception. DLT is used by over 1,000 companies ranging from startups to enterprises, including ADP, Shell, H&R Block, Jumbo, Bread Finance, and JLL.

With DLT, engineers can concentrate on delivering data rather than operating and maintaining pipelines and take advantage of key features. We have enabled several enterprise capabilities and UX improvements, including support for Change Data Capture (CDC) to efficiently and easily capture continually arriving data, and launched a preview of Enhanced Auto Scaling that provides superior performance for streaming workloads. Let’s look at the improvements in detail:

Make development easier

We have extended our UI to make it easier to manage the end-to-end lifecycle of ETL.

UX improvements. We have extended our UI to make managing DLT pipelines easier, view errors, and provide access to team members with rich pipeline ACLs. We have also added an observability UI to see data quality metrics in a single view, and made it easier to schedule pipelines directly from the UI. Learn more.

Schedule Pipeline button. DLT lets you run ETL pipelines continuously or in triggered mode. Continuous pipelines process new data as it arrives, and are useful in scenarios where data latency is critical. However, many customers choose to run DLT pipelines in triggered mode to control pipeline execution and costs more closely. To make it easy to trigger DLT pipelines on a recurring schedule with Databricks Jobs, we have added a ‘Schedule’ button in the DLT UI to enable users to set up a recurring schedule with only a few clicks without leaving the DLT UI. You can also see a history of runs and quickly navigate to your Job detail to configure email notifications. Learn more.

Change Data Capture (CDC). With DLT, data engineers can easily implement CDC with a new declarative APPLY CHANGES INTO API, in either SQL or Python. This new capability lets ETL pipelines easily detect source data changes and apply them to data sets throughout the lakehouse. DLT processes data changes into the Delta Lake incrementally, flagging records to insert, update, or delete when handling CDC events. Learn more.

CDC Slowly Changing Dimensions—Type 2. When dealing with changing data (CDC), you often need to update records to keep track of the most recent data. SCD Type 2 is a way to apply updates to a target so that the original data is preserved. For example, if a user entity in the database moves to a different address, we can store all previous addresses for that user. DLT supports SCD type 2 for organizations that require maintaining an audit trail of changes. SCD2 retains a full history of values. When the value of an attribute changes, the current record is closed, a new record is created with the changed data values, and this new record becomes the current record. Learn more.

Automated Infrastructure Management

Enhanced Autoscaling (preview). Sizing clusters manually for optimal performance given changing, unpredictable data volumes–as with streaming workloads– can be challenging and lead to overprovisioning. Current cluster autoscaling is unaware of streaming SLOs, and may not scale up quickly even if the processing is falling behind the data arrival rate, or it may not scale down when a load is low. DLT employs an enhanced auto-scaling algorithm purpose-built for streaming. DLTs Enhanced Autoscaling optimizes cluster utilization while ensuring that overall end-to-end latency is minimized. It does this by detecting fluctuations of streaming workloads, including data waiting to be ingested, and provisioning the right amount of resources needed (up to a user-specified limit). In addition, Enhanced Autoscaling will gracefully shut down clusters whenever utilization is low while guaranteeing the evacuation of all tasks to avoid impacting the pipeline. As a result, workloads using Enhanced Autoscaling save on costs because fewer infrastructure resources are used. Learn More.

Automated Upgrade & Release Channels. Delta Live Tables (DLT) clusters use a DLT runtime based on Databricks runtime (DBR). Databricks automatically upgrades the DLT runtime about every 1-2 months. DLT will automatically upgrade the DLT runtime without requiring end-user intervention and monitor pipeline health after the upgrade. If DLT detects that the DLT Pipeline cannot start due to a DLT runtime upgrade, we will revert the pipeline to the previous known-good version. You can get early warnings about breaking changes to init scripts or other DBR behavior by leveraging DLT channels to test the preview version of the DLT runtime and be notified automatically if there is a regression. Databricks recommends using the CURRENT channel for production workloads. Learn more.

Announcing Enzyme, a new optimization layer designed specifically to speed up the process of doing ETL

Transforming data to prepare it for downstream analysis is a prerequisite for most other workloads on the Databricks platform. While SQL and DataFrames make it relatively easy for users to express their transformations, the input data constantly changes. This requires recomputation of the tables produced by ETL. Recomputing the results from scratch is simple, but often cost-prohibitive at the scale many of our customers operate.

We are pleased to announce that we are developing project Enzyme, a new optimization layer for ETL. Enzyme efficiently keeps up-to-date a materialization of the results of a given query stored in a Delta table. It uses a cost model to choose between various techniques, including techniques used in traditional materialized views, delta-to-delta streaming, and manual ETL patterns commonly used by our customers.

Table: Enzyme performance vs. manual incrementalization

Table: Enzyme performance vs. manual incrementalization

Get started with Delta Live Tables on the Lakehouse

Watch the demo below to discover the ease of use of DLT for data engineers and analysts alike:

If you are a Databricks customer, simply follow the guide to get started. Read the release notes to learn more about what’s included in this GA release. If you are not an existing Databricks customer, sign up for a free trial, and you can view our detailed DLT Pricing here.

Join the conversation in the Databricks Community where data-obsessed peers are chatting about Data + AI Summit 2022 announcements and updates. Learn. Network. Celebrate.

--

Try Databricks for free. Get started today.

The post Delta Live Tables Announces New Capabilities and Performance Optimizations appeared first on Databricks.


Introducing MLflow Pipelines with MLflow 2.0

$
0
0

Since we launched MLflow in 2018, MLflow has become the most popular MLOps framework, with over 11M monthly downloads! Today, teams of all sizes use MLflow to track, package, and deploy models. However, as demand for ML applications grows, teams need to develop and deploy models at scale. We are excited to announce that MLflow 2.0 is coming soon and will include MLflow Pipelines, making it simple for teams to automate and scale their ML development by building production-grade ML pipelines.

Challenges with operationalizing ML

When deploying models, you need to do much more than just training them. You need to ingest and validate data, run and track experiment trials, and package, validate and deploy models. You also need to test models on live production data and monitor deployed models. Finally, you need to manage and update your models in production when new data comes in or conditions change.

You might get away with a manual process when managing a single model. But, when managing multiple models in production or even supporting a single model that needs to be frequently updated, you need to codify the process and deploy the workflow into production. That means you need to create a workflow that 1) includes all the ML processes listed above and 2) meets the requirements common to all production code, such as modularity, scalability, and testability. With all this work required to transition from exploration to production, teams are finding it hard to reliably and quickly implement ML systems in production.

MLflow Pipelines

MLflow Pipelines provides a standardized framework for creating production-grade ML pipelines that combine modular ML code with software engineering best practices to make model deployment fast and scalable. With MLflow Pipelines, you can bootstrap ML projects, perform rapid iteration with ease and deploy pipelines into production while following DevOps best practices.

MLflow Pipelines introduces the following core components in MLflow:

  • Pipeline: Each pipeline consists of steps and a blueprint for how those steps are connected to perform end-to-end machine learning operations, such as training a model or applying batch inference. A pipeline breaks down the complex MLOps process into multiple steps that each team can work on independently.
  • Steps: Steps are manageable components that perform a single task, such as data ingestion or feature transformation. These tasks are often performed at different cadences during model development. Steps are connected through a well-defined interface to create a pipeline and can be reused across multiple pipelines. Steps can be customized through YAML configuration or through Python code.
  • Pipeline templates: Pipeline templates provide an opinionated approach to solve distinct ML problems or operations, such as regression, classification, or batch inference. Each template includes a pre-defined pipeline with standard steps. MLflow provides built-in templates for common ML problems, and teams can create new pipeline templates to fit custom needs.

You can use the above pipeline components to codify your MLOps process, automate it and share it within your organization. By standardizing your MLOps process, you accelerate model deployment and scale ML to more use cases.
Automating and Scaling MLOps with MLflow Pipelines
MLflow Pipeline enables Data Scientists to quickly and collaboratively create production-grade ML pipelines that can be deployed locally or in the cloud

Automating and Scaling MLOps with MLflow Pipelines

Standardize and accelerate the path to production ML

MLflow Pipelines enable the Data Science team to create production-grade ML code that is deployable with little or no refactoring. It brings software engineering principles of modularity, testability, reproducibility, and code-config separation to machine learning while keeping the code accessible to the Data Science team. Pipelines also guarantee reproducibility across environments, producing consistent results on your laptop, Databricks, or other cloud environments. Importantly, the uniform project structure, modular code and standardized interfaces enable the Production team to easily integrate enterprise mechanisms for code deployments with the ML workflow. This enables organizations to empower Data Science teams to deploy ML pipelines following enterprise practices for production code deployment.

Focus on machine learning, skip the boilerplate code

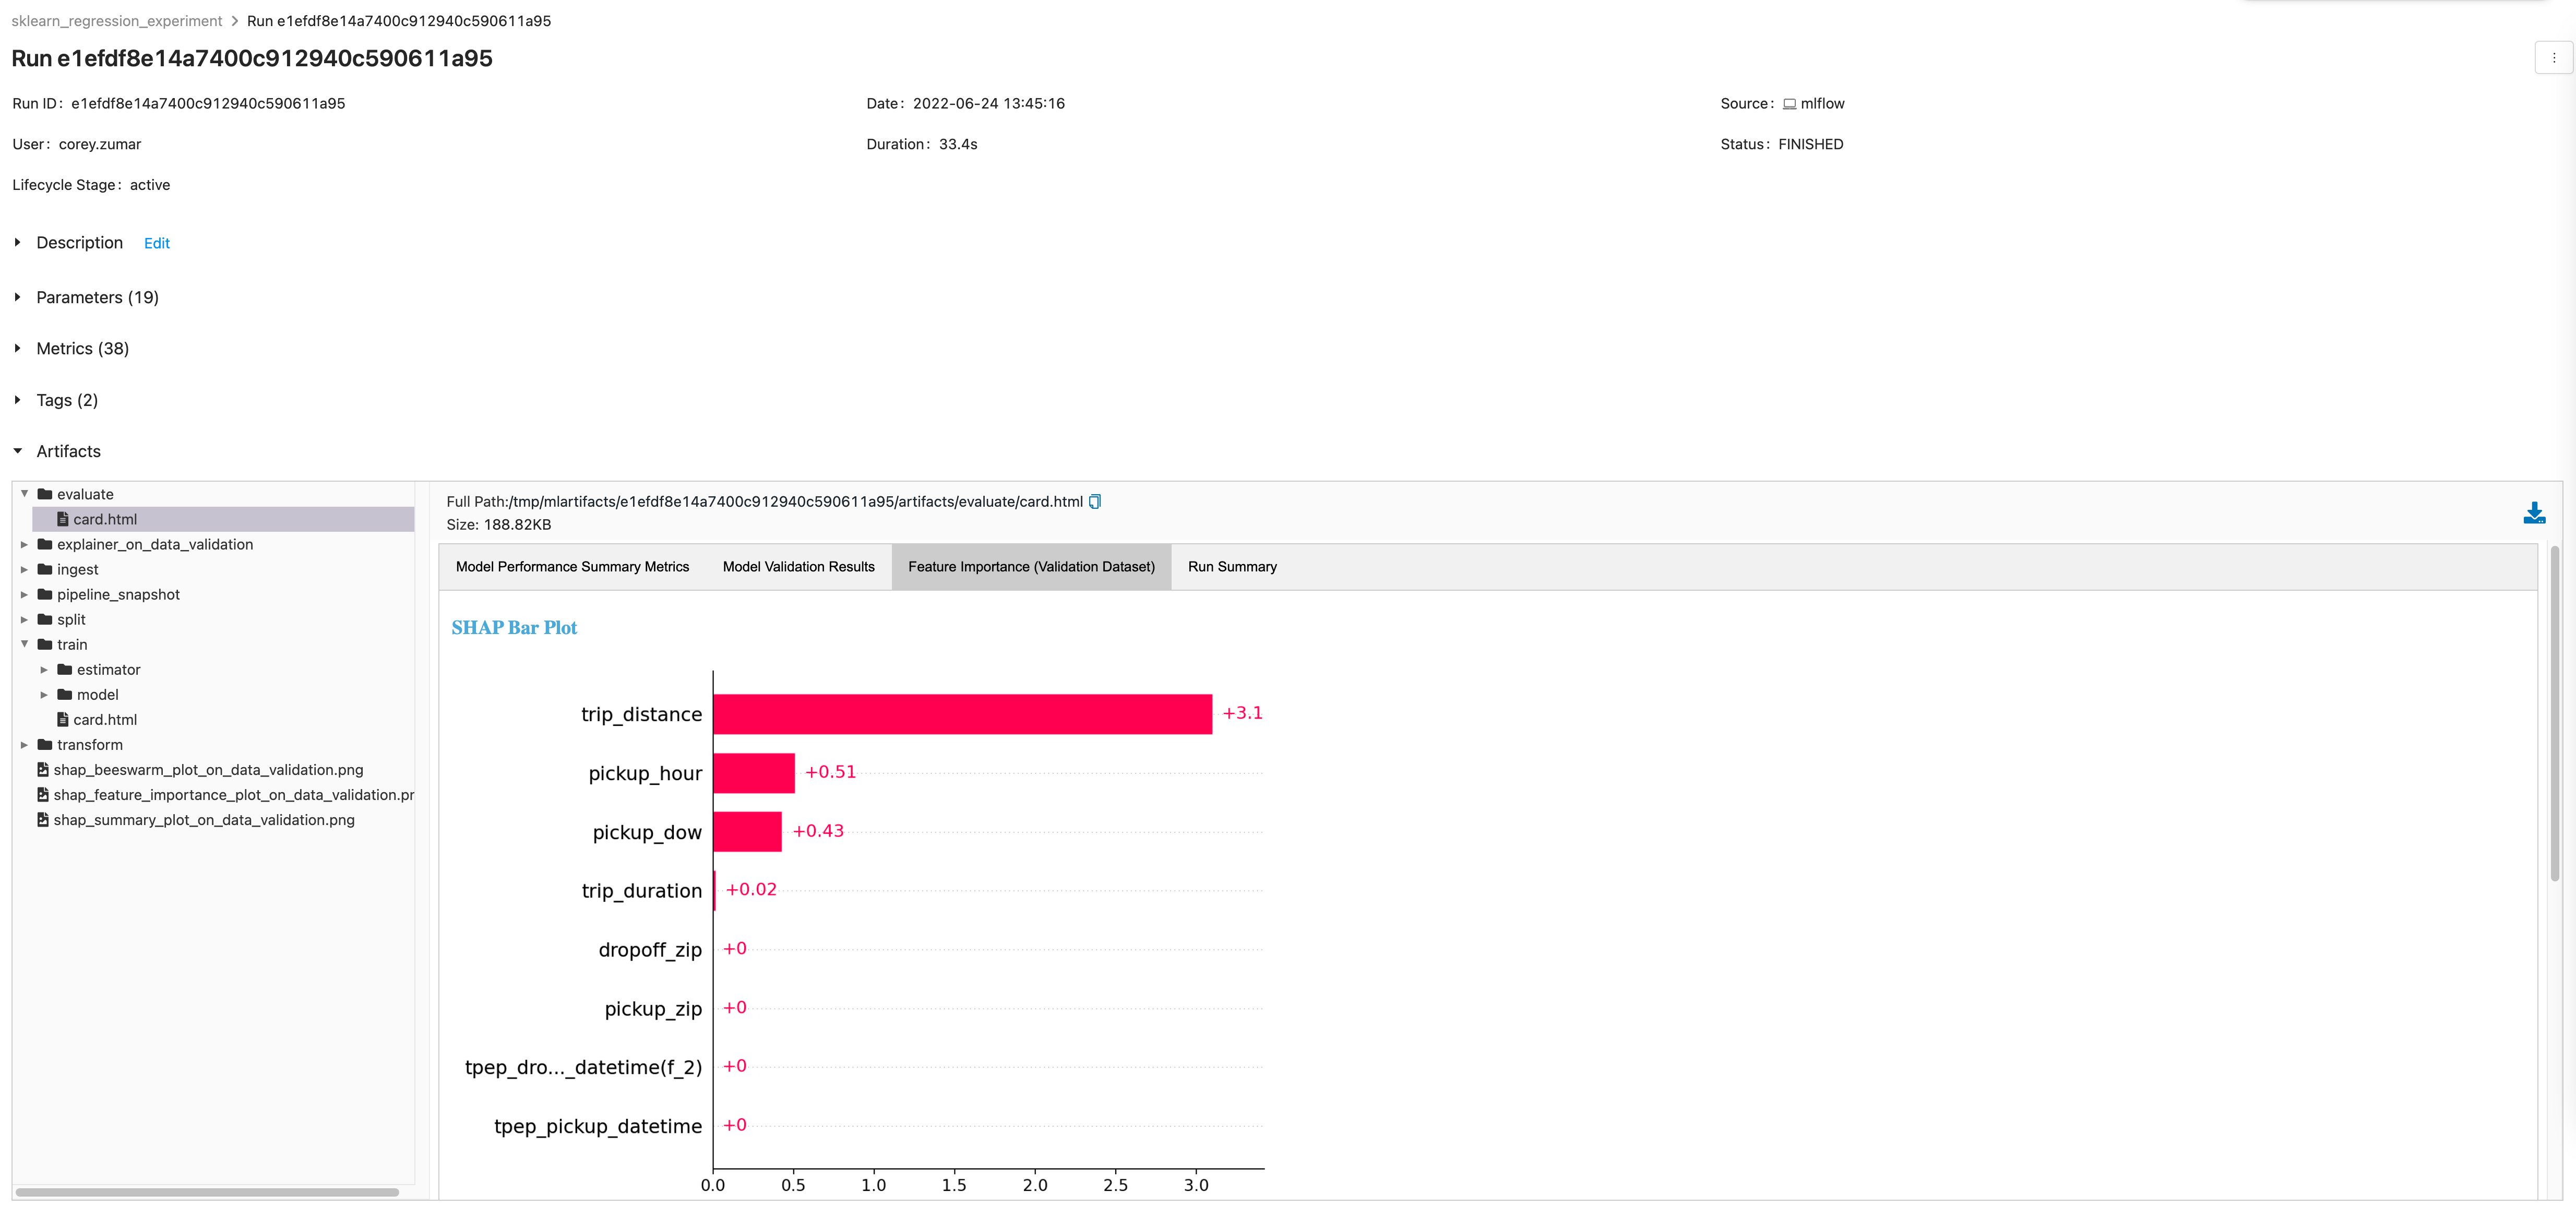
MLflow Pipelines provides templates that make it easy to bootstrap and build ML pipelines for common ML problems. The templates scaffold a pipeline with a predefined graph and a boilerplate code. You can then customize the individual steps using YAML configuration or by providing Python code. Each step also comes with an auto-generated step card that provides out-of-the-box visualizations that can help with debugging and troubleshooting, such as feature importance plots and highlighting observations that have large prediction errors. You can also create custom templates and share them within your enterprise.

Step cards provides out-of-box visualization for debugging and troubleshooting

Fast and efficient iterative development

MLflow Pipelines accelerates model development by memorizing steps and only rerunning parts of the pipeline that are really needed. When training models, you have to run multiple experiments to test different model types or hyperparameters, with each experiment often only slightly different from another one. Running the full training pipeline every time for each experiment wastes time and compute resources. MLflow Pipelines automatically detects unchanged steps and reuses their outputs from the previous run, making experimentation faster and more efficient.

Same great MLflow tracking, now at the workflow level

MLflow automatically tracks the metadata of each pipeline execution, including MLflow run, models, step outputs, code and config snapshot. MLflow also tracks the git commit of the template repo when a pipeline is executed. You can quickly see previous runs, compare results and reproduce a past result as needed.
MLflow automatically tracks the metadata of each pipeline execution, including MLflow run,  models, step outputs, code and config snapshot.

Announcing the first release of MLflow Pipelines

Today we are excited to announce the first iteration of MLflow Pipelines that offers a production-grade template for developing high-quality regression models. With the template, you get a scaffolded regression pipeline with pre-defined steps and boilerplate code. You can then customize individual steps–like data transforms or model training –and rapidly execute the pipeline locally or in the cloud.

Getting started with MLflow Pipelines

Ready to get started or try it out for yourself? You can read more about MLflow Pipelines and how to use them in the MLflow repo or listen to the Data+AI Summit 2022 talks on MLflow Pipelines. We are developing MLflow Pipelines as a core component of the open-source MLflow project and will encourage you to provide feedback to help us make it better.

Join the conversation in the Databricks Community where data-obsessed peers are chatting about Data + AI Summit 2022 announcements and updates. Learn. Network. Celebrate.

--

Try Databricks for free. Get started today.

The post Introducing MLflow Pipelines with MLflow 2.0 appeared first on Databricks.

Designing a Java Connector for Delta Sharing Recipient

$
0
0

Making an open data marketplace

Stepping into this brave new digital world we are certain that data will be a central product for many organizations. The way to convey their knowledge and their assets will be through data and analytics. During the Data + AI Summit 2021, Databricks announced Delta Sharing, the world’s first open protocol for secure and scalable real-time data sharing. This simple REST protocol can become a differentiating factor for your data consumers and the ecosystem you are building around your data products.

Delta Sharing, the world’s first open protocol for secure and scalable real-time data sharing.

While this protocol assumes that the data provider resides on the cloud, data recipients don’t need to be on the same cloud storage platform as the provider, or even in the cloud at all — sharing works across clouds and even from cloud to on-premise users. There are open-source connectors using Python native libraries like pandas and frameworks like Apache Spark™, and a wide array of partners that have built-in integration with Delta Sharing.

Open-source connectors and a wide array of partners have built-in integration with Delta Sharing.

In this blog we want to clear the pathway for other clients to implement their own data consumers. How can we consume data supplied by Delta Sharing when there is no Apache Spark or Python? The answer is — Java Connector for Delta Sharing!

A mesh beyond one cloud

Why do we believe this connector is an important tool? For 3 main reasons:

  • Firstly, it expands the ecosystem allowing Java and Scala-based solutions to integrate seamlessly with Delta Sharing protocol.
  • Secondly, it is platform-agnostic, and works both on cloud and on-prem. The connector only requires the existence of the JVM and a local file system. That in effect means we can abstract ourselves from where our Java applications will be hosted. This greatly expands the reach of Delta Sharing protocol beyond Apache Spark and Python.
  • Lastly, it introduces ideas and concepts on how connectors for other programming languages can be similarly developed. For example, an R native connector that would allow RStudio users to read data from Delta Sharing directly into their environment, or perhaps a low-level C++ Delta Sharing connector.

With the ever expanding ecosystem of digital applications and newly emerging programming languages these concepts are becoming increasingly important.

Delta Sharing protocol with its multiple connectors then has the potential to unlock the data mesh architecture in its truest form. A data mesh that spans across both clouds & on-prem, with mesh nodes being served where best fits the skill set of the user base and whose services best match the workloads’ demands, compliance and security constraints

With Delta Sharing for the first time ever we have a data sharing protocol that is truly open, not only open sourced, but also open to any hosting platform and programming language.

Paving the way to Supply chain 4.0

Data exchange is a pervasive topic – it is weaved into the fabrics of basically every industry vertical out there. One example particularly comes to mind — that of supply chain – the data is the new “precious metal” that needs transportation and invites derivation. Through data exchange and combination we can elevate each and every industry that operates both in physical and

McKinsey defines Industry 4.0 as digitization of the manufacturing sector, with embedded sensors in virtually all product components and manufacturing equipment, ubiquitous cyberphysical systems, and analysis of all relevant data. (see more) Reflecting on the aforementioned quote opens up a broad spectrum of topics. These topics are pertinent to the world that is transitioning from physical to digital problems. In this context data is the new gold, the data contains the knowledge of the past and the data holds the keys to the future, the data captures the patterns of the end users, the data captures the way your machinery and your workforce operate on a daily basis. In short – the data is critical and allencopasing.

A separate article by McKinsey defines supply chain 4.0 as: “Supply Chain 4.0 – the application of the Internet of Things, the use of advanced robotics, and the application of advanced analytics of big data in supply chain management: place sensors in everything, create networks everywhere, automate anything, and analyze everything to significantly improve performance and customer satisfaction.” (see more) While McKinsey is approaching the topic from a very manufacturing cetric angle, we want to elevate the discussion – we argue that digitalization is a pervasive concept, it is a motion that all industry verticals are undergoing at the moment.

With the rise of digitalisation the data becomes an integral product in your supply chain — it transcends your physical supply chain to a data supply chain. Data sharing is an essential component to drive business value as companies of all sizes look to securely exchange data with their customers, suppliers and partners (see more). We propose a new Delta Sharing Java connector that expands the ecosystem of data providers and data recipients, bringing together an ever expanding set of Java based systems.

A ubiquitous technology

Why did we choose Java for this connector implementation? Java is ubiquitous, it is present both on and off the cloud. Java has become so pervasive that in 2017 there were more that 38 billion active Java Virtual Machines (JVM) and more than 21 billion cloud-connected JVMs (source). Berkeley Extension includes Java in their “Most in demand programming languages of 2022 “. Java is without a question one of the most important programming languages.

Another very important consideration is that Java is a foundation for Scala — yet another very widely used programming language that brings the power of functional programming into the Java ecosystem. Building a connector in Java addresses two key user groups — the Java programmers and the Scala programmers.

Lastly, Java is simple to set up and can run on practically any system: Linux, Windows, MacOS and even Solaris (source). This means that we can abstract from the underlying compute, and focus on bringing the data to evermore data consumers. Whether we have an application server that needs to ingest remote data, or we have a BI platform that combines the data from several nodes in our Data Mesh it shouldn’t matter. This is where our Java connector sits, bridging the ingestion between a whole range of destination solutions and a unified data sharing protocol.

Bring the data when your consumers are

Java connector for Delta Sharing brings the data to your consumers both on and off the cloud. Given the pervasive nature of Java and the fact it can be easily installed on practically any computing platform, we can blur the edges of the cloud. We have designed our connector with these principles in mind.

High Level Java Connector Protocol

The Java connector follows the Delta Sharing protocol to read shared tables from a Delta Sharing Server. To further reduce and limit egress costs on the Data Provider side, we implemented a persistent cache to reduce and limit the egress costs on the Data Provider side by removing any unnecessary reads.

  1. The data is served to the connector via persisted cache to limit the egress costs whenever possible.
    1. Instead of keeping all table data in memory, we will use file stream readers to serve larger datasets even when there isn’t enough memory available.
    2. Each table will have a dedicated file stream reader per part file that is held in the persistent cache. File stream readers allow us to read the data in blocks of records and we can process data with more flexibility.
    3. Data records are provided as a set of Avro GenericRecords that provide a good balance between the flexibility of representation and integrational capabilities. GenericRecords can easily be exported to JSON and/or other formats using EncoderFactory in Avro.
  2. Every time the data access is requested the connector will check for the metadata updates and refresh the table data in case of any metadata changes.
    1. The connector requests the metadata for the table based on its coordinate from the provider. The table coordinate is the profile file path following with `#` and the fully qualified name of a table (<share-name>.<schema-name>.<table-name>).
    2. A lookup of table to metadata is maintained inside the JVM. The connector then compares the received metadata with the last metadata snapshot. If there is no change, then the existing table data is served from cache. Otherwise, the connector will refresh the table data in the cache.
  3. When the metadata changes are detected both the data and the metadata will be updated.
  4. The connector will request the pre-signed urls for the table defined by the fully qualified table name. The connector will only download the file whose metadata has changed and will store these files into the persisted cache location.

In the current implementation, the persistent cache is located in dedicated temporary locations that are destroyed when the JVM is shutdown. This is an important consideration since it avoids persisting orphaned data locally.

The connector expects the profile files to be provided as a JSON payload, which contains a user’s credentials to access a Delta Sharing Server.

val providerJSON = """{
    "shareCredentialsVersion": 1,
    "endpoint": "https://sharing.endpoint/",
    "bearerToken": "faaieXXXXXXX…XXXXXXXX233"
}"""

ALT TEXT = Scala ProviderJSON definition

String providerJSON = """{
    "shareCredentialsVersion": 1,
    "endpoint": "https://sharing.endpoint/",
    "bearerToken": "faaieXXXXXXX…XXXXXXXX233"
}""";

ALT TEXT = Java ProviderJSON definition

We advise that you store and retrieve this from a secure location, such as a key vault.

Once we have the provider JSON we can easily instantiate our Java Connector using the DeltaSharingFactory instance.

import com.databricks.labs.delta.sharing.java.DeltaSharingFactory

val sharing = new DeltaSharing(
    providerJSON,
    "/dedicated/persisted/cache/location/"
)

ALT TEXT = Scala Sharing Client definition

import com.databricks.labs.delta.sharing.java.DeltaSharingFactory;
import com.databricks.labs.delta.sharing.java.DeltaSharing;

DeltaSharing sharing = new DeltaSharing(
    providerJSON,
    "/dedicated/persisted/cache/location/"
);

ALT TEXT = Java Sharing Client definition

Finally, we can initialize a TableReader instance that will allow us to consume the data.

val tableReader = sharing
.getTableReader(“table.coordinates”)

tableReader.read() //returns 1 row
tableReader.readN(20) //returns next 20 rows

ALT TEXT = Scala Table Reader definition


import com.databricks.labs.delta.sharing.java.format.parquet.TableReader;
import org.apache.avro.generic.GenericRecord;

TableReader tableReader = sharing.getTableReader(“table.coordinates”);

tableReader.read(); //returns 1 row
tableReader.readN(20); //returns next 20 rows


ALT TEXT = Java Table Reader definition

res4: org.apache.avro.generic.GenericRecord = {"Year": 2008, "Month": 2, "DayofMonth": 1,
"DayOfWeek": 5, "DepTime": "1519", "CRSDepTime": 1500, "ArrTime": "2221", "CRSArrTime": 2225,
"UniqueCarrier": "WN", "FlightNum": 1541, "TailNum": "N283WN", "ActualElapsedTime": "242",
"CRSElapsedTime": "265", "AirTime": "224", "ArrDelay": "-4", "DepDelay": "19", "Origin": "LAS",
"Dest": "MCO", "Distance": 2039, "TaxiIn": "5", "TaxiOut": "13", "Cancelled": 0, "CancellationCode": null, "Diverted": 0,
"CarrierDelay": "NA", "WeatherDelay": "NA", "NASDelay": "NA", "SecurityDelay": "NA", "LateAircraftDelay": "NA"}

ALT TEXT = Output example of tableReader.read()

In three easy steps we were able to request the data that was shared with us and consume it into our Java/Scala application. TableReader instance manages a collection of file stream readers and can be easily extended to integrate with a multithreading execution context to leverage parallelism.

“Sharing is a wonderful thing, Especially to those you’ve shared with.” – Julie Hebert, When We Share

Try out the Java connector for Delta Sharing to accelerate your data sharing applications and contact us to learn more about how we assist customers with similar use cases.

  • Delta Sharing Java Connector is available as a Databricks Labs repository here.
  • Detailed documentation is available here.
  • You can access the latest artifacts and binaries following the instructions provided here.

--

Try Databricks for free. Get started today.

The post Designing a Java Connector for Delta Sharing Recipient appeared first on Databricks.

Recap of Databricks Machine Learning announcements from Data & AI Summit

$
0
0

Databricks Machine Learning on the lakehouse provides end-to-end machine learning capabilities from data ingestion and training to deployment and monitoring, all in one unified experience, creating a consistent view across the ML lifecycle and enabling stronger team collaboration. At the Data and AI Summit this week, we announced capabilities that further accelerate ML lifecycle and production ML with Databricks. Here’s a quick recap of the major announcements.

MLflow 2.0 Including MLflow Pipelines
MLflow 2.0 is coming soon and will include a new component, Pipelines. MLflow Pipelines provides a structured framework that enables teams to automate the handoff from exploration to production so that ML engineers no longer have to juggle manual code rewrites and refactoring. MLflow Pipeline templates scaffold pre-defined graphs with user-customizable steps and natively integrate with the rest of MLflow’s model lifecycle management tools. Pipelines also provide helper functions, or “step cards”, to standardize model evaluation and data profiling across projects. You can try out a Beta version of MLflow Pipelines today with MLflow 1.27.0.

MLflow 2.0 introduces MLflow Pipelines - pre-defined, production ready templates to accelerate ML
MLflow 2.0 introduces MLflow Pipelines – pre-defined, production-ready templates to accelerate ML

Serverless Model Endpoints
Deploy your models on Serverless Model Endpoints for real-time inference for your production applications. Serverless Model Endpoints provide highly available, low latency REST endpoints that can be set up and configured via UI or API. Users can customize autoscaling to handle their model’s throughput and for predictable traffic use cases, and teams can save costs by autoscaling all the way down to 0. Serverless Model Endpoints also have built-in observability so you can stay on top of your model serving. Now your data science teams don’t have to build and maintain their own kubernetes infrastructure to serve ML models. Sign up now to get notified for the Gated Public Preview.

Serverless Model Endpoints provide production-grade model serving hosted by Databricks

Model Monitoring
Track the performance of your production models with Model Monitoring. Our model monitoring solution auto-generates dashboards to help teams view and analyze data and model quality drift. We also provide the underlying analysis and drift tables as Delta tables so teams can join performance metrics with business value metrics to calculate business impact as well as create alerts when metrics have fallen below specified thresholds. While Model Monitoring automatically calculates drift and quality metrics, it also provides an easy mechanism for users to incorporate additional custom metrics. Stay tuned for the Public Preview launch…

Monitor your deployed models and the related data that feeds them all in a centralized location with auto-generated dashboards and alerting.

Learn more:

--

Try Databricks for free. Get started today.

The post Recap of Databricks Machine Learning announcements from Data & AI Summit appeared first on Databricks.

Open Sourcing All of Delta Lake

$
0
0

The theme of this year’s Data + AI Summit is that we are building the modern data stack with the lakehouse. A fundamental requirement of your data lakehouse is the need to bring reliability to your data – one that is open, simple, production-ready, and platform agnostic, like Delta Lake. And with this, we are excited about the announcement that with Delta Lake 2.0, we are open-sourcing all of Delta Lake!

What makes Delta Lake special

Delta Lake enables organizations to build Data Lakehouses, which enable data warehousing and machine learning directly on the data lake. But Delta Lake does not stop there. Today, it is the most comprehensive Lakehouse format used by over 7,000 organizations, processing exabytes of data per day. Beyond core functionality that enables seamlessly ingesting and consuming streaming and batch data in a reliable and performant manner, one of the most important capabilities of Delta Lake is Delta Sharing, which enables different companies to share data sets in a secure way. Delta Lake also comes with standalone readers/writers that lets any Python, Ruby, or Rust client write data directly to Delta Lake without requiring any big data engine such as Apache Spark™. Finally, Delta Lake has been optimized over time and significantly outperforms all other Lakehouse formats. Delta Lake comes with a rich set of open-source connectors, including Apache Flink, Presto, and Trino. Today, we are excited to announce our commitment to open source Delta Lake by open-sourcing all of Delta Lake, including capabilities that were hitherto only available in Databricks. We hope that this democratizes the use and adoption of data lakehouses. But before we cover that, we’d like to tell you about the history of Delta.

The Genesis of Delta Lake

The genesis of this project began from a casual conversation at Spark Summit 2018 between Dominique Brezinski, distinguished engineer at Apple, and our very own Michael Armbrust (who originally created Delta Lake, Spark SQL, and Structured Streaming). Dominique, who heads up efforts around intrusion monitoring and threat response, was picking Michael’s brain on how to address the processing demands created by their massive volumes of concurrent batch and streaming workloads (petabytes of log and telemetry data per day). They could not use data warehouses for this use case because (i) they were cost-prohibitive for the massive event data that they had, (ii) they did not support real-time streaming use cases which were essential for intrusion detection, and (iii) there was a lack of support for advanced machine learning, which is needed to detect zero-day attacks and other suspicious patterns. So building it on a data lake was the only feasible option at the time, but they were struggling with pipelines failing due to a large number of concurrent streaming and batch jobs and weren’t able to ensure transactional consistency and data accessibility for all of their data.

So, the two of them came together to discuss the need for the unification of data warehousing and AI, planting the seed that bloomed into Delta Lake as we now know it. Over the coming months, Michael and his team worked closely with Dominique’s team to build this ingestion architecture designed to solve this large-scale data problem — allowing their team to easily and reliably handle low-latency stream processing and interactive queries without job failures or reliability issues with the underlying cloud object storage systems while enabling Apple’s data scientists to process vast amounts of data to detect unusual patterns. We quickly realized that this problem was not unique to Apple, as many of our customers were experiencing the same issue. Fast forward and we began to quickly see Databricks customers build reliable data lakes effortlessly at scale using Delta Lake. We started to call this approach of building reliable data lakes the data lakehouse pattern, as it provided the reliability and performance of data warehouses together with the openness, data science, and real-time capabilities of massive data lakes.

Delta Lake becomes a Linux Foundation Project

As more organizations started building lakehouses with Delta Lake, we heard that they wanted the format of the data on the data lake to be open source, thereby completely avoiding vendor lock-in. As a result, at Spark+AI Summit 2019, together with the Linux Foundation, we announced the open-sourcing of the Delta Lake format so the greater community of data practitioners could make better use of their existing data lakes, without sacrificing data quality. Since open sourcing Delta Lake (using the permissive Apache license v2, the same license we used for Apache Spark), we’ve seen massive adoption and growth in the Delta Lake developer community and a paradigm shift in the data journey that practitioners and companies go through to unify their data with machine learning and AI use cases. It’s why we’ve seen such tremendous adoption and success.

Delta Lake Community Growth

Today, the Delta Lake project is thriving with over 190 contributors across more than 70 organizations, nearly two-thirds of whom are from outside Databricks contributors from leading companies like Apple, IBM, Microsoft, Disney, Amazon, and eBay, just to name a few. In fact, we’ve seen a 633% increase in contributor strength (as defined by the Linux Foundation) over the past three years. It’s this level of support that is the heart and strength of this open source project.

Graph showing consistent growth of contributor numbers to the project

“Graph showing consistent growth of contributor numbers to the project”

Source: Linux Foundation Contributor Strength: The growth in the aggregated count of unique contributors analyzed during the last three years. A contributor is anyone who is associated with the project by means of any code activity (commits/PRs/changesets) or helping to find and resolve bugs.

Delta Lake: the fastest and most advanced multi-engine storage format

Delta Lake was built for not just one tech company’s special use case but for a large variety of use cases representing the breadth of our customers and community, from finance, healthcare, manufacturing, operations, to public sector. Delta Lake has been deployed and battle-tested in 10s of thousands of deployments from the largest tables ranging in exabytes. As a result, time and again, Delta Lake comes out in real-world customer testing and third-party benchmarking as far ahead of other formats1 on performance and ease of use.

With Delta Sharing, it is easy for anyone to easily share data and read data shared from other Delta tables. We released Delta Sharing in 2021 to give the data community an option to break free of vendor lock-in. As data sharing became more popular, most of you expressed frustrations of even more data silos (now even outside the organization) due to proprietary data format and proprietary compute required to read it. Delta Sharing introduced an open protocol for secure real-time exchange of large data sets, which enables secure data sharing across products for the first time. Data users could now directly connect to the shared data through Pandas, Tableau, Presto, Trino, or dozens of other systems that implement the open protocol, without having to use any proprietary systems – including Databricks.

Delta Lake also boasts the richest ecosystem of direct connectors such as Flink, Presto, and Trino, giving you the ability to read and write to Delta Lake directly from the most popular engines without Apache Spark. Thanks to the Delta Lake contributors from Scribd and Back Market, you can also use Delta Rust – a foundational Delta Lake library in Rust that enables Python, Rust, and Ruby developers to read and write Delta without any big data framework. Today, Delta Lake is the most widely used storage layer in the world, with over 7 million monthly downloads; growing by 10x in monthly downloads in just one year.

Graph showing immense growth in monthly downloads over the past year

“Graph showing immense growth in monthly downloads over the past year”

Announcing Delta 2.0: Bringing everything to open source

Delta Lake 2.0, the latest release of Delta Lake, will further enable our massive community to benefit from all Delta Lake innovations with all Delta Lake APIs being open-sourced — in particular, the performance optimizations and functionality brought on by Delta Engine like ZOrder, Change Data Feed, Dynamic Partition Overwrites, and Dropped Columns. As a result of these new features, Delta Lake continues to provide unrivaled, out-of-the-box price-performance for all lakehouse workloads from streaming to batch processing — up to 4.3x faster compared to other storage layers. In the past six months, we spent significant effort to take all these performance enhancements and contribute them to Delta Lake. We are therefore open-sourcing all of Delta Lake and committing to ensuring that all features of Delta Lake will be open-sourced moving forward.

Delta 2.0 open-sourced features

“Delta 2.0 open-sourced features”

We are excited to see Delta Lake go from strength to strength. We look forward to partnering with you to continue the rapid pace of innovation and adoption of Delta Lake for years to come.

Interested in participating in the open-source Delta Lake community?
Visit Delta Lake to learn more; you can join the Delta Lake community via Slack and Google Group.

1 https://databeans-blogs.medium.com/delta-vs-iceberg-performance-as-a-decisive-criteria-add7bcdde03d

--

Try Databricks for free. Get started today.

The post Open Sourcing All of Delta Lake appeared first on Databricks.

Introducing Spark Connect – The Power of Apache Spark, Everywhere

$
0
0

At last week’s Data and AI Summit, we highlighted a new project called Spark Connect in the opening keynote. This blog post walks through the project’s motivation, high-level proposal, and next steps.

Spark Connect introduces a decoupled client-server architecture for Apache Spark that allows remote connectivity to Spark clusters using the DataFrame API and unresolved logical plans as the protocol. The separation between client and server allows Spark and its open ecosystem to be leveraged from everywhere. It can be embedded in modern data applications, in IDEs, Notebooks and programming languages.

Motivation

Over the past decade, developers, researchers, and the community at large have successfully built tens of thousands of data applications using Spark. During this time, use cases and requirements of modern data applications have evolved. Today, every application, from web services that run in application servers, interactive environments such as notebooks and IDEs, to edge devices such as smart home devices, wants to leverage the power of data.

Spark’s driver architecture is monolithic, running client applications on top of a scheduler, optimizer and analyzer. This architecture makes it hard to address these new requirements: there is no built-in capability to remotely connect to a Spark cluster from languages other than SQL. The current architecture and APIs require applications to run close to the REPL, i.e., on the driver, and thus do not cater to interactive data exploration, as is commonly done with notebooks, or allow for building out the rich developer experience common in modern IDEs. Finally, programming languages without JVM interoperability cannot leverage Spark today.

Spark's monolithic driver poses several challenges

Spark’s monolithic driver poses several challenges

Additionally, Spark’s monolithic driver architecture also leads to operational problems:

  • Stability: Since all applications run directly on the driver, users can cause critical exceptions (e.g. out of memory) which may bring the cluster down for all users.
  • Upgradability: the current entangling of the platform and client APIs (e.g., first and third-party dependencies in the classpath) does not allow for seamless upgrades between Spark versions, hindering new feature adoption.
  • Debuggability and observability: The user may not have the correct security permission to attach to the main Spark process and debugging the JVM process itself lifts all security boundaries put in place by Spark. In addition, detailed logs and metrics are not easily accessible directly in the application.

How Spark Connect works

To overcome all of these challenges, we introduce Spark Connect, a decoupled client-server architecture for Spark.

The client API is designed to be thin, so that it can be embedded everywhere: in application servers, IDEs, notebooks, and programming languages. The Spark Connect API builds on Spark’s well-known and loved DataFrame API using unresolved logical plans as a language-agnostic protocol between the client and the Spark driver.

Spark Connect provides a Client API for Spark

Spark Connect provides a Client API for Spark

The Spark Connect client translates DataFrame operations into unresolved logical query plans which are encoded using protocol buffers. These are sent to the server using the gRPC framework. In the example below, a sequence of dataframe operations (project, sort, limit) on the logs table is translated into a logical plan and sent to the server.

Processing Spark Connect operations in Spark

Processing Spark Connect operations in Spark

The Spark Connect endpoint embedded on the Spark Server, receives and translates unresolved logical plans into Spark’s logical plan operators. This is similar to parsing a SQL query, where attributes and relations are parsed and an initial parse plan is built. From there, the standard Spark execution process kicks in, ensuring that Spark Connect leverages all of Spark’s optimizations and enhancements. Results are streamed back to the client via gRPC as Apache Arrow-encoded row batches.

Overcoming multi-tenant operational issues

With this new architecture, Spark Connect mitigates today’s operational issues:

  • Stability: Applications that use too much memory will now only impact their own environment as they can run in their own processes. Users can define their own dependencies on the client and don’t need to worry about potential conflicts with the Spark driver.
  • Upgradability: Spark driver can now seamlessly be upgraded independently of applications, e.g. to benefit from performance improvements and security fixes. This means applications can be forward-compatible, as long as the server-side RPC definitions are designed to be backwards compatible.
  • Debuggability and Observability: Spark Connect enables interactive debugging during development directly from your favorite IDE. Similarly, applications can be monitored using the application’s framework native metrics and logging libraries.

Next Steps

The Spark Improvement Process proposal was voted on and accepted by the community. We plan to work with the community to make Spark Connect available as an experimental API in one of the upcoming Apache Spark releases.

Our initial focus will be on providing DataFrame API coverage for PySpark to make the transition to this new API seamless. However, Spark Connect is a great opportunity for Spark to become more ubiquitous in other programming language communities and we’re looking forward to seeing contributions of bringing Spark Connect clients to other languages.

We look forward to working with the rest of the Apache Spark community to develop this project. If you want to follow the development of Spark Connect in Apache Spark make sure to follow the dev@spark.apache.org mailing list or submit your interest using this form.

--

Try Databricks for free. Get started today.

The post Introducing Spark Connect – The Power of Apache Spark, Everywhere appeared first on Databricks.

Using Airbyte for Unified Data Integration Into Databricks

$
0
0

Today, we are thrilled to announce a native integration with Airbyte Cloud, which allows data replication from any source into Databricks for all data, analytics, and ML workloads. Airbyte Cloud, a hosted service made by Airbyte, provides an integration platform that can scale with your custom or high-volume needs, from large databases to a long-tail of API sources. This integration with Databricks helps break down data silos by letting users replicate data into the Databricks Lakehouse Destination to process, store, and expose data throughout your organization.

As an open source standard for ELT, Airbyte provides more than 150 editable pre-built connectors – or easily create new ones in a matter of hours.

150+ Source Connectors to load data into Databricks Lakehouse

150+ Source Connectors to load data into Databricks Lakehouse

With a dedicated Databricks connector, joint users can sync any data source that Airbyte supports into Databricks Delta Lake. The best part? The connector supports incremental and full refresh and allows use cases with CDC from your OLTP systems directly into Databricks, without the hassle of implementing it yourself. Check out a tutorial on loading data into Delta Lake to follow along.

As we continue to deepen the overall integration between Airbyte and Databricks Lakehouse Platform, we are excited about the upcoming addition of Airbyte Cloud to Databricks Partner Connect, a one-stop portal for customers to quickly discover a broad set of validated data, analytics, and AI tools and easily integrate them with their Databricks lakehouse across multiple cloud providers.

Airbyte Cloud helps unify your data integration pipelines under one fully managed platform powered by an active open-source community. Via Partner Connect, Databricks and Airbyte will bring a seamless experience for you to replicate data from any source into Databricks. Coming soon, any Databricks customer will be able to start a free trial of Airbyte Cloud from Partner Connect and automatically integrate the two products. That said, the two products already work great together, and we encourage you to connect Airbyte Cloud to Databricks today.

Speaking of working and learning together, I hope you stop by Airbyte CEO Michel Tricot’s presentation on open source powers the modern data stack and learn more at their conference move(data).

Stay tuned for more exciting updates on how Databricks works with Airbyte, and watch their GitHub repository for new releases.

--

Try Databricks for free. Get started today.

The post Using Airbyte for Unified Data Integration Into Databricks appeared first on Databricks.

Databricks Ventures Invests in Tecton: An Enterprise Feature Platform for the Lakehouse

$
0
0

Operational machine learning, which involves applying machine learning to customer-facing applications or business operations, requires solving complex data problems. Data teams need to turn raw data into features (i.e, data used as inputs into a predictive model), and then serve and monitor these features in production. The challenge of deploying machine learning to production for operational purposes introduces new requirements for data tools and data infrastructure. At Databricks, we understand the tremendous value that solving these challenges could provide to customers and end users.

Today, we are pleased to announce Databricks Ventures’ investment in Tecton, the enterprise feature platform company. Tecton’s founders, Mike del Baso and Kevin Stumpf, met while working at Uber where they were part of the pioneering team building the Michelangelo Machine Learning Platform. There, they experienced firsthand the challenges of operationalizing machine learning, which ultimately led them to build Tecton so that companies can more easily operationalize ML in their applications. Tecton’s products are built to make AI and machine learning more accessible, which is strongly aligned with Databricks’ overarching mission to simplify and democratize data and AI.

The investment follows our recent announcement of a deeper partnership between Databricks and Tecton. Tecton has deeply integrated into Databricks to serve as a central interface between the Databricks Lakehouse Platform and customers’ ML models, and customers can use this integrated offering to build production-ready ML features on Databricks in minutes.

At Databricks, we believe in providing our customers with choices to complement their use of the Databricks Lakehouse Platform. While many of our customers are already leveraging Databricks’ Feature Store and other feature engineering capabilities to deliver cutting edge ML use cases, we believe our customers should be empowered to complement their ML use cases with other innovative tools such as Tecton.

We are excited to partner with Tecton to provide our customers with an unrivaled platform for all of their machine learning and AI needs, and we will continue to look for more ways to work even more closely with Tecton. In the future, our joint customers can expect to see an even more seamless integration via Tecton’s availability within Databricks Partner Connect. Keep an eye out for more announcements later this year!

--

Try Databricks for free. Get started today.

The post Databricks Ventures Invests in Tecton: An Enterprise Feature Platform for the Lakehouse appeared first on Databricks.


6 Guiding Principles to Build an Effective Data Lakehouse

$
0
0

In this blog post, we will discuss some guiding principles to help you build a highly-effective and efficient data lakehouse that delivers on modern data and AI needs to achieve your business goals. If you are not familiar with the data lakehouse, a new, open architecture, you can read more about it in this blog post.

Before we begin, it is beneficial to define what we mean by guiding principles. Guiding principles are level-zero rules that define and influence your architecture. They reflect a level of consensus among the various stakeholders of the enterprise and form the basis for making future data and AI architecture decisions. Let’s explore six guiding principles we’ve established based on our own personal observations and direct insights from customers.

Principle 1: Curate Data and Offer Trusted Data-as-Products

Curating data by establishing a layered (or multi-hop) architecture is a critical best practice for the lakehouse, as it allows data teams to structure the data according to quality levels and define roles and responsibilities per layer. A common layering approach is:

  • Raw Layer: Source data gets ingested into the Lakehouse into the first layer and should be persisted there. When all downstream data is created from the Raw Layer, rebuilding the subsequent layers from this layer is possible, if needed.
  • Curated layer: The purpose of the second layer is to hold cleansed, refined, filtered and aggregated data. The goal of this layer is to provide a sound, reliable foundation for analyses and reports across all roles and functions.
  • Final Layer: The third layer is created around business or project needs; it provides a different view as data products to other business units or projects, preparing data around security needs (e.g. anonymized data) or optimizing for performance (e.g. pre-aggregated views). The data products in this layer are seen as the truth for the business.

Figure 1: Data quality, as well as trust in data, increase as data progresses through the layers.

Pipelines across all layers need to ensure that data quality constraints are met (i.e data is accurate, complete, accessible and consistent at all times), even during concurrent reads and writes. The validation of new data happens at the time of data entry into the Curated Layer, and the following ETL steps work to improve the quality of this data.
It is important to note that data quality needs to increase as data progresses through the layers and, as such, the trust in the data will subsequently rise from a business point of view.

Principle 2: Remove Data Silos and Minimize Data Movement

Data movement, copy, and duplication take time and may decrease the quality of the data in the Lakehouse, especially when it leads to data silos. To make the distinction clear between data copy vs data silo, a standalone or throwaway copy of data is not harmful on its own. It is sometimes necessary for boosting agility, experimentation and innovation. When these copies become operational with downstream business data products dependant on them, they become data silos.

To prevent data silos, data teams usually attempt to build a mechanism or data pipeline to keep all copies in sync with the original. Since this will likely not happen consistently, data quality will eventually degrade. And this finally leads to higher costs and a significant loss of trust by the users. On the other hand, several business use cases require data sharing, for example, with partners or suppliers. An important aspect is to securely and reliably share the latest version of the data. Copies of the data are often not sufficient since they become for example out of sync quickly. Instead, data should be shared via enterprise data sharing tools.

Figure 2: Lakehouses have capabilities that allows business user to query data, as well as share it with partners.

Principle 3: Democratize Value Creation through Self-Service Experience

Now, and even more in the future, businesses that have successfully moved to a data-driven culture will thrive. This means every business unit derives its decisions from analytical models or from analyzing its own or centrally provided data. For consumers, data has to be easily discoverable and securely accessible. A good concept for data producers is “data as a product”; the data will be offered and maintained by one business unit or business partner like a product and consumed by other parties – with proper permission control. Instead of relying on a central team and potentially slow request processes, these data products need to be created, offered, discovered and consumed in a self-service experience.

However, it’s not just the data that matters. The democratization of data requires the right tools to enable everyone to produce or consume and understand the data. At the core of this is the Data Lakehouse as the modern Data and AI platform that provides the infrastructure and tooling for building data products without duplicating the effort of setting up another tool stack.

Figure 3: Lakehouse allows data teams to build data products that can be used through a self-service experience.

Principle 4: Adopt an Organization-wide Data Governance Strategy

Data Governance is a wide field that deserves a separate blog post. However, the dimensions Data Quality, Data Catalog and Access Control play an important role. Let’s dive into each of these.

Data Quality
The most important prerequisite for correct and meaningful reports, analysis results and models is high quality data. Quality assurance (QA) needs to exist around all pipeline steps. Examples of how to execute on this include having data contracts, meeting SLAs and keeping schemas stable and evolving them in a controlled way.

Data Catalog
Another important aspect is data discovery: Users of all business areas, especially in a self-service model, need to be able to discover relevant data easily. Therefore, a Lakehouse needs a data catalog that covers all business-relevant data. The primary goals of a data catalog are as follows:

  • Ensure the same business concept is uniformly called and declared across the business. You might think of it as a semantic model in the Curated and the Final layer.
  • Track the data lineage precisely so that users can explain how these data arrived at their current shape and form.
  • Maintain high-quality metadata, which is as important as the data itself for proper use of the data.

Access Control
As the value creation from the data in the Lakehouse happens across all business areas, the Lakehouse needs to be built with security as a first-class citizen. Companies might have a more open data access policy or strictly follow the principle of least privileges. Independent of that, data access controls need to be in place in every layer. It is important to implement fine-grade permission schemes from the very beginning (column- and row-level access control, role-based or attribute-based access control). Companies can still start with less strict rules. But as the Lakehouse platform grows, all mechanisms and processes to move to a more sophisticated security regime should already be in place. Additionally, all access to the data in the Lakehouse needs to be governed by audit logs from the get-go.

Figure 4: Lakehouse governance not only has strong access controls in place, but also can track data lineage.

Principle 5: Encourage the Use of Open Interfaces and Open Formats

Open interfaces are critical to enabling interoperability and preventing dependency on any single vendor. Traditionally, vendors built proprietary technologies and closed interfaces that limited enterprises in the way they can store, process and share data.

Building upon open interfaces helps you build for the future: (i) It increases the longevity and portability of the data so that you can use it with more applications and for more use cases. (ii) It opens an ecosystem of partners who can quickly leverage the open interfaces to integrate their tools into the Lakehouse platform. Finally, by standardizing on open formats for data, total costs will be significantly lower; one can access the data directly on the cloud storage without the need to pipe it through a proprietary platform that can incur high egress and computation costs.

Figure 5: Lakehouse is built on open sources and open interfaces for easier integration with third party tools.

Principle 6: Build to Scale and Optimize for Performance & Cost

Standard ETL processes, business reports and dashboards often have a predictable resource need from a memory and computation perspective. However, new projects, seasonal tasks or modern approaches like model training (churn, forecast, maintenance) will generate peaks of resource need. To enable a business to perform all these workloads, a scalable platform for memory and computation is necessary. New resources need to be added easily on demand, and only the actual consumption should generate costs. As soon as the peak is over, resources can be freed up again and costs reduced accordingly. Often, this is referred to as horizontal scaling (fewer or more nodes) and vertical scaling (larger or smaller nodes).

Scaling also enables businesses to improve the performance of queries by selecting nodes with more resources or clusters with more nodes. But instead of permanently providing large machines and clusters they can be provisioned on demand only for the time needed to optimize the overall performance to cost ratio. Another aspect for optimization is storage versus compute resources. Since there is no clear relation between volume of the data and workloads using this data (e.g. only using parts of the data or doing intensive calculations on small data), it is a good practice to settle on an infrastructure platform that decouples storage and compute resources

Figure 6: Lakehouse detaching storage form compute as well as leverage elastic compute for better scalability.

Why Databricks Lakehouse

The Databricks platform is a native Data Lakehouse platform that was built from ground up to deliver all the required capabilities to make data teams efficient at delivering self-service data products. It combines the best features of data warehouses and data lakes as a single solution for all major data workloads. Supported use cases range from stream analytics to BI, data science and AI. The Databricks Lakehouse aim for three main goals:

  • Simple – unify your data, analytics, and AI use cases on a single platform
  • Open – build on open source and open standards
  • Multi-cloud – One consistent data platform across clouds

It enables teams to easily collaborate and comes with integrated capabilities that touch the complete lifecycle of your data products, including data ingestion, data processing, data governance and data publishing/sharing. You can read more about Databricks Lakehouse here.

--

Try Databricks for free. Get started today.

The post 6 Guiding Principles to Build an Effective Data Lakehouse appeared first on Databricks.

Using Spark Structured Streaming to Scale Your Analytics

$
0
0

This is a guest post from the M Science Data Science & Engineering Team.

Modern data doesn’t stop growing

“Engineers are taught by life experience that doing something quick and doing something right are mutually exclusive! With Structured Streaming from Databricks, M Science gets both speed and accuracy from our analytics platform, without the need to rebuild our infrastructure from scratch every time.”
– Ben Tallman, CTO

Let’s say that you, a “humble data plumber” of the Big Data era and have been tasked to create an analytics solution for an online retail dataset:

Invoice
No
Stock
Code
Description Quantity Invoice
Date
Unit
Price
Customer
ID
Country
536365 85123A WHITE HANGING HEA 6 2012-01-10 2.55 17850 United Kingdom
536365 71053 WHITE METAL LANTERN 6 2012-01-10 3.39 17850 United Kingdom
536365 84406B CREAM CUPID HEART 8 2012-01-10 2.75 17850 United Kingdom

The analysis you’ve been asked for is simple – an aggregation of the number of dollars, units sold, and unique users for each day, and across each stock code. With just a few lines of PySpark, we can transform our raw data into a usable aggregate:


import pyspark.sql.functions as F

df = spark.table("default.online_retail_data")

agg_df = (
  df
  # Group data by month, item code and country
  .groupBy(
    "InvoiceDate",
    "StockCode",
  )
  # Return aggregate totals of dollars, units sold, and unique users
  .agg(
    F.sum("UnitPrice")
      .alias("Dollars"),
    F.sum("Quantity")
      .alias("Units"),
    F.countDistinct("CustomerID")
      .alias("Users"),
  )
)

(
  agg_df.write
  .format('delta')
  .mode('overwrite')
  .saveAsTable("analytics.online_retail_aggregations")
)

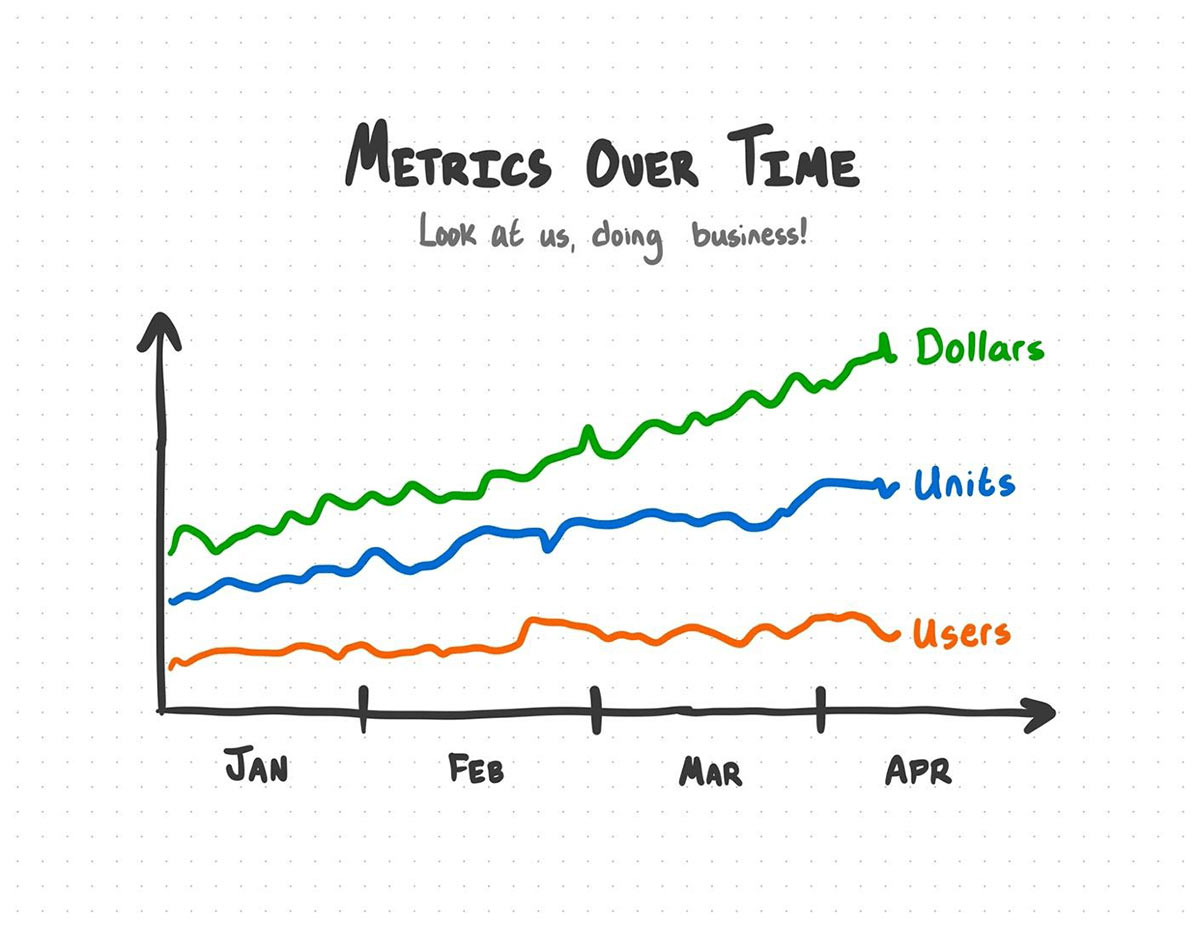
With your new aggregated data, you can throw together a nice visualization to do... business things.

Sample business visualization created with static aggregated data.

This works – right?

An ETL process will work great for a static analysis where you don’t expect the data to ever be updated – you assume the data you have now will be the only data you ever have. The problem with a static analysis?

Modern data doesn’t stop growing

What are you going to do when you get more data?

The naive answer would be to just run that same code every day, but you’d re-process all the data every time you run the code, and each new update means re-processing data you’ve already processed before. When your data gets big enough, you’ll be doubling down on what you spend in time and compute costs.

An ETL process will work great for a static analysis where you don't expect the data to ever be updated.

With static analysis, you spend money on re-processing data you’ve already processed before.

There are very few modern data sources that aren’t going to be updated. If you want to keep your analytics growing with your data source and save yourself a fortune on compute cost, you’ll need a better solution.

What do we do when our data grows?

In the past few years, the term “Big Data” has become… lacking. As the sheer volume of data has grown and more of life has moved online, the era of Big Data has become the era of “Help Us, It Just Won’t Stop Getting Bigger Data.” A good data source doesn’t stop growing while you work; this growth can make keeping data products up-to-date a monumental task.

At M Science, our mission is to use alternative data – data outside of your typical quarterly report or stock trend data sources – to analyze, refine, and predict change in the market and economy.

Every day, our analysts and engineers face a challenge: alternative data grows really fast. I’d even go as far to say that, if our data ever stops growing, something in the economy has gone very, very wrong.

As our data grows, our analytics solutions need to handle that growth. Not only do we need to account for growth, but we also need to account for data that may come in late or out-of-order. This is a vital part of our mission – every new batch of data could be the batch that signals a dramatic change in the economy.

To make scalable solutions to the analytics products that M Science analysts and clients depend on every day, we use Databricks Structured Streaming, an Apache Spark™ API for scalable and fault-tolerant stream processing built on the Spark SQL engine with the Databricks Lakehouse Platform. Structured Streaming assures us that, as our data grows, our solutions will also scale.

Using Spark Structured Streaming

Structured Streaming comes into play when new batches of data are being introduced into your data sources. Structured Streaming leverages Delta Lake’s ability to track changes in your data to determine what data is part of an update and re-computes only the parts of your analysis that are affected by the new data.

It’s important to re-frame how you think about streaming data. For many people, “streaming” means real-time data – streaming a movie, checking Twitter, checking the weather, et cetera. If you’re an analyst, engineer, or scientist, any data that gets updated is a stream. The frequency of the update doesn’t matter. It could be seconds, hours, days, or even months – if the data gets updated, the data is a stream. If the data is a stream, then Structured Streaming will save you a lot of headaches.

With Structured Streaming, you can avoid the cost of re-processing previous data

With Structured Streaming, you can avoid the cost of re-processing previous data


Let’s step back into our hypothetical – you have an aggregate analysis that you need to deliver today and keep updating as new data rolls in. This time, we have the DeliveryDate column to remind us of the futility of our previous single-shot analysis:

Invoice
No
Stock
Code
Description Quantity Invoice
Date
Delivery
Date
Unit
Price
Customer
ID
Country
536365 85123A WHITE HANGING HEA 6 2012-01-10 2012-01-17 2.55 17850 United Kingdom
536365 71053 WHITE METAL LANTERN 6 2012-01-10 2012-01-15 3.39 17850 United Kingdom
536365 84406B CREAM CUPID HEART 8 2012-01-10 2012-01-16 2.75 17850 United Kingdom

Thankfully, the interface for Structured Streaming is incredibly similar to your original PySpark snippet. Here is your original static batch analysis code:


# =================================
# ===== OLD STATIC BATCH CODE =====
# =================================

import pyspark.sql.functions as F

df = spark.table("default.online_retail_data")

agg_df = (
    df

    # Group data by date & item code
    .groupBy(
        "InvoiceDate",
        "StockCode",
    )

    # Return aggregate totals of dollars, units sold, and unique users
    .agg(
        F.sum("UnitPrice")
            .alias("Dollars"),
        F.sum("Quantity")
            .alias("Units"),
        F.countDistinct("CustomerID")
            .alias("Users"),
    )
)

(
    agg_df.write
    .format('delta')
    .mode('overwrite')
    .saveAsTable("analytics.online_retail_aggregations")
)

With just a few tweaks, we can adjust this to leverage Structured Streaming. To convert your previous code, you’ll:

  1. Read our input table as a stream instead of a static batch of data
  2. Make a directory in your file system where checkpoints will be stored
  3. Set a watermark to establish a boundary for how late data can arrive before it is ignored in the analysis
  4. Modify some of your transformations to keep the saved checkpoint state from getting too large
  5. Write your final analysis table as a stream that incrementally processes the input data

We’ll apply these tweaks, run through each change, and give you a few options for how to configure the behavior of your stream.

Here is the ‚"stream-ified"‚ version of your old code:


# =========================================
# ===== NEW STRUCTURED STREAMING CODE =====
# =========================================

+ CHECKPOINT_DIRECTORY = "/delta/checkpoints/online_retail_analysis"
+ dbutils.fs.mkdirs(CHECKPOINT_DIRECTORY)

+ df = spark.readStream.table("default.online_retail_data")

agg_df = (
  df
+   # Watermark data with an InvoiceDate of -7 days
+   .withWatermark("InvoiceDate", f"7 days")

    # Group data by date & item code
    .groupBy(
      "InvoiceDate",
      "StockCode",
    )

    # Return aggregate totals of dollars, units sold, and unique users
    .agg(
      F.sum("UnitPrice")
        .alias("Dollars"),
      F.sum("Quantity")
        .alias("Units"),
+     F.approx_count_distinct("CustomerID", 0.05)
        .alias("Users"),
    )
)

(
+ agg_df.writeStream
    .format("delta")
+   .outputMode("update")
+   .trigger(once = True)
+   .option("checkpointLocation", CHECKPOINT_DIR)
+   .toTable("analytics.online_retail_aggregations")
)

Let’s run through each of the tweaks we made to get Structured Streaming working:

1. Stream from a Delta Table

  
   + df = spark.readStream.table("default.online_retail_data")

Of all of Delta tables’ nifty features, this may be the niftiest: You can treat them like a stream. Because Delta keeps track of updates, you can use .readStream.table() to stream new updates each time you run the process.

It’s important to note that your input table must be a Delta table for this to work. It’s possible to stream other data formats with different methods, but .readStream.table() requires a Delta table

2. Declare a checkpoint location

 
   + # Create checkpoint directory
   + CHECKPOINT_DIRECTORY = "/delta/checkpoints/online_retail_analysis"
   + dbutils.fs.mkdirs(CHECKPOINT_DIRECTORY)

In Structured Streaming-jargon, the aggregation in this analysis is a stateful transformation. Without getting too far in the weeds, Structured Streaming saves out the state of the aggregation as a checkpoint every time the analysis is updated.

This is what saves you a fortune in compute cost: instead of re-processing all the data from scratch every time, updates simply pick up where the last update left off.

3. Define a watermark

 
   + # Watermark data with an InvoiceDate of -7 days
   + .withWatermark("InvoiceDate", f"7 days")

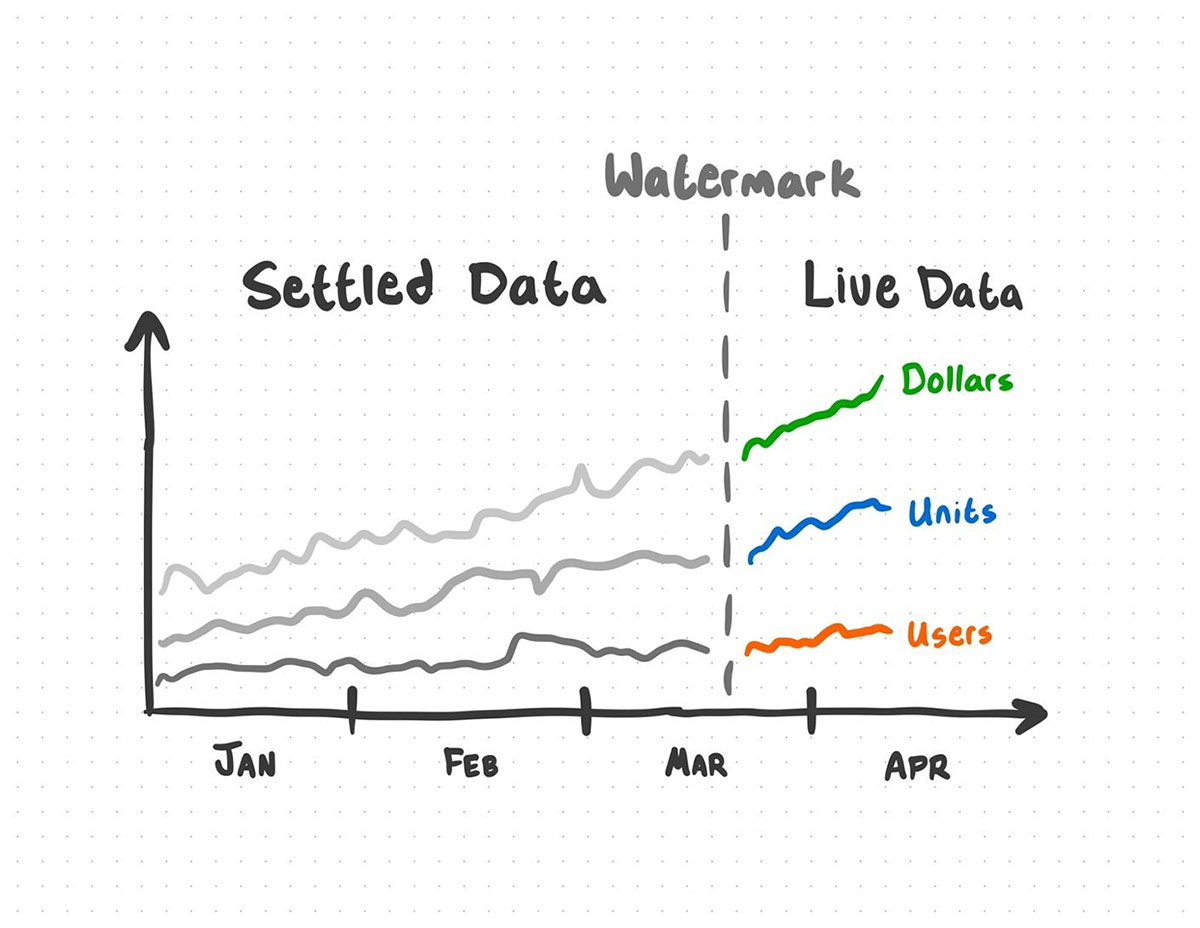
When you get new data, there’s a good chance that you may receive data out-of-order. Watermarking your data lets you define a cutoff for how far back aggregates can be updated. In a sense, it creates a boundary between “live” and “settled” data.

To illustrate: let’s say this data product contains data up to the 7th of the month. We’ve set our watermark to 7 days. This means aggregates from the 7th to the 1st are still “live”. New updates could change aggregates from the 1st to the 7th, but any new data that lagged behind more than 7 days won’t be included in the update – aggregates prior to the 1st are “settled”, and updates for that period are ignored.

Watermarking your data lets you define a cutoff for how far back aggregates can be updated.

New data that falls outside of the watermark is not incorporated into the analysis.

It’s important to note that the column you use to watermark must be either a Timestamp or a Window.

4. Use Structured Streaming-compatible transformations


   + F.approx_count_distinct("CustomerID", 0.05)

In order to keep your checkpoint states from ballooning, you may need to replace some of your transformations with more storage-efficient alternatives. For a column that may contain lots of unique individual values, the approx_count_distinct function will get you results within a defined relative standard deviation.

5. Create the output stream

 
   + agg_df.writeStream
       .format("delta")
   +   .outputMode("update")
   +   .trigger(once = True)
   +   .option("checkpointLocation", CHECKPOINT_DIR)
   +   .toTable("analytics.online_retail_aggregations")

The final step is to output the analysis into a Delta table. With this comes a few options that determine how your stream will behave:

  • .outputMode("update") configures the stream so that the aggregation will pick up where it left off each time the code runs instead of running from scratch. To re-do an aggregation from scratch, you can use "complete" – in effect, doing a traditional batch aggregate while still preserving the aggregation state for a future "update" run.
  • trigger(once = True) will trigger the query once, when the line of output code is started, and then stop the query once all of the new data has been processed.
  • "checkpointLocation" lets the program know where checkpoints should be stored.

These configuration options make the stream behave most closely like the original one-shot solution.

This all comes together to create a scalable solution to your growing data. If new data is added to your source, your analysis will take into account the new data without costing an arm and a leg.


You’d be hard pressed to find any context where data isn’t going to be updated at some point. It’s a soft agreement that data analysts, engineers, and scientists make when we work with modern data – it’s going to grow, and we have to find ways to handle that growth.

With Spark Structured Streaming, we can use the latest and greatest data to deliver the best products, without the headaches that come with scale.

--

Try Databricks for free. Get started today.

The post Using Spark Structured Streaming to Scale Your Analytics appeared first on Databricks.

Hunting for IOCs Without Knowing Table Names or Field Labels

$
0
0

There is a breach! You are an infosec incident responder and you get called in to investigate. You show up and start asking people for network traffic log and telemetry data. People start sharing terabytes of data with you, pointing you to various locations in cloud storage. You compile a list of hundreds of IP addresses and domain names as indicators of compromise (IOCs). To start, you want to check if any of those IOCs show up in the log and telemetry data given to you. You take a quick look and realize that there is log data from all the different systems, security appliances, and cloud providers that the organization uses – lots of different schemas and formats. How would you analyze this data? You cannot exactly download the data onto a laptop and perform grep. You cannot exactly put this into a Security Information and Event Management (SIEM) system either – it will be cumbersome to set up, too expensive and likely too slow. How would you query for IOCs over the different schemas? You imagine spending days figuring out the different schemas.

Now imagine if you had the Databricks Lakehouse platform. All the log and telemetry data exported from the organization’s systems, security sensors and cloud providers can be ingested directly into Databricks Lakehouse delta tables (also stored in inexpensive cloud storage). Delta tables also facilitate high performance analytics and AI/ML. Since Databricks can operate in multiple clouds, there is no need to consolidate data into a single cloud when the data resides in multiple clouds. You can filter the data in Databricks over multiple clouds and get the results as parquet files via the Delta Sharing protocol. Hence you only pay egress costs for query results not data ingestion! Imagine the kinds of queries, analytics and AI/ML models you could run on such a cybersecurity platform as you deep dive into an incident response (IR) investigation. Imagine how easy it would be to search for those IOCs.

In this blog, we will

  1. explain the IOC matching problem in cybersecurity operations,
  2. show you how to perform IOC matching on logs and telemetry data stored in the Databricks Lakehouse platform without knowing the table names or field names,
  3. show you how to extend ad hoc queries to do continuous or incremental monitoring, and
  4. show you how to create summary structures to increase time coverage and speed up historical IOC searches.

At the end of this blog, you will be able to take the associated notebook and sample data and try this in your own Databricks workspace.

Why is IOC matching important?

Detection

Matching of atomic IOCs is a fundamental building block of detection rules or models used by detection systems such as endpoint detection and response (EDR) systems and Intrusion detection (IDS) systems. An atomic IOC can be an IP address, a fully qualified domain name (FQDN), a file hash (MD5, SHA1, SHA256 etc.), a TLS fingerprint, a registry key or a filename associated with a potential intrusion or malicious activity. Detection systems typically use (atomic) IOC matching in conjunction with other predicates to detect a cyber threat and generate a security incident alert with relatively high confidence.

For example, consider the IOC for the FQDN of a malicious command and control (C2) server. The detection rule needs to find a domain name system (DNS) request that matches that FQDN in the logs, verify that the request was successful, verify that the host that sent that request attempted to connect to the IP address associated with the FQDN before generating an alert. Alerts from a detection system are typically aggregated, prioritized, and triaged by the security operations center (SOC) of an organization. Most alerts are false positives, but when a true positive alert is discovered, an incident response workflow is triggered.

Incident Response (IR)

When a breach, such as the SolarWinds hack, is suspected, one of the first tasks incident responders will do is to construct a list of relevant IOCs and scan all logs and telemetry data for those IOCs.The result of the scan, or IOC matching, is a list of IOC hits (sometimes also called leads or low fidelity alerts). These IOC hits are then scrutinized by incident responders and a deeper forensic investigation is conducted on the impacted systems. The intent of the forensic investigation is to establish the timeline and the scope of the breach.

Threat Hunting

Threat hunting is a proactive search for security threats that have evaded the existing detection systems. Threat hunting typically starts with an IOC search across all available logs and telemetry data. The list of IOCs used for hunting is typically curated from organization-specific threats found in the past, public news/blogs, and threat intelligence sources. We can further break down threat intelligence sources into paid subscriptions like (VirusTotal etc.), open source (Facebook ThreatExchange), and law enforcement (FBI, DHS, CyberCommand).

In both IR and threat hunting use cases, the incident responder or threat hunter (henceforth “analyst”) will perform IOC matching to obtain a list of IOC hits. These hits are grouped by devices (hosts, servers, laptops, etc.) on which the event associated with the IOC occurred. For each of these groups, the analyst will pull and query additional data just prior to the event timestamp. Those data include process executions, file downloads, user accounts and are sometimes enriched with threat intelligence (eg. check file hashes against VirusTotal). If the triggering event is deemed malicious, remediation actions like isolating or quarantining the device might be taken. Note that a limitation of IOCs from threat intelligence subscriptions is that they are limited to “public” indicators (eg. public IP addresses) – some malicious actors hijack the victims infrastructure and hence operate out of a private IP address that is harder to detect. In any case, the investigation process is driven by the IOC matching operation and hence its importance in cybersecurity operations.

Why is IOC matching difficult?

Consider the IOC matching for IR use case. In the best case all the data sits in a security information and event management (SIEM) system and thus can be easily queried; however, a SIEM typically has a relatively short retention period (typically less than 90 days in hot storage) due to costs and some threats may operate in the organization’s environment for as long as a year. The Solarwinds, or Sunburst breach of 2020 is a good example: the earliest activity dates back to February 2020 even though the breach was only discovered in November 2020. Moreover, even if you can afford to keep a year’s worth of data in a SIEM, most legacy SIEMs are not able to query over that much data at interactive speeds and many analysts end up “chunking” up the query into multiple queries that cover a short period (e.g., a week) at a time. In other cases, the data might sit across multiple siloed data stores with longer retention, but significant effort will be needed to perform IOC matching over the disparate data stores.

Even when an external cybersecurity vendor is engaged for the IR, the vendor IR team will often want to pull the customer data back into a central data store with the capabilities of performing IOC matching and analytics. One difficulty will be the variability in the data schemas of the data being pulled back and some effort will be needed to deal with the schema variability either using schema-on-write or schema-on-read techniques. Another difficulty will be the coverage of the search in terms of time or data retention. Given the urgency of an IR, only a recent time window of data is pulled back and scrutinized, because it is often difficult or infeasible to acquire the volume of data covering a long retention period. Note that data acquisition in an IR can be very complex: the customer may not have a secure, long-retention, and tamper-proof logging facility; the logs might have rolled on the source systems due to limited storage; the threat actors might tamper with the logs to cover their tracks.

The threat hunting use case faces similar data engineering challenges, but has an additional difficulty in that the list of IOCs to be matched can be in the hundreds or thousands. While performing single IOC matching might still be acceptable for the IR use case where the list of IOCs is in the tens, that approach will not be feasible for threat hunting. IOC matching for threat hunting needs to be treated like a database join operation and leverage the various high performance join algorithms developed by the database community.

IOC Matching using the Databricks Lakehouse Platform

Now back to the incident response (IR) scenario we started the blog with – how would you do IOC matching over all your log and telemetry data?

If you have a SIEM, you can run a query matching a single or a list of IOCs, but we have already mentioned the limitations. Maybe you build your own solution by sending and storing all your logs and telemetry in cheap cloud storage like AWS S3 (or Azure Data Lake Storage (ADLS) or Google cloud storage). You will still need a query engine like Presto/Trino, AWS Athena, AWS Redshift, Azure Data Explorer, or Google Big Query to query the data. Then you will also need a user interface (UI) that would support the collaboration needed for most IR and threat hunting use cases. Gluing all those pieces together into a functional solution still takes significant engineering effort.

The good news is that the Databricks Lakehouse platform is a single unified data platform that:

  • lets you ingest all the logs and telemetry from their raw form in cloud storage into delta tables (also in cloud storage) using the Delta Lake framework (the Delta Lake frame uses an open format and supports fast, reliable and scalable query processing);
  • supports both analytics and AI/ML workloads on the same delta tables – no copying or ETL needed;
  • supports collaborative workflows via the notebook UI as well as via a set of rich APIs and integrations with other tools and systems;
  • Supports both streaming and batch processing in the same runtime environment.

Databricks for the IR Scenario

Let us dive into the IR scenario assuming all the data has been ingested into the Databricks Lakehouse platform. You want to check if any of those IOCs you compiled has occurred in any of the logs and telemetry data for the past 12 months. Now you are faced with the following questions:

  1. Which databases, tables and columns contain relevant data that should be checked for IOCs?
  2. How do we extract the indicators (IP addresses, FQDNs) from the relevant columns?
  3. How do we express the IOC matching query as an efficient JOIN query?

The first question is essentially a schema discovery task. You are free to use a third party schema discovery tool, but it is also straightforward to query the Databricks metastore for the metadata associated with the databases, tables and columns. The following code snippet does that and puts the results into a temporary view for further filtering.

db_list = [x[0] for x in spark.sql("SHOW DATABASES").collect()]
excluded_tables = ["test01.ioc", "test01.iochits"]

# full list = schema, table, column, type
full_list = []
for i in db_list:
 try:
   tb_df = spark.sql(f"SHOW TABLES IN {i}")
 except Exception as x:
   print(f"Unable to show tables in {i} ... skipping")
   continue
 for (db, table_name, is_temp) in tb_df.collect():
   full_table_name = db + "." + table_name
   if is_temp or full_table_name in excluded_tables:
     continue
   try:
     cols_df = spark.sql(f"DESCRIBE {full_table_name}")
   except Exception as x:
     # most likely the exception is a permission denied, because the table is not visible to this user account
     print(f"Unable to describe {full_table_name} ... skipping")
     continue
   for (col_name, col_type, comment) in cols_df.collect():
     if not col_type or col_name[:5]=="Part ":
       continue
     full_list.append([db, table_name, col_name, col_type]) 
  
spark.createDataFrame(full_list, schema = ['database', 'tableName', 'columnName', 'colType']).createOrReplaceTempView("allColumns")

display(spark.sql("SELECT * FROM allColumns"))

You then write a SQL query on the temporary view to find the relevant columns using simple heuristics in the WHERE-clause.

metadata_sql_str = """
SELECT database, tableName,
 collect_set(columnName) FILTER
           (WHERE columnName ilike '%orig%'
           OR columnName ilike '%resp%'
           OR columnName ilike '%dest%'
           OR columnName ilike '%dst%'
           OR columnName ilike '%src%'
           OR columnName ilike '%ipaddr%'
           OR columnName IN ( 'query', 'host', 'referrer' )) AS ipv4_col_list,
 collect_set(columnName) FILTER
           (WHERE columnName IN ('query', 'referrer')) AS fqdn_col_list
FROM allColumns
WHERE colType='string'
GROUP BY database, tableName
"""

display(spark.sql(metadata_sql_str))

For the second question, you can use the SQL builtin function regexp_extract_all() to extract indicators from columns using regular expressions. For example, the following SQL query,

SELECT regexp_extract_all('paste this https://d.test.com into the browser',
   '((?!-)[A-Za-z0-9-]{1,63}(?!-)\\.)+[A-Za-z]{2,6}', 0) AS extracted
UNION ALL
SELECT regexp_extract_all('ping 1.2.3.4 then ssh to 10.0.0.1 and type',
   '(\\d+\\.\\d+\\.\\d+\\.\\d+)', 0) AS extracted

will return the these results:

extracted
[“d.test.com”]
[“1.2.3.4”, “10.0.0.1”]

For the third question, let us consider the single table case and take the domain name system (DNS) table as an example. The DNS table contains DNS requests extracted from network packet capture files. For the DNS table, you would run the following query to perform the IOC matching against the indicators extracted from the relevant columns.

SELECT  /*+ BROADCAST(ioc) */  
  now() AS detection_ts, 
  'test01.dns' AS src, aug.raw, 
  ioc.ioc_value AS matched_ioc, 
  ioc.ioc_type
FROM
 (
 SELECT exp.raw, extracted_obs
 FROM
   (
   SELECT to_json(struct(d.*)) AS raw,
     concat(
       regexp_extract_all(d.query, '(\\d+\.\\d+\.\\d+\.\\d+)', 0),
       regexp_extract_all(d.id_orig_h, '(\\d+\.\\d+\.\\d+\.\\d+)', 0),
       regexp_extract_all(d.id_resp_h, '(\\d+\.\\d+\.\\d+\.\\d+)', 0),
       regexp_extract_all(d.query, '((?!-)[A-Za-z0-9-]{1,63}(?!-)\\.)+[A-Za-z]{2,6}', 0)
       ) AS extracted_obslist
   FROM test01.dns AS d
   )  AS exp LATERAL VIEW explode(exp.extracted_obslist) AS extracted_obs
 ) AS aug
 INNER JOIN test01.ioc AS ioc ON aug.extracted_obs=ioc.ioc_value

Note the optional optimizer directive “BROADCAST(ioc)”. That tells the Databricks query optimizer to pick a query execution plan that broadcasts the smaller “ioc” table containing the list of IOCs to all worker nodes processing the join operator. Note also that the regular expressions provided are simplified examples (consider using the regular expressions from msticpy for production). Now, you just need to use the above query as a template and generate the corresponding SQL query for all tables with relevant columns that might contain indicators. You can view the Python code for that in the provided notebook.

Note that the amount of time needed to run those IOC matching queries would depend on the volume of data and the compute resources available to the notebook: given the same volume of data, the more compute resources, the more parallel processing, the faster the processing time.

Databricks for the threat hunting scenario

What about the threat hunting scenario? In threat hunting, your security team would typically maintain a curated list of IOCs and perform periodic IOC matching against that list of IOCs.

A few words about maintaining a curated list of IOCs. Depending on the maturity of your organization’s cybersecurity practice, the curated list of IOCs may simply be a collection of malicious IP addresses, FQDNs, hashes etc. obtained from your organization’s threat intelligence subscription that is curated by the threat hunters for relevance to your organization or industry. In some organizations, threat hunters may play a more active role in finding IOCs for inclusion, testing the prevalence statistics of the IOCs to ensure the false positive rates are manageable, and expiring the IOCs when they are no longer relevant.

When performing IOC matching using the curated list of IOCs, you may choose to skip the schema discovery steps if the databases, tables and columns are well-known and slow changing. For efficiency, you also do not want to run the IOC matching operation from scratch each time, because most of the data would have been checked during the previous run. Databricks Delta Live Tables (DLT) provide a very convenient way of turning the IOC matching query into a pipeline that runs incrementally only on the updates to the underlying tables.

CREATE STREAMING LIVE TABLE iochits
AS
SELECT  now() AS detection_ts, 'test01.dns' AS src, aug.raw, ioc.ioc_value AS matched_ioc, ioc.ioc_type
FROM (
 SELECT exp.raw, extracted_obs
 FROM (
   SELECT to_json(struct(d.*)) AS raw,
     concat(
       regexp_extract_all(d.query, '(\\d+\\.\\d+\\.\\d+\\.\\d+)', 0),
       regexp_extract_all(d.id_orig_h, '(\\d+\\.\\d+\\.\\d+\\.\\d+)', 0),
       regexp_extract_all(d.id_resp_h, '(\\d+\\.\\d+\\.\\d+\\.\\d+)', 0),
       regexp_extract_all(d.query, '((?!-)[A-Za-z0-9-]{1,63}(?!-)\\.)+[A-Za-z]{2,6}', 0)) AS extracted_obslist
   FROM stream(test01.dns) AS d
   )  AS exp LATERAL VIEW explode(exp.extracted_obslist) AS extracted_obs
 ) AS aug INNER JOIN test01.ioc AS ioc ON aug.extracted_obs=ioc.ioc_value
UNION ALL
SELECT now() AS detection_ts,
  'test01.http' AS src,
  aug.raw,
  ioc.ioc_value AS matched_ioc,
  ioc.ioc_type
FROM (
 SELECT exp.raw, extracted_obs
 FROM (
   SELECT to_json(struct(d.*)) AS raw,
     concat(
       regexp_extract_all(d.origin, '(\\d+\\.\\d+\\.\\d+\\.\\d+)', 0),
       regexp_extract_all(d.referrer, '(\\d+\\.\\d+\\.\\d+\\.\\d+)', 0),
       regexp_extract_all(d.id_orig_h, '(\\d+\\.\\d+\\.\\d+\\.\\d+)', 0),
       regexp_extract_all(d.host, '(\\d+\\.\\d+\\.\\d+\\.\\d+)', 0),
       regexp_extract_all(d.id_resp_h, '(\\d+\\.\\d+\\.\\d+\\.\\d+)', 0),
       regexp_extract_all(d.referrer, '((?!-)[A-Za-z0-9-]{1,63}(?!-)\\.)+[A-Za-z]{2,6}', 0)) AS extracted_obslist
   FROM stream(test01.http) AS d
   )  AS exp LATERAL VIEW explode(exp.extracted_obslist) AS extracted_obs
 ) AS aug INNER JOIN test01.ioc AS ioc ON aug.extracted_obs=ioc.ioc_value;

In fact, you have full control over the degree of incremental processing: you can execute the incremental processing continuously or at scheduled intervals.

When you start executing a hunting query periodically or continuously, is that not in the realm of detection rather than hunting? Indeed it is a fine line to tread. Hunting queries tend to be fewer and lower in fidelity while detection rules are in the thousands and high false positive rates are simply not acceptable. The resulting processing characteristics are also different. The problem of scaling detection processing to thousands of detection rules on large volumes of log and telemetry data is actually quite amenable to parallelization since the detection rules are almost always independent. Both streaming and micro-batching approaches can be used to incrementally perform detection processing as new log and telemetry data arrives. Hunt queries tend to be few, but each query tries to cover a lot more data and hence requires more resources to process.

What about hunts and investigations that are more ad hoc in nature? Is there any way to make those queries work at interactive speeds? This is a common request from threat hunters especially for voluminous network log data such DNS data.

An elegant and effective way to do this is to maintain a highly-aggregated summary structure as a materialized view. For example, for DNS data, the summary structure will only hold DNS records aggregated using buckets for each unique value of (date, sourceTable, indicator_value, sourceIP, destinationIP). Threat hunters would first query this summary structure and then use the fields in the summary record to query the source table for details. The Databricks DLT feature again provides a convenient way to create pipelines for maintaining those summary structures and the following shows the SQL for the DNS summary table.

CREATE STREAMING LIVE TABLE ioc_summary_dns
AS
SELECT ts_day, obs_value, src_data, src_ip, dst_ip, count(*) AS cnt
FROM
 (
 SELECT 'test01.dns' AS src_data,
   extracted_obs AS obs_value,
   date_trunc('DAY',
   timestamp(exp.ts)) as ts_day,
   exp.id_orig_h as src_ip,
   exp.id_resp_h as dst_ip
 FROM
   (
   SELECT d.*,
     concat(
       regexp_extract_all(d.query, '(\\d+\\.\\d+\\.\\d+\\.\\d+)', 0),
       ARRAY(d.id_orig_h),
       ARRAY(d.id_resp_h),
       regexp_extract_all(d.query, '((?!-)[A-Za-z0-9-]{1,63}(?!-)\\.)+[A-Za-z]{2,6}', 0)
       ) AS extracted_obslist
   FROM stream(test01.dns) AS d
   )  AS exp LATERAL VIEW explode(exp.extracted_obslist) AS extracted_obs
 ) AS aug
GROUP BY ts_day, obs_value, src_data, src_ip, dst_ip;

You would create separate DLT pipelines for each source table and then create a view to union all the summary tables into one single view for querying as illustrated by the following SQL.

CREATE VIEW test01.ioc_summary_all
AS
SELECT * FROM test01.ioc_summary_dns
UNION ALL
SELECT * FROM test01.ioc_summary_http

How do the summary tables help?

Considering the DNS table, recall that the summary structure will only hold DNS records aggregated for each unique value of (date, sourceTable, indicator_value, sourceIP, destinationIP). Between the same source-destination IP pair, there may be thousands of DNS requests for the same FQDN in a day. In the aggregated summary table, there is just one record to represent the potentially hundreds to thousands of DNS requests for the same FQDN between the same source-destination address pair. Hence summary tables are a lossy compression of the original tables with a compression ratio of at least 10x. Querying the much smaller summary tables is therefore much more performant and interactive. Moreover the compressed nature of the summary structure means it can cover a much longer retention period compared to the original data. You do lose time resolution with the aggregation, but at least it gives you the much needed visibility during an investigation. Just think about how the summary structure would be able to tell you whether you were affected by the Sunburst threat even when the threat was discovered nine months after the first suspicious activity.

Conclusion

In this blog post, we have given you a glimpse of the lakehouse for cybersecurity that is open, low-cost and multi-cloud. Zooming in on the fundamental operation of IOC matching, we have given you a taste of how the Databricks Lakehouse platform enables it to be performed with ease and simplicity across all security relevant data ingested from your attack surface.

We invite you to

--

Try Databricks for free. Get started today.

The post Hunting for IOCs Without Knowing Table Names or Field Labels appeared first on Databricks.

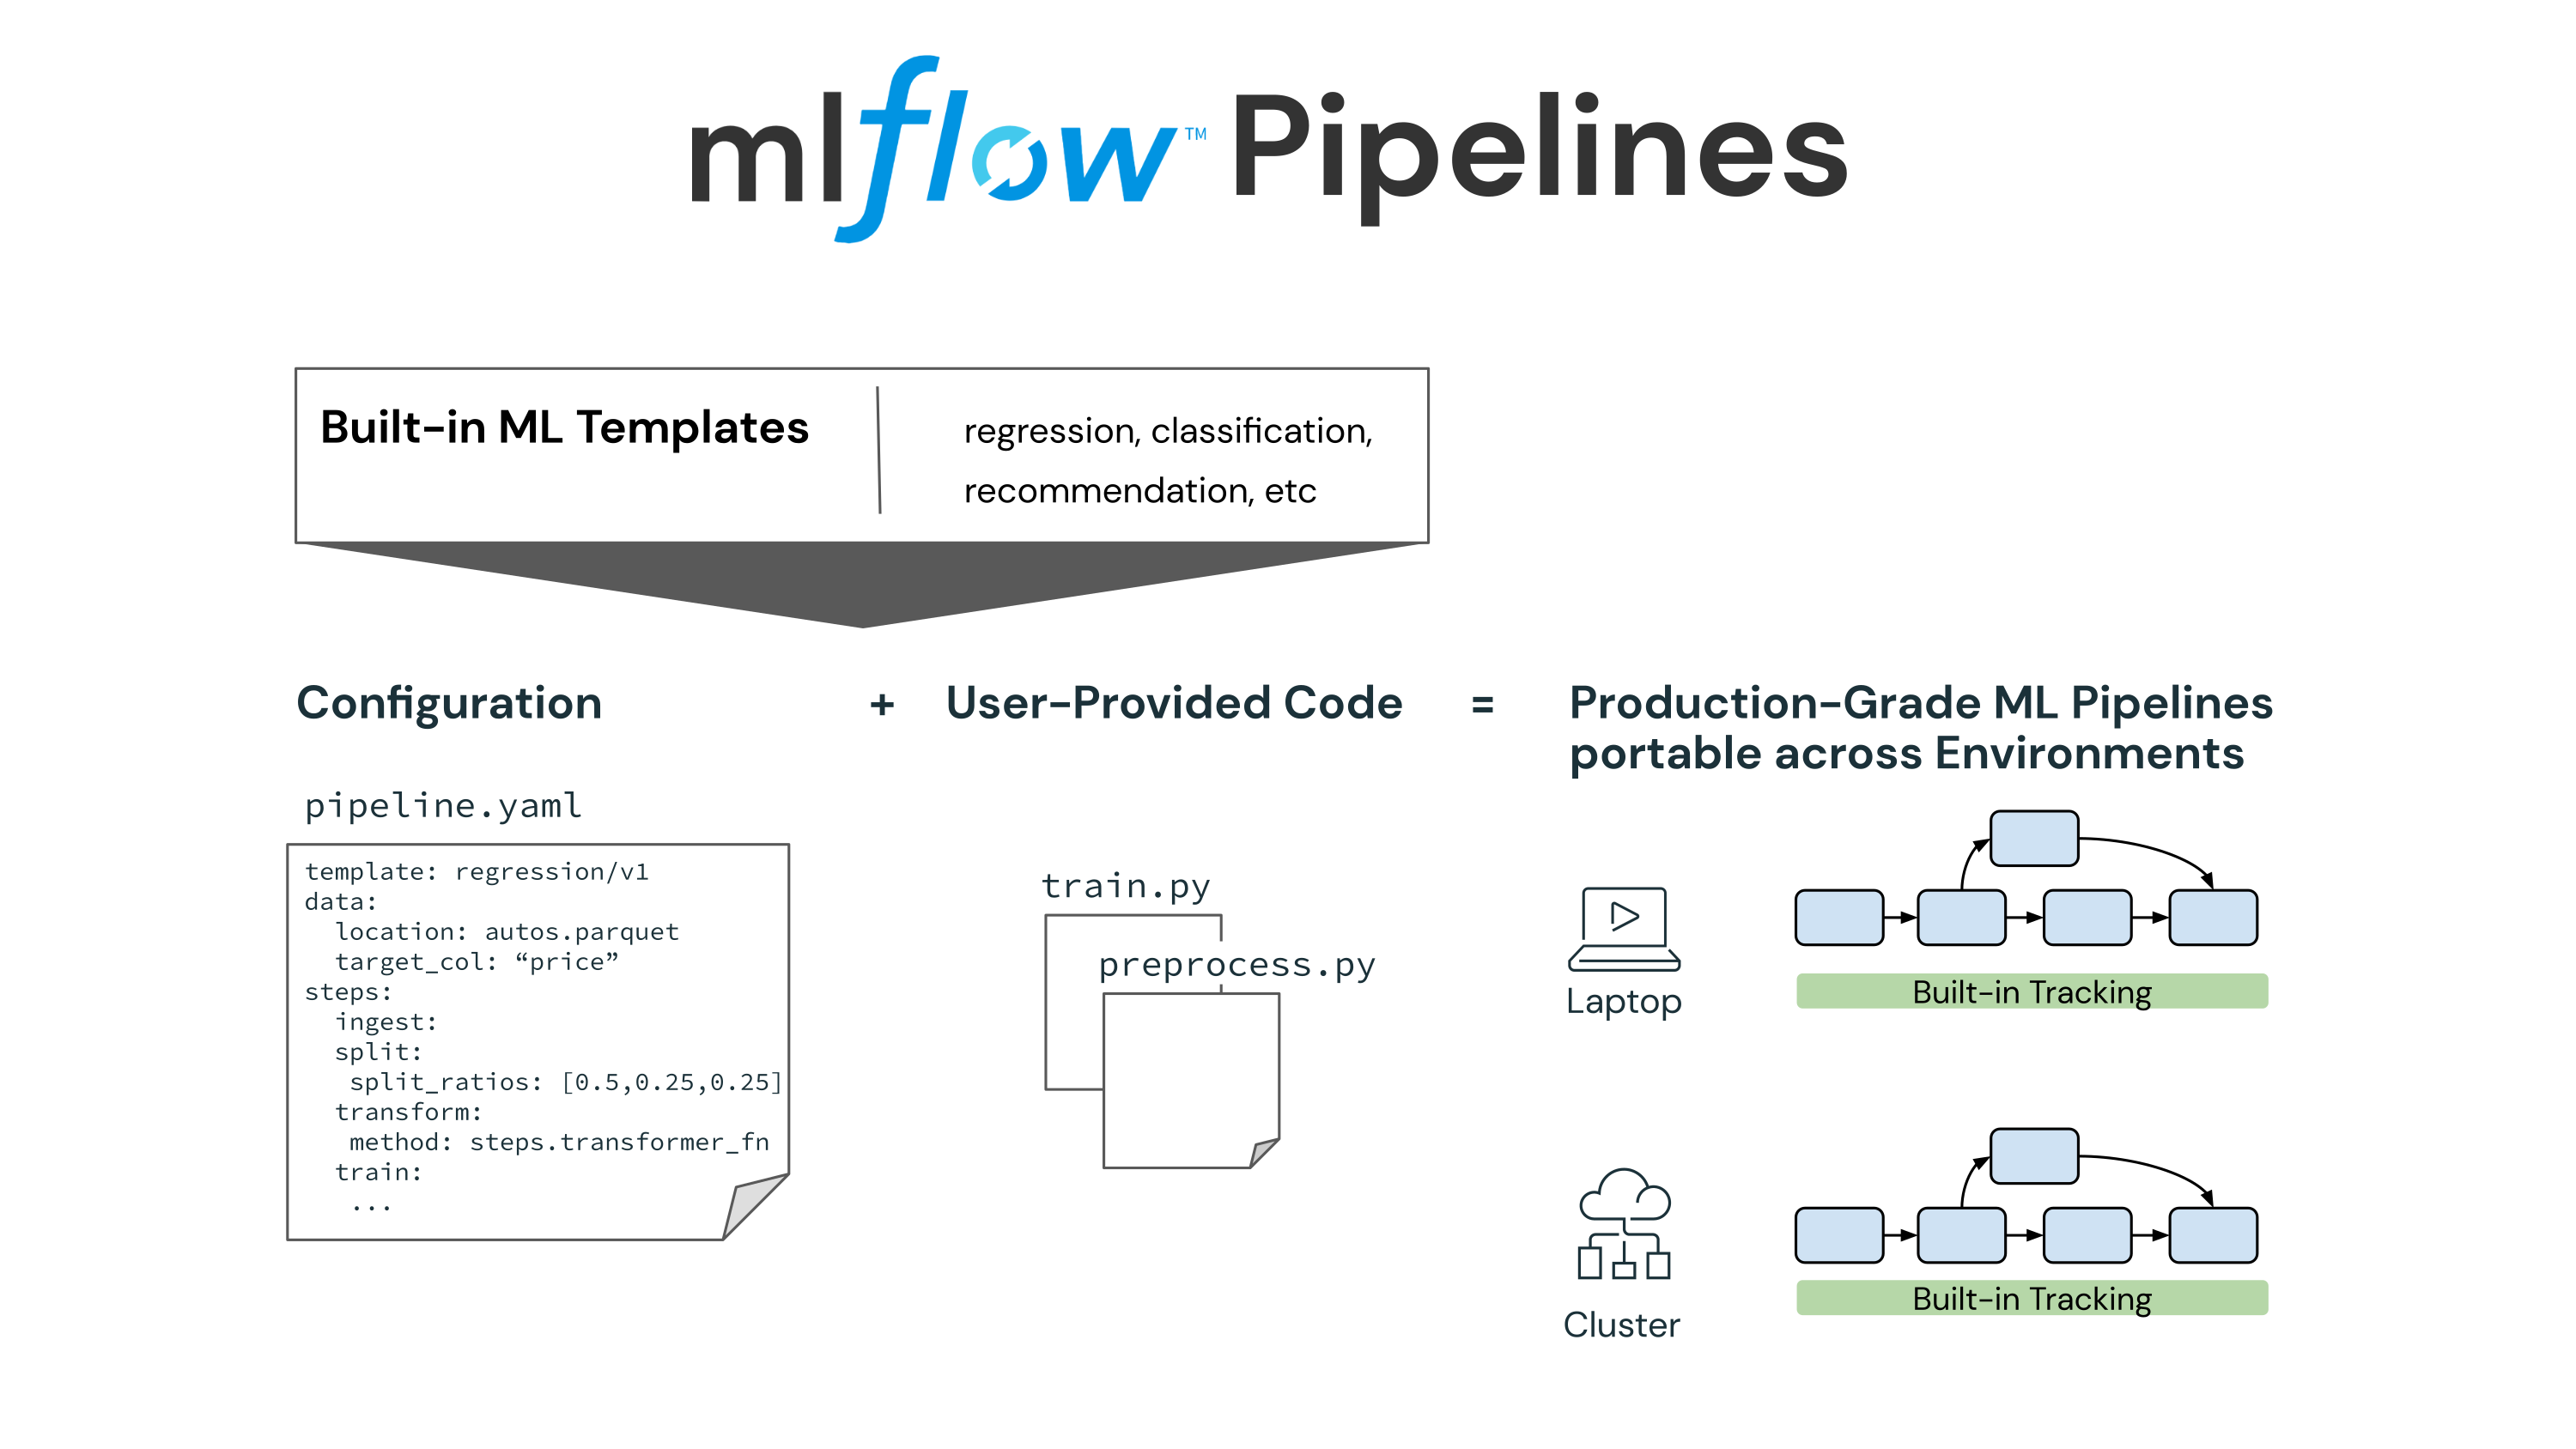
Disaster Recovery Automation and Tooling for a Databricks Workspace

$
0
0

This post is a continuation of the Disaster Recovery Overview, Strategies, and Assessment blog.


Introduction

A broad ecosystem of tooling exists to implement a Disaster Recovery (DR) solution. While no tool is perfect on its own, a mix of tools available in the market augmented with custom code will provide teams implementing DR the needed agility with minimal complexity.

Unlike backups or a one-time migration, a DR implementation is a moving target, and often, the needs of the supported workload can change both rapidly and frequently. Therefore, there is no out-of-the-box or one size fits all implementation. This blog provides an opinionated view on available tooling and automation best practices for DR solutions on Databricks workspaces. In it, we are targeting a general approach that will provide a foundational understanding for the core implementation of most DR solutions. We cannot consider every possible scenario here, and some engineering efforts on top of the provided recommendations will be required to form a comprehensive DR solution.

Available Tooling for a Databricks Workspace

A DR strategy and solution can be critical and also very complicated. A few complexities that exist in any automation solution that become critically important as part of DR are idempotent operations, managing infrastructure state, minimizing configuration drift, and required for DR is supporting automation at various levels of scope, for example, multi-AZ, multi-region, and multi-cloud.

Three main tools exist for automating the deployment of Databricks-native objects. Those are the Databricks REST APIs, Databricks CLI, and the Databricks Terraform Provider. We will consider each tool in turn to review its role in implementing a DR solution.

Regardless of the tools selected for implementation, any solution should be able to:

  • manage state while introducing minimal complexity,
  • perform idempotent, all-or-nothing changes, and
  • re-deploy in case of a misconfiguration.

Databricks REST API

There are several fundamental reasons why REST APIs are powerful automation tools. The adherence to the common HTTP standard and the REST architecture style allows a transparent, systematic approach to security, governance, monitoring, scale, and adoption. In addition, REST APIs rarely have third-party dependencies and generally include well-documented specifications. The Databricks REST API (AWS | Azure | GCP) has several powerful features that one can leverage as part of a DR solution, yet there are significant limitations to their use within the context of DR.

Benefits

Support for defining, exporting, and importing almost every Databricks object is available through REST APIs. Any new objects created within a workspace on an ad-hoc basis can be exported using the `GET` Statements API method. Conversely, JSON definitions of objects that are versioned and deployed as part of a CI/CD pipeline can be used to create those defined objects in many workspaces simultaneously using the `POST` Statements API method.

The combination of objects being defined with JSON, broad familiarity with HTTP, and REST makes this a low-effort workflow to implement.

Limitations

There is a tradeoff for the simplicity of using Databricks REST APIs for automating workspace changes. These APIs do not track state, are not idempotent, and are imperative, meaning the API calls must successfully execute in an exact order to achieve a desirable outcome. As a result, custom code, detailed logic, and manual management of dependencies are required to use the Databricks REST APIs within a DR solution to handle errors, payload validation, and integration.

JSON definitions and responses from `GET` statements should be versioned to track the overall state of the objects. `POST` statements should only use versioned definitions that are tagged for release to avoid configuration drift. A well-designed DR solution will have an automated process to version and tag object definitions, as well as ensure that only the correct release is applied to the target workspace.

REST APIs are not idempotent, so an additional process will need to exist to ensure idempotency for a DR solution. Without this in place, the solution may generate multiple instances of the same object that will require manual cleanup.

REST APIs are imperative and unaware of dependencies. When making API calls to replicate objects for a workload, each object will be necessary for the workload to successfully run, and the operation should either fully succeed or fail, which is not a native capability for REST APIs. This means that the developer will be responsible for handling error management, savepoints and checkpoints, and resolving dependencies between objects.

Despite these limitations of using a REST API for automation, the benefits are strong enough that virtually every Infrastructure as Code (IaC) tool builds on top of them.

Databricks CLI

The Databricks CLI ( AWS | Azure | GCP ) is a Python wrapper around the Databricks REST APIs. For this reason, the CLI enjoys the same benefits and disadvantages as the Databricks REST APIs for automation so will be covered briefly. However, the CLI introduces some additional advantages to using the REST APIs directly.

The CLI will handle authentication ( AWS | Azure | GCP ) for individual API calls on behalf of the user and can be configured to authenticate to multiple Databricks workspaces across multiple clouds via stored connection profiles ( AWS | Azure | GCP ). The CLI is easier to integrate with Bash and/or Python scripts than directly calling Databricks APIs.

For use in Bash scripts, the CLI will be available to use once installed, and the CLI can be treated as a temporary Python SDK, where the developer would import the `ApiClient` to handle authentication and then any required services to manage the API calls. An example of this is included below using the `ClusterService` to create a new cluster.

```python
from databricks_cli.sdk.api_client import ApiClient
from databricks_cli.clusters.api import ClusterApi

api_client = ApiClient(
    token = ,
    host = https://.cloud.databricks.com,
    command_name="disasterrecovery-cluster"
)

cluster_api = ClusterApi(api_client)

sample_cluster_config = {
    "num_workers": 0,
    "spark_version": "10.4.x-photon-scala2.12",
    "spark_conf": {
        "spark.master": "local[*, 4]",
        "spark.databricks.cluster.profile": "singleNode"
    },
    "aws_attributes": {
        "first_on_demand": 1,
        "availability": "SPOT_WITH_FALLBACK",
        "zone_id": "us-west-2c",
        "spot_bid_price_percent": 100,
        "ebs_volume_count": 0
    },
    "node_type_id": "i3.xlarge",
    "driver_node_type_id": "i3.xlarge",
    "ssh_public_keys": [],
    "custom_tags": {
        "ResourceClass": "SingleNode"
    },
    "spark_env_vars": {
        "PYSPARK_PYTHON": "/databricks/python3/bin/python3"
    },
    "autotermination_minutes": 20,
    "enable_elastic_disk": True,
    "init_scripts": [],
}

cluster_api.create_cluster(sample_cluster_config)
```

This snippet demonstrates how to create a single-node cluster using the Databricks CLI as a module. The temporary SDK and additional services can be found in the databricks-cli repository. The lack of idempotence present in both the REST APIs and CLI can be highlighted with the code snippet above. Running the code above will create a new cluster with the defined specifications each time it is executed; no validation is performed to verify if the cluster already exists before creating a new one.

Terraform

Infrastructure as Code (IaC) tools are quickly becoming the standard for managing infrastructure. These tools bundle vendor-provided and open-source APIs within a Software Development Kit (SDK) that includes additional tools to enable development, such as a CLI and validations, that allow infrastructure resources to be defined and managed in easy-to-understand, shareable, and reusable configuration files. Terraform in particular has significant popularity given its ease of use, robustness, and support for third-party services on multiple cloud providers.

Benefits

Similar to Databricks, Terraform is open-source and cloud-agnostic. As such, a DR solution built with Terraform can manage multi-cloud workloads. This simplifies the management and orchestration as the developers neither have to worry about individual tools and interfaces per cloud nor need to handle cross-cloud dependencies.

Since Terraform manages state, the file `terraform.tfstate` stores the state of infrastructure and configurations, including metadata and resource dependencies. This allows for idempotent and incremental operations through a comparison of the configuration files and the current snapshot of state in `terraform.tfstate`. Tracking state also permits Terraform to leverage declarative programming. HashiCorp Configuration Language (HCL), used in Terraform, only requires defining the target state and not the processes to achieve that state. This declarative approach makes managing infrastructure, state, and DR solutions significantly easier, as opposed to procedural programming:

  • When dealing with procedural code, the full history of changes is required to understand the state of the infrastructure.
  • The reusability of procedural code is inherently limited due to divergences in the state of the codebase and infrastructure. As a result, procedural infrastructure code tends to grow large and complex over time.

Limitations

Terraform requires some enablement to get started since it may not be readily familiar to developers like REST APIs or procedural CLI tools.

Access controls should be strictly defined and enforced within teams that have access to Terraform. Several commands, in particular `taint` and `import`, can seem innocuous but these commands allow developers to integrate their own changes into the state until such governance practices are enacted.

Terraform does not have a rollback feature. To do this, you have to revert to the previous version and then re-apply. Terraform deletes everything that is “extraneous” no matter how it was added.

Terraform Cloud and Terraform Enterprise

Given the benefits and the robust community that Terraform provides, it is ubiquitous in enterprise architectures. Hashicorp provides managed distributions of Terraform – Terraform Cloud and Terraform Enterprise. Terraform Cloud provides additional features that make it easier for teams to collaborate on Terraform together and Terraform Enterprise is a private instance of the Terraform Cloud offering advanced security and compliance features.

Deploying Infrastructure with Terraform

A Terraform deployment is a simple three-step process:

  1. Write infrastructure configuration as code using HCL and/or import existing infrastructure to be under Terraform management.
  2. Perform a dry run using `terraform plan` to preview the execution plan and continue to edit the configuration files as needed until the desired target state is produced.
  3. Run `terraform apply` to provision the infrastructure.

With Databricks, a Terraform deployment is a simple three-step process.

Databricks Terraform Provider

Databricks is a select partner of Hashicorp and officially supports the Databricks Terraform Provider with issue tracking through Github. Using the Databricks Terraform Provider helps standardize the deployment workflow for DR solutions and promotes a clear recovery pattern. The provider not only is capable of provisioning Databricks Objects, like Databricks REST APIs and the Databricks CLI, but can also provision a Databricks workspace, cloud infrastructure, and much more through the Terraform Providers available. Furthermore, the experimental exporter functionality should be used to capture the initial state of a Databricks workspace in HCL code while maintaining referential integrity. This significantly reduces the level of effort required to adopt IaC and Terraform.

Using the Databricks Terraform Provider helps standardize the deployment workflow for DR solutions and promotes a clear recovery pattern.

In conjunction with the Databricks Provider, Terraform is a single tool that can automate the creation and management of all the resources required for a DR solution of a Databricks workspace.

In conjunction with the Databricks Provider, Terraform is a single tool that can automate the creation and management of all the resources required for a DR solution of a Databricks workspace.

Automation Best Practices for Disaster Recovery

Terraform is the recommended approach for efficient Databricks deployments, managing cloud infrastructure as part of CI/CD pipelines, and automating the creation of Databricks Objects. These practices simplify implementing a DR solution at scale.

All infrastructure and Databricks objects within the scope of the DR solution should be defined as code. For any resource that is not already managed by TF, definite the resource as code is a one-time activity.

Workloads that are scheduled and/or automated should be prioritized for DR and should be brought under TF management. Ad-hoc work, for example, an analyst generating a report on production data, should be automated as much as possible with an optional, manual validation. For artifacts that cannot be automatically managed, i.e. some user interaction is required, strict governance with a defined process will ensure these are under the management of the DR solution. Adding tags when configuring compute, including Jobs ( AWS | Azure | GCP ), Clusters ( AWS | Azure | GCP ), and SQL Endpoints (AWS | Azure | GCP ), can facilitate the identification of objects which should be within scope for DR.

Infrastructure code should be separate from application code and exist in at least two exclusive repositories, one repository containing infrastructure modules that serve as blueprints and another repository for live infrastructure configurations. The separation simplifies testing module code and promotes immutable infrastructure versions using trunk-based development. Furthermore, state files must not be manually altered and be sufficiently secured to prevent any sensitive information from being leaked.

Critical infrastructure and objects that are in-scope for DR must be integrated into CI/CD pipelines. By adding Terraform into an existing workflow, developers can deploy infrastructure in the same pipeline although steps will differ due to the nature of infrastructure code.

  • Test: The only way to test modules is to deploy real infrastructure into a sandbox environment, allowing them to be inspected to verify deployed resources. A dry run is the only significant test that can be performed for live infrastructure code to check what changes it would make against the current, live environment.
  • Release: Modules should leverage a human-readable tag for release management; while, live code will generate no artifact. The main branch of the live infrastructure repo will represent in exactness what is deployed.
  • Deploy: The pipeline for deploying live infrastructure code will depend on `terraform apply` and which configurations were updated. Infrastructure deployments should be run on a dedicated, closed-off server so that CI/CD servers do not have permission to deploy infrastructure. Terraform Cloud and Terraform Enterprise offer such an environment as a managed service.

Unlike application code, infrastructure code workflows require a human-in-the-loop review for three reasons:

  • Building an automated test harness that elicits sufficient confidence in infrastructure code is difficult and expensive.
  • There is no concept of a rollback with infrastructure code. The environment would have to be destroyed and re-deployed from that last-known safe version.
  • Failures can be catastrophic, and the additional review can help catch problems before they’re applied.

The human-in-the-loop best practice is even more important within a DR solution than traditional IaC. A manual review should be required for any changes since a rollback to a known good state on the DR site may not be possible during a disaster event. Furthermore, an incident manager should own the decision to fail over to the DR site and fail back to the primary site. Processes should exist to ensure an accountable and responsible person are always available to trigger the DR solution if needed and that they’re able to consult with the appropriate, impacted business stakeholders.

A manual decision will avoid unnecessary failover. Short outages that either do not qualify as a Disaster Event or that the business may be able to withstand, may still trigger a failover if the decision is fully automated. Allowing this to be a business-driven decision, avoids the unnecessary risk of data corruption inherent to a failover/failback process and reduces cost in the effort of coordinating the failback. Finally, if this is a human decision, the business could assess the impact by allowing for changes on the fly. A few example scenarios where this could be important include deciding how quickly to failover for an e-commerce company near Christmas compared to a regular sales day, or a Financial Services company that must failover quicker because regulatory reporting deadlines are pending.

A monitoring service is a required component for every DR solution. Detection of failure must be fully automated, even though automation of the failover/failback decision is not recommended. Automated detection provides two key benefits. It can trigger alerts to notify the Incident Manager, or person responsible, and timely surface information required to assess the impact and make the failover decision. Likewise, after a failover, the monitoring service should also detect when services are back online and alert the required persons that the primary site has returned to a healthy state. Ideally, all service level indicators (SLIs), such as latency, throughput, availability, etc., which are monitored for health and used to calculate service level objectives (SLOs) should be available in a single pane.

Services with which the workload directly interfaces should be in-scope for monitoring. A high-level overview of services common in Lakehouse workloads can be found in part one of this series. However, it is not an exhaustive list. Databricks services to which a user can submit a request that should be monitored can be found on the company’s status page ( AWS | Azure | GCP ). In addition, services in your cloud account are required for appliances deployed by SaaS providers. In the instance of a Databricks deployment, this includes compute resources ( AWS | Azure | GCP ) to spin up Apache Spark™ clusters and object storage ( AWS | Azure | GCP ) that the Spark application can use for storing shuffle files.

A monitoring service is a required component for every DR solution.

Get Started:

Terraform Tutorials – HashiCorp Learn
Terraform Provider Documentation for Databricks on AWS
Azure Databricks Terraform Provider Documentation
Terraform Provider for Documentation Databricks on GCP

--

Try Databricks for free. Get started today.

The post Disaster Recovery Automation and Tooling for a Databricks Workspace appeared first on Databricks.

Scanning for Arbitrary Code in Databricks Workspace With Improved Search and Audit Logs

$
0
0

How can we tell whether our users are using a compromised library?
How do we know whether our users are using that API?

These are the types of questions we regularly receive from our customers.

Given the recent surge in reports of vulnerable libraries such as Python ctx and the PHPass hijack, it is understandable that customers need to be able to perform a time sensitive investigation as soon as these issues are disclosed. They need to be able to confirm whether they are using any of the vulnerable libraries and to check if any of the malicious indicators exist across their estate. Whenever a potential security incident like this comes up, the Databricks Incident Response team of course performs an investigation into our product and our internal systems, but it is the customer’s responsibility to ensure that they are not using the impacted libraries within their own codebase, either by referencing the affected version directly or by using libraries that transitively depend on it. In these types of scenarios, Databricks typically recommends that customers evaluate whether their code utilizes the impacted library in any way, now you can search your workspace for any string.

The goal of this blog is to inform you of a new and improved workspace search feature and audit log capabilities that you can use to scan notebooks, libraries, folders, files, and repos by name and also search for any arbitrary string within a notebook, such as the library used in the latest supply chain compromise. But you can also search for anything else! This new search feature will help you answer security questions about compromised libraries more quickly and easily, and get ahead of the attackers.

Background

To make our customer’s lives easier, Databricks automatically incorporates many commonly used libraries into the Databricks Runtime (DBR). To see which libraries are included, please refer to the System Environment subsection of the Databricks Runtime release notes for the relevant DBR version. Databricks is responsible for keeping these libraries up to date so that all our customers need to do is to regularly restart their clusters to take advantage of them. At Databricks, we take application security very seriously. Check out our Security and Trust Center for more information about this.

However, as a general purpose data analytics platform, Databricks enables customers to install whatever publicly or privately available Python, Java, Scala, or R libraries they need in order to fulfill their use case. Therefore, if one such library is compromised, our customers need to be able to look at their own codebase to validate whether there is any impact. Databricks recommends that customers evaluate whether their code utilizes potentially impacted libraries on a regular basis.

Searching for arbitrary code in Databricks Workspace


Figure 1: In this example “mlflow” (not a compromised library) is searched in notebooks, libraries, folders, files, and repos by name and also searches for content within a notebook and shows preview of the matching content.

We invite you to log in to your own Databricks account and try running some searches in your workspace using improved workspace search for yourself. Please See Search workspace for an object in our docs for more details.

To search the workspace for an object, click Search in the sidebar. The Search dialog appears.

New and improved workspace search

To search for a text string, type it into the search field and press Enter. The system searches the names of all notebooks, folders, files, libraries, and Repos in the workspace that you have access to, as an admin you should be able to search the objects in the workspace . It also searches notebook commands, but not text in non-notebook files.
You can also search for items by type (file, folder, notebooks, libraries, or repo). A text string is not required. When you press Enter, workspace objects that match the search criteria appear in the dialog. Click a name from the list to open that item in the workspace.


Figure 1: In this example “ctx” (a library known to be compromised) is searched in notebooks, libraries, folders, files, and repos by name and also searches for content within a notebook and showing preview of the matching content. We further filtered the results in Notebooks by a specific user to narrow the search

Note:
The search behavior described in this blog is not supported on workspaces that use customer-managed keys for encryption. In those workspaces, you can use this notebook utility to assist in scanning Databricks workspace for arbitrary strings. Please reach us if you need further assistance with the notebook.

Ongoing detection with verbose audit logging

Security investigations into zero day exploits are rarely straightforward – sometimes they can run on for several months. During this time, security teams may want to couple point-in-time searches with ongoing monitoring and alerting, to ensure that a vulnerable library isn’t imported the day after they’ve confirmed it doesn’t feature in their code.

Databricks customers can now leverage verbose audit logging of all notebook commands ran during interactive development (see the docs for AWS, Azure) and if they have set up audit log delivery and processing in the way described by our recent blog on this topic, they could use a Databricks SQL query like the below to search notebook commands for strings like “import ctx”:

SELECT
  timestamp,  
  workspaceId,
  sourceIPAddress,
  email,
  requestParams.commandText,
  requestParams.status,
  requestParams.executionTime,
  requestParams.notebookId,
  result,
  errorMessage
FROM
  audit_logs.gold_workspace_notebook
 WHERE actionName = "runCommand"
 AND contains(requestParams.commandText, {{query_string}})
 ORDER BY timestamp DESC

But that’s still ad hoc querying right? True, but with some simple modifications, this query could easily be converted into a Databricks SQL alert which is scheduled to run at regular intervals and send an email notification if a specific library has been used more than once (count of events is > 0) in the last day:

SELECT
  date,  
  workspaceId,
  sourceIPAddress,
  email,
  requestParams.commandText,
  count(*) AS total
FROM
  audit_logs.gold_workspace_notebook
 WHERE actionName = "runCommand"
 AND contains(requestParams.commandText, "import ctx")
 AND date > current_date - 1
 GROUP BY 1, 2, 3, 4, 5
 ORDER BY date DESC

This could be coupled with a custom alert template like the following to give security teams enough information to investigate whether the acceptable use policy has been violated:

Alert "{{ALERT_NAME}}" changed status to {{ALERT_STATUS}}

There have been the following unexpected events in the last day:

{{QUERY_RESULT_ROWS}}

Check out our documentation for instructions on how to configure alerts (AWS, Azure), as well as for adding additional alert destinations like Slack or PagerDuty (AWS, Azure).

Conclusion

In this blog post you learned how easy it is to search using improved search for arbitrary code in a Databricks Workspaces and also leverage audit logs for monitoring and alerting for vulnerable libraries. You also saw an example of how to hunt for signs of a compromised library. Stay tuned for more search capabilities in months to come.

We look forward to your questions and suggestions. You can reach us at: cybersecurity@databricks.com. Also if you are curious about how Databricks approaches security, please review our Security & Trust Center.

--

Try Databricks for free. Get started today.

The post Scanning for Arbitrary Code in Databricks Workspace With Improved Search and Audit Logs appeared first on Databricks.

Building a Cybersecurity Lakehouse for CrowdStrike Falcon Events Part II

$
0
0

Visibility is critical when it comes to cyber defense – you can’t defend what you can’t see. In the context of a modern enterprise environment, visibility refers to the ability to monitor and account for all endpoint devices, network communications, and key assets. Event logs allow security teams to build a baseline of normal, expected behavior and to build rules that identify an anomalous activity. That is, of course, assuming these logs are collected and searchable in the first place. This important piece is often overlooked. Fortunately, with the power of the Databricks Lakehouse Platform, it is easy to build a scalable, robust, and cost-effective cybersecurity analytics program.

In Part I of this series, we went through the process of setting up a Cybersecurity Lakehouse that allowed us to collect and operationalize CrowdStrike Falcon log data. In this blog post (Part II), we will explore specific use cases, including data exploration, automated enrichment, and analytic development. At the end of this blog you will be equipped with some sample notebooks that will provide you with general guidance and examples to help kickstart your threat detection and investigation program.

The data that we will be investigating is a set of CrowdStrike Falcon logs consisting of production data collected from enterprise network endpoints. Due to the sensitive nature of this information, certain details have been masked to preserve the security and confidentiality of the data. This data was collected continuously over the period of several weeks and is reflective of typical workday usage patterns.

Why Databricks for CrowdStrike Data?

With Databricks we can easily ingest, curate, and analyze CrowdStrike logs at scale. And with Databricks’ robust integrations framework, we can further enrich these logs with context from additional sources, transforming raw data into more meaningful insights. Enrichment allows us to more easily correlate security events, prioritize incidents, reduce false positive rates, and anticipate future security threats.

Another benefit of leveraging Databricks for CrowdStrike logs is that it supports historical analysis at scale. Traditionally, structuring, managing, and maintaining log data has been an inefficient and costly process. With the inexpensive object storage and open format model of the Databricks Lakehouse architecture, organizations have the ability to retain these datasets for much longer periods of time. Access to highly-enriched historical security data allows organizations to assess their security posture over time, build enhanced detection and response capabilities, and perform more proficient threat hunt operations. In addition, the Databricks platform is equipped with advanced out-of-the-box tools that help to build an advanced security lakehouse in a cost-effective and efficient way.

Methodology

Data collection and ingestion is just the beginning in our quest to build out an effective cybersecurity analytics platform. Once we have the data, our next step is to explore the data in order to uncover patterns, characteristics, and other items of interest. This process, commonly referred to as User and Entity Behavior Analytics (UEBA), involves monitoring the behavior of human users and entities within an organization.

We begin by performing some basic exploratory data analysis in order to identify key variables and relationships. CrowdStrike captures hundreds of event types across endpoints. We classified these events into the following types of activity:

  1. User Activity
  2. Network Activity
  3. Endpoint Information & Activity (including file activity and process management)

We assigned each activity a set of corresponding Event Types. Here is our sampling of the mapping:

Activity Event Type Event Content
User Activity Useridentity identity events, including system identities, of processes running on a device.
userlogon user logins – from which device, what time, IP information, etc. We’ll use this information later to show how to detect suspicious logins.
Network Activity NetworkListenIP4 & NetworkListenIP6 listen ports on the device with the CrowdStrike agent installed. Execution of some software that accepts incoming connections could increase the attack surface.
NetworkConnectIP4 & NetworkConnectIP6 Connections from a device to a remote endpoint – local & remote IP addresses, ports & protocols. We can use this information to match connections against known IoCs.
Endpoint Activity Fileopeninfo Opened files and the process that opened the file
hostinfo Specific host information about the endpoint Falcon is running on
Processrollup2 Process details that are running or have finished running on a host and contains.

Data Normalization and Enrichment

Before we dive into building analytics we first need to perform some preliminary normalization and enrichment. In this case, normalization refers to the reorganization of the data to limit redundancy, format data entries, and improve the overall cohesion of the entry types. This is an important step – proper data cleansing and normalization leads to more efficient use of the data. For example, we will want to have correct data types to perform range queries and comparisons on timestamps, ports, and other objects.

CrowdStrike Falcon logs are json format. Furthermore, there is variance among the timestamp encodings; some are encoded as long and some as double. There are also more than 300 different event types, each with different schemas and fields . In order to easily manage the normalization process we have coded a simple profiler that identifies the data types and programmatically generates the code that performs normalization of non-string fields.

Another big advantage of leveraging Databricks in this context is that we can easily enrich data with information from external and internal sources. For this analysis, we included geographic and network location information using MaxMind’s GeoIP and Autonomous System (AS) databases. This could be further expanded to include data from other sources as well. Similarly, we added user-defined functions to calculate network Community IDs that allowed us to correlate data between multiple tables as well as identify “stable” network communication patterns (meaning that the same device regularly reached the same network endpoints).

Example of networking and geo information extracted from IP addresses of devices where CrowdStrike agent was running.

Geographic enrichment gives us visibility into which geographic locations people are logging in from. We also have the added capability of selecting different levels of granularity (e.g. country vs city):

select aip_geo.country_code as country, count(1) as cnt
from crowdstrike_enriched.userlogon
where to_date(timestamp) = current_date()
group by aip_geo.country_code

Example of current user logs on by Country

In this example we’ve used the third-party library Plotly to look at the data with a finer granularity:

Example of current user logs on by city

Data Layout

CrowdStrike Falcon logs can grow easily to petabytes, having a proper data layout and data compaction is critical to get faster query response time. On databricks we can enable optimizeWrite to automatically compact the parquet files created in delta tables.

Delta tables can be optimized further with Data Skipping and Z-Order. Data Skipping relies on having correct data types, like, int and timestamps, and allows significantly decrease data read time. Optimize with Z-Order to improve the data layout that will further help to skip scanning and reading data which are not relevant for the query we are running.

Building A Baseline

Once we have identified our data of interest, the next step is to build a data baseline to serve as the comparison benchmarks. We can easily generate a data profile directly within our notebook using the Databricks summarize command:

Databricks notebook summary UI

This summary includes several useful statistics and the value distributions for each attribute. In the above example, we’ve generated the summary statistics for processrollup2.
We’re also interested in learning about the most frequently used remote ports (outside of “standard” ports such as HTTPS). This is a simple query:

select *
from NetworkConnectIP4 
where RemoteAddressIP4_is_global = true and RemotePort not in (443, 80, 53, 22, 43)

The result of the above query can be visualized on Databricks notebook like this.

Remote Ports used across the organization

Getting Insights From Enriched Data

With our data ingestion and enrichment pipeline in place, what’s next? We have a lot of options depending upon our objective, ranging from attack pattern analysis, predictive analytics, threat detection, system monitoring, risk scoring, and analyzing various security events. Here below we will show some examples of cybersecurity analytics.

Before we start, we need to understand how we can link different events together. For example most event types have a sensor id(aid) that identifies installed agents at endpoints, and ContextProcessId that is a reference to the TargetProcessId column in the ProcessRollup2 table.

1. Finding nodes that have potentially vulnerable services running

Services that implement vulnerable versions of Microsoft Remote Desktop Protocol (RDP), Citrix services, and NetBios are often targeted by attackers looking to gain access to an endpoint. There are dozens of documented viruses that exploit NetBios processes running on port 445. Similarly, an open RDP port 3389 may lead to denial of service attacks.

The CrowdStrike Falcon agent logs information about processes that are listening on ports as NetworkListenIP4 and NetworkListenIP6 events. We can use this information to identify processes that are listening on ports traditionally attributed to potentially vulnerable services. Let us first examine the number of events that are attributed to these specific ports per day in the last 30 days with the following query:

with all_data as (
  (select LocalPort, to_date(timestamp) as date, aip_is_global from NetworkListenIP4)
   union all
  (select LocalPort, to_date(timestamp) as date, aip_is_global from NetworkListenIP6)
)
select date, LocalPort, count(1) as count from all_data
   where LocalPort in (3389, 139, 445, 135, 593) -- RDP, Netbios,
   and aip_is_global = true and date > current_date() - 30
   group by LocalPort, date
   order by date asc

As we can see on the graph, the majority of listen events are attributed to the NetBios (although we do have a chunk of RDP-related events):

Count the number of processes that were listening on vulnerable ports in the last 30 days

At this point we can examine more detailed data about the processes that were listening on these ports by joining with the processrollup2 table. We can leverage the TargetProcessId field to link an activity to an endpoint process and use the process ID to link with other events. Ultimately, we can build a hierarchy of processes by joining on the ParentProcessId column.

with all_data as (
  (select LocalPort, timestamp, ContextProcessId, aip_is_global from NetworkListenIP4)
	union all
  (select LocalPort, timestamp, ContextProcessId, aip_is_global from NetworkListenIP6)
)
select d.LocalPort, pr.CommandLine, aid, aip_as
   from all_data d join processrollup2 pr on d.ContextProcessId = pr.TargetProcessId
   where LocalPort in (3389, 139, 445, 593, 135) -- RDP, Netbios & Windows RPC
   and d.aip_is_global = true and to_date(d.timestamp) > current_date() - 30
   order by d.timestamp desc

Processes listening on vulnerable ports

2. Information about executed applications

Information about program execution is logged as processrollup2 events. These events contain detailed execution profiles, including the absolute path to the program executable, command-line arguments, execution start time, the SHA256 of the application binary, platform architecture, etc. We’ll start with a simple query that counts the number of application executions per specific platform:

select event_platform, count(1) as count from processrollup2
   group by event_platform order by count desc

Number of process-related events by OS

Some platform types include additional data about the application type (e.g.is it a console application or a GUI application, etc). Let’s examine the application types that we see used on MS Windows:

select case ImageSubsystem
 when 1 then 'Native'
 when 2 then 'Windows GUI'
 when 3 then 'Windows Console'
 when 7 then 'Posix Console' 
 when 256 then 'WSL'
 else 'Unknown' end as AppType,
 count(1) as count
from processrollup2 where event_platform = 'Win'
group by ImageSubsystem order by count desc

As expected, the majority of executions are GUI applications:

Types of applications executed on the endpoints with MS Windows.

We can dig even deeper into a specific category. Let’s identify the most popular console applications on Windows:

select regexp_extract(ImageFileName, "^.*\\\\([^\\\\]+$)", 1) as FileName, count(1) as count
from Processrollup2 
where event_platform = 'Win' and ImageSubsystem = 3
group by FileName 
order by count desc

Most popular Window console programs executed on the endpoints.

3. How are users logging into Windows?

There are multiple ways to login into a Windows workstation – interactive, remote interactive (via RDP), etc. Each logon event logged by the CrowdStrike Falcon has a numeric LogonType flag that contains a value as described in Microsoft’s documentation. Let’s examine the logon types and their frequency:

select case LogonType
  when 0 then 'System'
  when 2 then 'Interactive'
  when 3 then 'Network'
  when 4 then 'Batch'
  when 5 then 'Service' 
  when 7 then 'Unlock' 
  when 8 then 'NetworkCleartext'
  when 9 then 'NewCredentials' 
  when 10 then 'RemoteInteractive'
  when 11 then 'CachedInteractive'
  else concat('Unknown: ', LogonType) end as LogonTypeName, count(1) as count
from userlogon 
where event_platform  = 'Win'
group by LogonType 
sort by count desc

Logon types counts

Now let’s look into more detail – which users are logging in via RDP, via Network, or as System users? We’ll start with System users – let’s see what processes are associated with these logon events:

select ul.UserSid, LogonTime, pr.CommandLine, ul.aid, ul.aip_as
from userlogon ul 
join processrollup2 pr on ul.ContextProcessId = pr.TargetProcessId
where LogonType = 0
order by LogonTime desc

Processes running as system users.

Similarly, we can look into users who are logging in via network:

select ul.UserSid, LogonTime, pr.CommandLine, ul.aid, ul.aip_as
from userlogon ul 
join processrollup2 pr on ul.ContextProcessId = pr.TargetProcessId
where LogonType = 3 
order by LogonTime desc

Processes that were executed with login over the network.

4. Matching connection data against known Indicators of Compromise(IoCs)

Information extracted by previous queries is interesting, but we are really interested to see if any of our endpoints were resolving names of any known Command & Control (C2) servers. The information about such servers could be obtained from different sources, like Alien Labs® Open Threat Exchange® (OTX™), or ThreatFox. For this example we’re using data from the specific threat feed – data is exported as CSV, and imported into Delta Lake. This dataset contains multiple types of entries, like, ‘hostname’ to specify exact host name, or ‘domain’ for any hostname under a registered domain, and we can use that information against the table that tracks DNS requests (the DnsRequest event type). The query is relatively simple, we just need to use different columns for different types of entries:

  • IoC entries of type ‘hostname’ should be matched against the DomainName column of the DNS requests table.
  • IoC entries of type ‘domain’ should be matched against the ‘DomainName_psl.registered_domain’ column that was added by the enrichment that uses Public Suffix List to extract the registered domains.

And when we find any match against the IoCs, we extract the information about the client machine (aid, aip, …) and the process that made that DNS request (CommandLine, ProcessStartTime, …)

with domain_matches as (
   select DomainName, aid, aip, ContextProcessId, aip_geo, aip_as
	from dnsrequest d join c2_servers c on d.DomainName = c.indicator
	where c.indicator_type = 'hostname'
   union all
   select DomainName, aid, aip, ContextProcessId, aip_geo, aip_as
	from dnsrequest d 
   join c2_servers c on d.DomainName_psl.registered_domain = c.indicator
   where c.indicator_type = 'domain'
)

select dm.DomainName, dm.aid, pr.CommandLine, pr.ProcessStartTime, dm.aip, dm.ContextProcessId, dm.aip_geo, dm.aip_as
from domain_matches dm
join processrollup2 pr on dm.ContextProcessId = pr.TargetProcessId

We don’t have any screenshots to show here because we don’t have any match 🙂

What’s Next?

In this blog we demonstrated how you can leverage the Databricks Lakehouse Platform to build scalable, robust, and cost-effective cybersecurity analytics. We demonstrated the enrichment of CrowdStrike Falcon log data and provided examples of how the resulting data can be used as part of a threat detection and investigation process.

In the following blog in this series we will deep-dive into the creation of actionable threat intelligence to manage vulnerabilities and provide faster, near-real-time incident response using CrowdStrike Falcon Data. Stay tuned!

We have also provided some sample notebooks [1] [2] that you can import into your own Databricks workspace. Each section of the notebooks has a detailed description of the code and functionality. We invite you to email us at cybersecurity@databricks.com. We look forward to your questions and suggestions for making this notebook easier to understand and deploy.

If you are New to Databricks, please refer to this documentation for detailed instructions on how to use Databricks notebooks.

--

Try Databricks for free. Get started today.

The post Building a Cybersecurity Lakehouse for CrowdStrike Falcon Events Part II appeared first on Databricks.

Sync Your Customer Data to the Databricks Lakehouse Platform With RudderStack

$
0
0

Collecting, storing, and processing customer event data involves unique technical challenges. It’s high volume, noisy, and it constantly changes. In the past, these challenges led many companies to rely on third-party black-box SaaS solutions for managing their customer data. But this approach taught many companies a hard lesson: black boxes create more problems than they solve including data silos, rigid data models, and lack of integration to the additional tooling needed for analytics. The good news is that the pain from black box solutions ushered in today’s engineering-driven era where companies prioritize centralizing data in a single, open storage layer at the center of their data stack.

Because of the characteristics of customer data mentioned above, the flexibility of the data lakehouse makes it an ideal architecture for centralizing customer data. It brings the critical data management features of a data warehouse together with the openness and scalability of a data lake, making it an ideal storage and processing layer for your customer data stack. You can read more on how the data lakehouse enhances the customer data stack here.

Why use Delta Lake as the foundation of your lakehouse

Delta Lake is an open source project that serves as the foundation of a cost-effective, highly scalable lakehouse architecture. It’s built on top of your existing data lake–whether that be Amazon S3, Google Cloud Storage, or Azure Blob Storage. This secure data storage and management layer for your data lake supports ACID transactions and schema enforcement, delivering reliability to data. Delta Lake eliminates data silos by providing a single home for all data types, making analytics simple and accessible across the enterprise and data lifecycle.

What you can do with customer data in the lakehouse

With RudderStack moving data into and out of your lakehouse, and Delta Lake serving as your centralized storage and processing layer, what you can do with your customer data is essentially limitless.

  • Store everything – store your structured, semi-structured, and unstructured data all in one place
  • Scale efficiently – with the inexpensive storage afforded by a cloud data lake and the power of Apache Spark, your ability to scale is essentially infinite
  • Meet regulatory needsdata privacy features from RudderStack and fine-grained access controls from Databricks allow you to build your customer data infrastructure with privacy in mind from end-to-end
  • Drive deeper insightsDatabricks SQL enables analysts and data scientists to reliably perform SQL queries and BI directly on the freshest and most complete data
  • Get more predictive – Databricks provides all the tools necessary to do ML/AI on your data to enable new use cases and predict customer behavior
  • Activate data with Reverse ETL – with RudderStack Reverse ETL, you can sync data from your lakehouse to your operational tools, so every team can act on insights
Rudderstack simplifying ingest of event data into the Databricks Lakehouse and activating insights with Reverse ETL

Rudderstack simplifying ingest of event data into the Databricks Lakehouse and activating insights with Reverse ETL

How to get your event data into Databricks lakehouse

How do you take unstructured events and deliver them in the right format, like Delta, in your data lakehouse? You could build a connector or use RudderStack’s Databricks Integration to save you the trouble. RudderStack’s integration takes care of all the complex integration work:

Converting your events
RudderStack builds size/time-bound batches of events converted from JSON to columnar format, according to our predefined schema, as they come in. These staging files are delivered to user-defined object storage.

Creating and delivering load files
Once the staging files are delivered, RudderStack regroups them by event name and loads them into their respective tables at a user chosen frequency–from every 30 minutes up to 24 hours. These “load files” are delivered to the same user-defined object storage.

Loading data to Delta Lake
Once the load files are ready, our Databricks integration loads the data from the generated files into Delta Lake.

Handling schema changes
RudderStack handles schema changes automatically, such as the creation of required tables or the addition of columns. While RudderStack does this for ease of use, it does honor user set schemas when loading the data. In the case of data type mismatches, the data would still be delivered for the user to backfill after a cleanup activity.

Getting started with RudderStack and Databricks

If you want to get value out of the customer event data in your data lakehouse more easily, and you don’t want to worry about building event ingestion infrastructure, you can sign up for RudderStack to test drive the Databricks integration today. Simply set up your data sources, configure Delta Lake as a destination, and start sending data.

Setting up the integration is straightforward and follows a few key steps:

  1. Obtain the necessary config requirements from the Databricks portal
  2. Provide RudderStack & Databricks access to your Staging Bucket
  3. Set up your data sources & Delta Lake destination in RudderStack
Rudderstack : Getting event data into the Databricks Lakehouse

Rudderstack : Getting event data into the Databricks Lakehouse

Refer to RudderStack’s documentation for a detailed step-by-step guide on sending event data from RudderStack to Delta Lake.

--

Try Databricks for free. Get started today.

The post Sync Your Customer Data to the Databricks Lakehouse Platform With RudderStack appeared first on Databricks.


Databricks SQL Highlights From Data & AI Summit

$
0
0

Data warehouses are not keeping up with today’s world: the explosion of languages other than SQL, unstructured data, machine learning, IoT and streaming analytics have forced customers to adopt a bifurcated architecture: data warehouses for BI and data lakes for ML. While SQL is ubiquitous and known by millions of professionals, it has never been treated as a first-class citizen on the data lake – until the rise of the data lakehouse.

As customers adopt the lakehouse architecture, Databricks SQL (DBSQL) provides data warehousing capabilities and first-class support for SQL on the Databricks Lakehouse Platform – and brings together the best of data lakes and data warehouses. Thousands of customers worldwide have already adopted DBSQL, and at the Data + AI Summit, we announced a number of innovations for data transformation & ingest, connectivity, and classic data warehousing to continue to redefine analytics on the lakehouse. Read on for the highlights.

Instant on, serverless compute for Databricks SQL

First, we announced the availability of serverless compute for Databricks SQL (DBSQL) in Public Preview on AWS! Now you can enable every analyst and analytics engineer to ingest, transform, and query the most complete and freshest data without having to worry about the underlying infrastructure.

Ingest, transform, and query the most complete and freshest data using standard SQL with instant, elastic serverless compute - decoupled from storage

Ingest, transform, and query the most complete and freshest data using standard SQL with instant, elastic serverless compute – decoupled from storage

Open sourcing Go, Node.js, Python and CLI connectors to Databricks SQL

Many customers use Databricks SQL to build custom data applications powered by the lakehouse. So we announced a full lineup of open source connectors for Go, Node.js, Python, as well as a new CLI to make it simpler for developers to connect to Databricks SQL from any application. Contact us on GitHub and the Databricks Community for any feedback and let us know what’s next to build!

Databricks SQL connectors: connect from anywhere and build data apps powered by your lakehouse

Databricks SQL connectors: connect from anywhere and build data apps powered by your lakehouse

Python UDFs

Bringing together data scientists and data analysts like never before, Python UDFs deliver the power of Python right into your favorite SQL environment! Now analysts can tap into python functions – from complex transformation logic to machine learning models – that data scientists have already developed and seamlessly use them in their SQL statements directly in Databricks SQL. Python UDFs are now in private preview – stay tuned for more updates to come.

CREATE FUNCTION redact(a STRING)
RETURNS STRING
LANGUAGE PYTHON
AS $$
import json
keys = ["email", "phone"]
obj = json.loads(a)
for k in obj:
   if k in keys:
       obj[k] = "REDACTED"
return json.dumps(obj)
$$;

Query Federation

The lakehouse is home to all data sources. Query federation allows analysts to directly query data stored outside of the lakehouse without without the need to first extract and load the data from the source systems. Of course, it’s possible to combine data sources like PostgreSQL and delta transparently in the same query.


CREATE EXTERNAL TABLE
taxi_trips.taxi_transactions 
USING postgresql OPTIONS
(
  dbtable ‘taxi_trips’,
  host secret(“postgresdb”,”host”),
  port ‘5432’,
  database secret(“postgresdb”,”db”),
  user secret(postgresdb”,”username”),
  password secret(“postgresdb”,”password”)
);

Materialized views

Materialized Views (MVs) accelerate end-user queries and reduce infrastructure costs with efficient, incremental computation. Built on top of Delta Live Tables (DLT), MVs reduce query latency by pre-computing otherwise slow queries and frequently used computations.

Speed up queries with pre-computed results

Speed up queries with pre-computed results

Data Modeling with Constraints

Everyone’s favorite data warehouse constraints are coming to the lakehouse! Primary Key & Foreign Key Constraints provides analysts with a familiar toolkit for advanced data modeling on the lakehouse. DBSQL & BI tools can then leverage this metadata for improved query planning.

  • Primary and foreign key constraints clearly explain the relationships between tables
  • IDENTITY columns automatically generate unique integer values as new rows are added
  • Enforced CHECK constraints to stop worrying about data quality and correctness issues
Understand the relationships between tables with primary and foreign key constraints

Understand the relationships between tables with primary and foreign key constraints

Next Steps

Join the conversation in the Databricks Community where data-obsessed peers are chatting about Data + AI Summit 2022 announcements and updates, and visit https://dbricks.co/dbsql to get started today !

Below is a selection of related sessions from the Data+AI Summit 2022 to watch on-demand:

Learn More

--

Try Databricks for free. Get started today.

The post Databricks SQL Highlights From Data & AI Summit appeared first on Databricks.
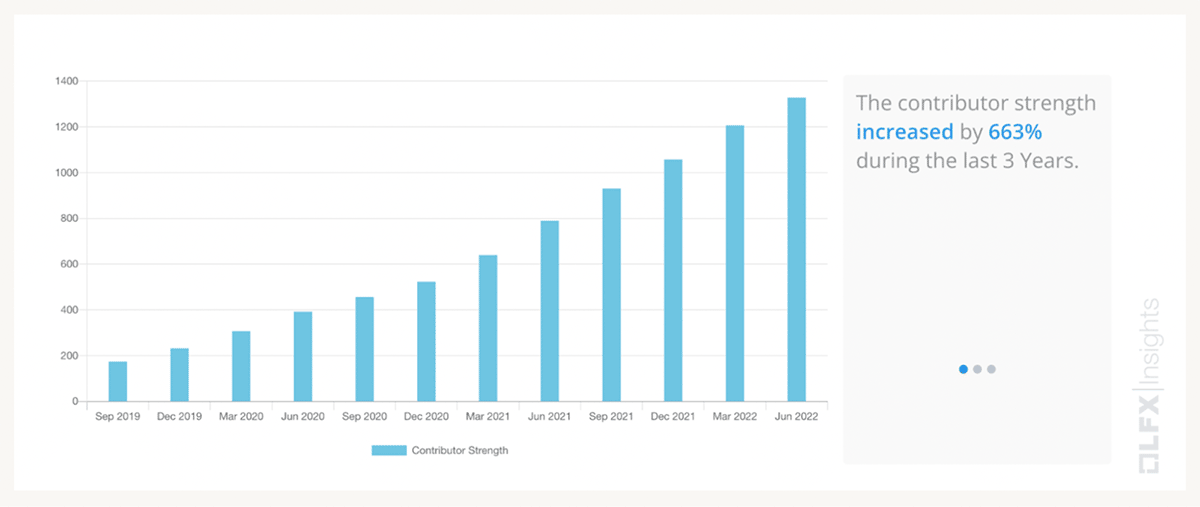
Parallel ML: How Compass Built a Framework for Training Many Machine Learning Models on Databricks

$
0
0

This is a collaborative post from Databricks and Compass. We thank Sujoy Dutta, Senior Machine Learning Engineer at Compass, for his contributions.

 
As a global real estate company, Compass processes massive volumes of demographic and economic data to monitor the housing market across many geographic locations. Analyzing and modeling differing regional trends requires parallel processing methods that can efficiently apply complex analytics at geographic levels.

In particular, machine learning model development and inference are complex. Rather than training a single model, dozens or hundreds of models may need to be trained. Sequentially training models extends the overall training time and hinders interactive experimentation.

Compass’ first foray into parallel feature engineering and model training and inference was built on a Kubernetes cluster architecture leveraging Kubeflow. The additional complexity and technical overhead was substantial. Modifying workloads on Kubeflow was a multistep and tedious process that hampered the team’s ability to iterate. There was also considerable time and effort required to maintain the Kubernetes cluster that was better suited to a specialized devops division and detracted from the team’s core responsibility of building the best predictive models. Lastly, sharing and collaboration were limited because the Kubernetes approach was a niche workflow specific to the data science group, rather than an enterprise standard.

In researching other workflow options, Compass tested an approach based on the Databricks Lakehouse Platform. The approach leverages a simple-to-deploy Apache Spark™ computing cluster to distribute feature engineering and training and inference of XGBoost models at dozens of geographic levels. Challenges experienced with Kubernetes were mitigated. Databricks clusters were easy to deploy and thus did not require management by a specialized team. Model training were easily triggered, and Databricks provided a powerful, interactive and collaborative platform for exploratory data analysis and model experimentation. Furthermore, as an enterprise standard platform for data engineering, data science, and business analytics, code and data became easily shareable and re-usable across divisions at Compass.

The Databricks-based modeling approach was a success and is currently running in production. The workflow leverages built-in Databricks features: the Machine Learning Runtime, Clusters, Jobs, and MLflow. The solution can be applied to any problem requiring parallel model training and inference at different data grains, such as a geographic, product, or time-period level.

An overview of the approach is documented below and the attached, self-contained Databricks notebook includes an example implementation.

The approach

The parallel model training and inference workflow is based on Pandas UDFs. Pandas UDFs provide an efficient way to apply Python functions to Spark Dataframes. They can receive a Pandas DataFrame as input, perform some computation, and return a Pandas DataFrame. There are multiple ways of applying a PandasUDF to a Spark DataFrame; we leverage the groupBy.applyInPandas method.

The groupBy.applyInPandas method applies an instance of a PandasUDF separately to each groupBy column of a Spark DataFrame; it allows us to process features related to each group in parallel.

Training models in parallel on different groups of data

Training models in parallel on different groups of data

Our PandasUDF trains an XGBoost model as part of a scikit-learn pipeline. The UDF also performs hyper-parameter tuning using Hyperopt, a framework built into the Machine Learning Runtime, and logs fitted models and other artifacts to a single MLflow Experiment run.

After training, our experiment run contains separate folders for each model trained by our UDF. In the chart below, applying the UDF to a Spark DataFrame with three distinct groups trains and logs three separate models.

As part of a training run, we also log a single, custom MLflow pyfunc model to the run. This custom model is intended for inference and can be registered to the MLflow Model Registry, providing a way to log a single model that can reference the potentially many models fit by the UDF.

The PandasUDF ultimately returns a Spark DataFrame containing model metadata and validation statistics that is written to a Delta table. This Delta table will accumulate model information over time and can be analyzed using Notebooks or Databricks SQL and Dashboards. Model runs are delineated by timestamps and/or a unique id; the table can also include the associated MLflow run id for easy artifact lookup. The Delta-based approach is an effective method for model analysis and selection when many models are trained and visually analyzing results at the model level becomes too cumbersome.

The environment

When applying the UDF in our use case, each model is trained in a separate Spark Task. By default, each Task will use a single CPU core from our cluster, though this is a parameter that can be configured. XGBoost and other commonly used ML libraries contain built-in parallelism so can benefit from multiple cores. We can increase the CPU cores available to each Spark Task by adjusting the Spark configuration in the Advanced settings section of the Clusters UI.

spark.task.cpus 4

The total cores available in our cluster divided by the spark.task.cpus number indicates the number of model training routines that can be executed in parallel. For instance, if our cluster has 32 cores total across all virtual machines, and spark.task.cpus is set to 4, then we can train eight model’s in parallel. If we have more than eight models to train, we can either increase the number of cluster cores by changing the instance type, adjusting spark.task.cpus, or adding more instances. Otherwise, eight models will be trained in parallel before moving on to the next eight.

Logging multiple models to a single MLflow Experiment run

Logging multiple models to a single MLflow Experiment run

For this specialized use case, we disabled Adaptive Query Execution (AQE). AQE should normally be left enabled, but it can combine small Spark tasks into larger tasks. If fitting models to smaller training datasets, AQE may limit parallelism by combining tasks, resulting in sequential fitting of multiple models within a Task. Our goal is to fit separate models in each Task and this behavior can be confirmed using example code in the attached solution accelerator. In cases where group-level datasets are especially small and there are many models that are quick to train, training multiple models within a Task may be preferred. In this case, a number of models will be trained sequentially within a Task.

Artifact management and model inference

Training multiple versions of a machine learning algorithm on different data grains introduces workflow complexities compared to single model training. The model object and other artifacts can be logged to an MLflow Experiment run when training a single model. The logged MLflow model can be registered to the Model Registry where it can be managed and accessed.

With our multi-model approach, an MLflow Experiment run can contain many models, not just one, so what should be logged to the Model Registry? Furthermore, how can these models be applied to new data for inference?

We solve these issues by creating a single, custom MLflow pyfunc model that is logged to each model training Experiment run. A custom model is a Python class that inherits from MLflow and contains a “predict” method that can apply custom processing logic. In our case, the custom model is used for inference and contains logic to lookup and load a geography’s model and use it to score records for the geography.

We refer to this model as a “meta model”. The meta model is registered with the Model Registry where we can manage its Stage (Staging, Production, Archived) and import the model into Databricks inference Jobs. When we load a meta model from the Model Registry, all geographic-level models associated with the meta model’s Experiment run are accessible through the meta model’s predict method.

Similar to our model training UDF, we use a Pandas UDF to apply our custom MLflow inference model to different groups of data using the same groupBy.applyInPandas approach. The custom model contains logic to determine which geography’s data it has received; it then loads the trained model for the geography, scores the records, and returns the predictions.

Leveraging a custom MLflow model to load and apply different models

Leveraging a custom MLflow model to load and apply different models

Generating predictions using each groups respective model

Generating predictions using each groups respective model

Model tuning

We leverage Hyperopt for model hyperparamter tuning and this logic is contained within the inference UDF. Hyperopt is built into the ML Runtime and provides a more sophisticated method for hyper-parameter tuning compared to traditional grid search, which tests every possible combination of hyper-parameters specified in the search space. Hyperopt can explore a broad space, not just grid points, reducing the need to choose somewhat arbitrary hyperparameters values to test. Hyperopt efficiently searches hyperparameter combinations using Baysian techniques that focus on more promising areas of the space based on prior parameter results. Hyperopt parameter training runs are referred to as “Trials”.

Early stopping is used throughout model training, both at an XGBoost training level and at the Hyperopt Trials level. For each Hyperopt parameter combination, we train XGBoost trees until performance stops improving; then, we test another parameter combination. We allow Hyperopt to continue searching the parameter space until performance stops improving. At that point we fit a final model using the best parameters and log that model to the Experiment run.

To recap, the model training steps are as follows; an example implementation is included in the attached Databricks notebook.

  1. Define a Hyperopt search space
  2. Allow Hyperopt to choose a set of parameters values to test
  3. Train an XGBoost model using the chosen parameters values; leverage XGBoost early stopping to train additional trees until performance does not improve after a certain number of trees
  4. Continue to allow Hyperopt to test parameter combinations; leverage Hyperopt early stopping to cease testing if performance does not improve after a certain number of Trials
  5. Log parameter values and train/test validation statistics for the best model chosen by Hyperopt as an MLflow artifact in .csv format.
  6. Fit a final model on the full dataset using the best model parameters chosen by Hyperopt; log the fitted model to MLflow

Conclusion

The Databricks Lakehouse Platform mitigates the DevOps overhead inherent in many production machine learning workflows. Compute is easily provisioned and comes pre-configured for many common use cases. Compute options are also flexible; data scientist’s developing Python-based models using libraries like scikit-learn can provision single-node clusters for model development. Training and inference can then be scaled up using a Cluster and the techniques discussed in this article. For deep learning model development, GPU-backed single node clusters are easily provisioned and related libraries such as Tensorflow and Pytorch are pre-installed.

Furthermore, Databricks’ capabilities extend beyond the data scientist and ML engineering personas by providing a platform for both business analysts and data engineers. Databricks SQL provides a familiar user experience to business analysts accustomed to SQL editors. Data engineers can leverage Scala, Python, SQL and Spark to develop complex data pipelines to populate a Delta Lake. All personas can leverage Delta tables directly using the same platform without any need to move data into multiple applications. As a result, execution speed of analytics projects increases while technical complexity and costs decline.

Please see the associated Databricks Repo that contains a tutorial on how to implement the above workflow, https://github.com/marshackVB/parallel_models_blog

--

Try Databricks for free. Get started today.

The post Parallel ML: How Compass Built a Framework for Training Many Machine Learning Models on Databricks appeared first on Databricks.
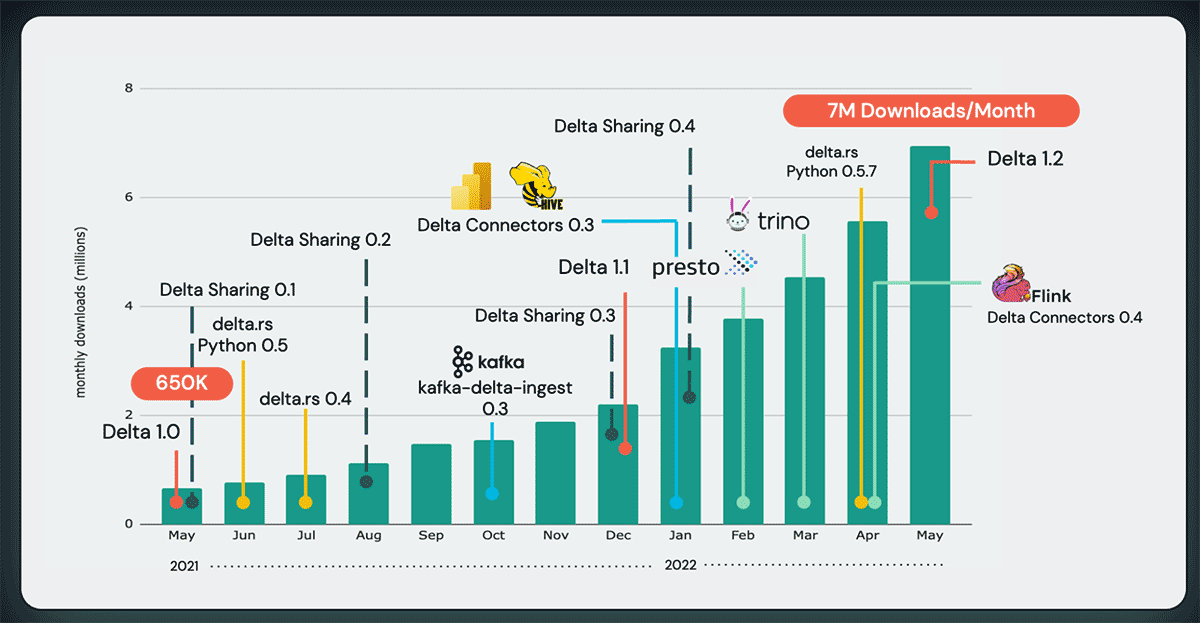
How the Lakehouse Empowered Rogers Communications to Modernize Revenue Assurance

$
0
0

This is a guest post from Duane Robinson, Sr. Manager of Data Science at Rogers Communications.

 
At Rogers Communications, we take pride in ensuring billing accuracy and integrity for our customers. To achieve those tasks and satisfy a range of use cases, we need to utilize data throughout our various businesses. Everything from provisioning analysis to usage measurement depends on our ability to apply data and machine learning, enabling us to work faster and smarter.

To help us better understand our customers and internal operations, we rely on both historical and real-time data to provide insights and analytics that we can leverage for billing accuracy and preventing revenue leakage. Our legacy technology was unable to adapt and scale to meet our analytical requirements. Revenue Assurance was relying on monolithic, on-premises data warehouses and tools that created a number of challenges for our data teams:

  • As the number of data sources and data volumes grew, the performance of our legacy environment suffered;
  • Disjointed data caused us to use cumbersome, time-consuming, and overall inefficient tools
  • We couldn’t scale our capabilities or store enough information to generate the advanced descriptive analytics and forecasting we needed;
  • We didn’t have a seamless way to share and visualize insights with business teams, hurting data-sharing and collaboration;
  • Our data team spent far too much time collecting and mining data rather than investigating and preparing it for our various use cases.

To become insight-driven and adapt to the ever-growing telecommunications landscape, Revenue Assurance needed to migrate to the cloud and modernize tooling to keep up with the flow and volume of information. We needed to utilize tools that would democratize data access and collaboration across businesses, streamline efficiency through automation, and make better use of our data science talent for new insights. Business leaders were eager to keep up with industry peers and competitors, but they needed to understand the value of a completely new environment before providing support.

To help secure approvals for modernization, we created a KPI-based, year-long roadmap that outlined vital milestones. These included establishing a centralized data lake, implementing encryption for alignment with privacy laws, creating business intelligence (BI) dashboards to help visualize insights, and finally, accomplishing our goal of becoming a data-driven organization.

To achieve the outcomes we had promised, Revenue Assurance needed a modern data platform that unified our data and enabled data teams with analytics and ML at scale. It was time to clean up shop by transforming the way we interacted with our data.

Lakehouse platform enables data democratization across the business

Rogers chose to deploy the Databricks Lakehouse Platform on Azure based on the customer stories and achievements we read on the Databricks website. Regardless of industry, we saw many successful implementations of Databricks that delivered the same results we wanted to accomplish.

We created a centralized and harmonized data repository in the Azure cloud called the RADL or Revenue Assurance Data Lake. We used Azure Data Factory to move to the Azure cloud and migrated our on-prem Hadoop and Oracle data and pipelines into the RADL. In order to meet Canada’s privacy laws, we built an encryption framework to protect personally identifiable information (PII). For data analysis, we actually tried a different tool first, but it was unable to do predictive work at the scale we required. From that experience, we learned the criticality of using open source frameworks for flexibility and freedom.

Databricks Lakehouse supports multiple languages including SQL, Python, R, and Scala, which gives Rogers an advantage in the fierce competition for data engineers and scientists. We’re able to widen our talent pool in the labor market to attract top talent regardless of programming language. With Databricks, we’re also not locked into specific vendors or packages. A truly open source experience means we can invoke any open source package that exists and give data scientists the ability to apply what they think is best. Additionally, with automated clusters, we’re further enabled to scale according to workload size rather than worrying about overages, storage requirements, and limitations.

For our business teams, we are now able to easily feed real-time insights to analysts and business teams through visual dashboards. These can be sliced and diced to meet the needs of our stakeholders across business units. More people are understanding not only how data insights are generated, but also what those data insights mean for their own teams. Using advanced ML packages, we’ve also been able to improve the accuracy of predictive forecasting and descriptive SQL reporting. From an operations standpoint, Databricks gives us an understanding of cost in comparison to capabilities. We can justify the cost of using more compute and storage because we can also see gains in performance.

Improving operations and revenue through data-driven solutions

With the migration to the cloud complete and our data in RADL on Databricks Lakehouse, Revenue Assurance is now putting data-based use-cases into production faster and more frequently than ever. Where Databricks continues to shine is in remedying benchmark statistics like roaming trends for financial analysis. To dive deeper into roaming trends, we needed new data features to understand and predict customer behavior.

For example, we are using the number of travelers flying in and out of Canada (sourced from the national statistical office, Statistics Canada or StatsCAN) and other variables such as seasonality to help us better estimate future revenue. Now Revenue Assurance is able to better analyze roaming revenue, both presently and into the future, which is critical for billing integrity and accuracy.

Going forward, Rogers will continue to evolve and modernize using the latest data efficiencies in the Databricks Lakehouse Platform. Overall, our goal is to make ML a core competency of Revenue Assurance so that data-driven reporting and predictive elements are always being applied to achieving business outcomes. As data volume and sources continue to grow, Rogers has confidence in our Lakehouse architecture and underlying cloud infrastructure to give us the ability to efficiently use that information for smarter business decisions.

--

Try Databricks for free. Get started today.

The post How the Lakehouse Empowered Rogers Communications to Modernize Revenue Assurance appeared first on Databricks.
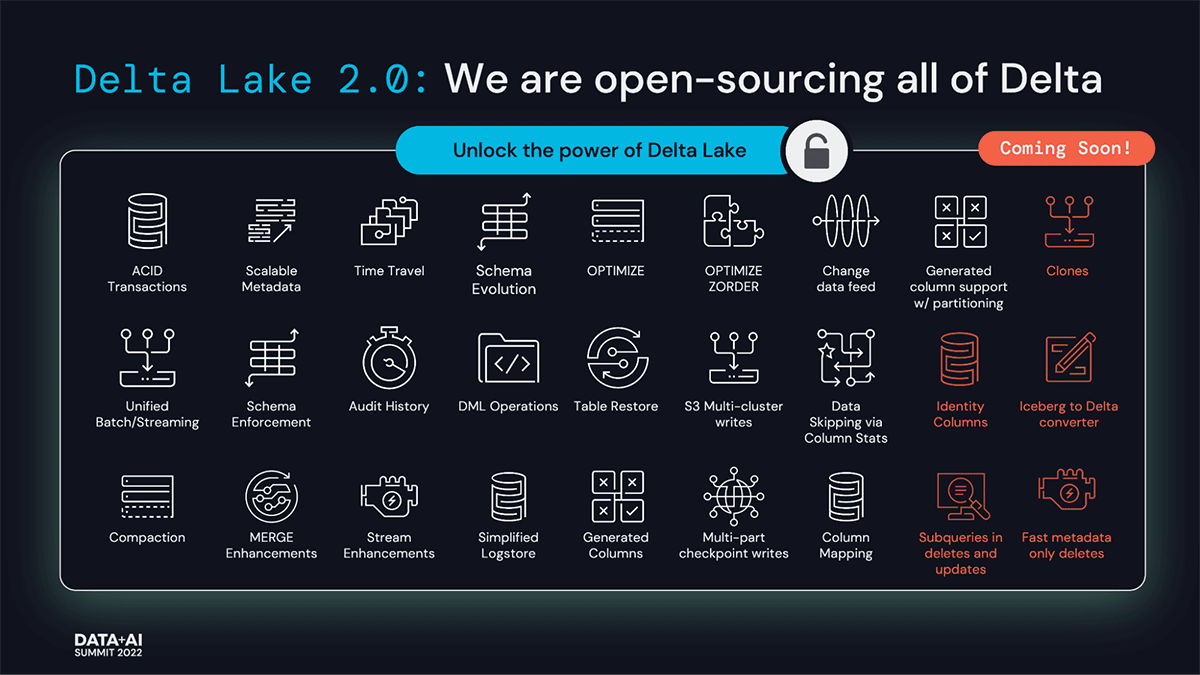
Key Retail & Consumer Goods Takeaways From Data + AI Summit 2022

$
0
0

Retail and Consumer Goods companies showed up big at Data + AI Summit this year! With incredible breakout sessions to a keynote and panel of top retail speakers like the VP of Ads Engineering at Instacart and the Global CTO of Walgreens, we heard about innovation with data and AI like we never have before.

In case you missed the live event, I’m excited to share product announcements, highlights of the industry program, and on-demand sessions on our virtual platform. These sessions, which featured industry experts and technologists from Databricks, our customers, and partners, showcase why the Lakehouse for Retail & Consumer Goods is a key component for organizations looking to modernize their data strategy. As you’ll discover from the sessions, a lakehouse is especially critical for ensuring greater stability in this time of uncertainty and for delivering more personalized, onmichannel experiences to customers.

Retail & Consumer Goods Forum

For our Retail & Consumer Goods attendees, the most exciting part of Data + AI Summit 2022 was the Retail & Consumer Goods Forum – a two-hour event that brought together leaders from across all segments of retail and consumer goods to hear from peers about their data journey. Bryan Smith, Databricks Retail & Consumer Goods Global Technical Director, shared an overview of the lakehouse and how it enables RCG companies to leverage real-time data to transform the customer experience.

In a keynote from Instacart Ad’s Vice President of Engineering, Vik Gupta, attendees learned about the rise of retail media networks and the importance of performance measurement. Retail ad networks are a very hot topic with companies right now. Vik shared how ad platforms, like Instacart Ads, benefit retail and consumer goods brands by unlocking new digital monetization capabilities, data, and insights on shopping behavior.

In a panel moderated by Sam Steiny, 84.51’s VP of Engineering, Nick Hamilton, Shipt’s Director of Engineering, Barry Ralston, PetSmart’s VP of Analytics & Insights, Elpida Ormanidou and Walgreen’s Global CTO, Mike Maresca, attendees learned best practices for achieving business outcomes with data + AI regaring people, process, and technology.

For example, in reference to recent market volatility, Nick Hamilton at 84.51 shared the imporance of being “both proactive and reactive.” For 84.51, this means improving their data science ahead of time so the data team can proactively respond to changes and have the right product on the shelves while maintaining the ability to make changes in models when needed.

Barry from Shipt discussed the importance of real-time data in the delievery business. In Barry’s words: before moving to Databricks, the “the lag from our operational systems into our cloud data warehouse platform was on the order of 5 to 6 minutes, which was a lifetime.” Shipt has gotten that lag down to around 16 seconds and, most importantly, now has the ability to tune performance based on the business needs.

Industry Sessions

The event had a number of incredible Retail & Consumer Goods breakout sessions featuring companies from all segments of the industry. All sessions are now available on our virtual platform. Here are few you don’t want to miss:

DoorDash – Building a Lakehouse for Data Science at DoorDash
Wehkamp – Powering Up the Business with a Lakehouse
Anheuser-Busch InBev – Building and Scaling Machine Learning-Based Products in the World’s Largest Brewery
Walmart – Intermittent Demand Forecasting in Scale Using Meta Modeling
Levi Strauss & Co – A Vision for the Future with Edge ML-Powered Devices

Key Announcements That Will Transform Retail & Consumer Goods

While much has been written about the innovations shared by Databricks at this year’s Data + AI Summit, I thought I would provide a quick recap of our news and why it’s particularly exciting to our retail & consumer goods customers:

Delta Lake is now fully open source. Delta Lake is the fastest, most popular, and advanced open format table storage format. With the release candidacy of Delta Lake 2.0, Databricks is now open sourcing the most requested features by the community. This means that features that were available in the past to Databricks customers only will be available to all of the Delta Lake community.

When we talk with Retail and Consumer Goods companies, the theme they constantly stress to us is:”when we make the decision to use proprietary technologies or clouds, it always works against us.” We agree. The announcements from Data + AI Summit go a long way in reaffirming our support for technology that helps avoid vendor lock-in, allows them to benefit from enhancements from the open-source community, and give them flexibility in the partners they integrate to their Lakehouses.

And when it comes to performance, Delta Lake continues to provide unrivaled, out-of-the-box price-performance for all lakehouse workloads from streaming to batch processing — up to 4.3x faster compared to other storage layers.

Many RCG companies use and contribute to Delta Lake, including Apple & Columbia Sportswear.

What does this mean for our RCG customers? To meet the evolving demands in the space, organizations can now ensure:

  • Data is available to support decisions in real-time.
  • Companies can store, manage and govern all types of data in their object store.
  • Development and management is streamlined with code managed via CI/CD, living in your GitHub repository, and using MLflow (VERSION) to streamline the MLOps process.
  • Companies have optionality in the partners they have integrating with their Lakehouse, with applications leveraging open source APIs
  • There is no vendor or cloud lock-in.
  • Databricks continues to make major investments in the platform to ensure that it maximizes productivity and provides the best TCO of any data + AI platform.

Delta Live Tables has new performance and efficiency features.
One of the biggest hurdles in enabling data, reporting or analysis is buidling pipelines to ingest and transform data. Delta Live Tables was designed to streamline this development process, while delivering high performance and easier manageability.

Delta Live Tables has grown to power production ETL use cases at leading companies all over the world since its inception. DLT is used by over 1,000 companies ranging from startups to enterprises, including retail and consumer goods comapnies like Jumbo, the Netherlands-based super market chain. You can read about all the latest DLT enhancements in this blog post, but here are some key highlights:

Project Enzyme is a new optimization layer for Delta Live Tables that speeds up ETL processing, enables enterprise capabilities, and UX improvements.

Enhanced Autoscaling optimizes cluster utilization by automatically allocating cluster resources based on workload volume, with minimal impact to the data processing latency of your pipelines – reducing usage and cost for customers.

With volatility in the market and narrowing margins, speed and cost are of the utmost importance in retail and consumer goods organizations. Data teams need fresh and reliable data urgently and without breaking the bank in order to make real-time decisions. These two capabilities will help them do that.

MLfLow Pipelines makes model development & deployment fast and scalable
MLflow Pipelines enable Data Scientists to create production-grade ML pipelines that combine modular ML code with software engineering best practices to make model development and deployment fast and scalable.

As RCG companies begin using ML to uncover new revenue streams or better understand their customers, MLflow Pipelines is incredibly valuable due to its ease of use and integration with a proven system. Most companies struggle to achieve the scale that is required for effective AI. Databricks makes AI at scale possible and MLflow Pipelines is a critical part of that.

Retail customers love machine learning on the Lakehouse – check out this breakout session to learn how Starbucks is using ML on Databricks for their recommendation engine across 30,000 stores.

Delta Sharing is GA soon with Clean Rooms capabilties to follow. One of the biggest challenges for Retail, Consumer Goods and other companies in the Retail value chain is how they efficiently share information in real-time. Existing solutions often require costly integration and support, or require both parties license the same proprietary data sharing technologies. This limits data sharing only to the largest of companies. And these methods operate in batch, leading to days of delay in responding to business needs.

Delta Sharing is an open source protocol that enables the secure sharing of data with partners across technologies and clouds. Databricks customers can share data from Azure to AWS or from Databricks to a large number of Delta Sharing compliant technologies. Delta Sharing is built on top of the real-time performance of Delta and the robust management and governance of Unity Catalog. Retailers can provide real-time visibility to conditions in their stores, enabling distributors, suppliers and other partners to cut days out of responding to conditions such as out-of-stocks. It promises to unleash secure, real-time collaboration like never before.

At Data + AI Summit, we announced Data Cleanrooms (coming soon). Retailers want to share consumer data with partners, but they want to respect the privacy wishes and regulatory requirements in doing this. This is what Data Cleanrooms are designed to enable.

Data Cleanrooms opens a broad array of use cases for retail and consumer goods companies, such as enriching retail loyalty data with consumer behaviors in advertising or other channels. Consumer packaged goods (CPG) companies can see sales uplift by consumer segments by joining their first-party advertisement data with point of sale (POS) transactional data of their retail partners.

Check out our Retail & Consumer Goods Forum where Nick, VP of Engineering from 84.51, talked about how he sees Clean Rooms as the biggest upcoming trend in the RCG industry – among other exciting industry topics.

Beyond these featured announcements, there were other exciting announcements like Databricks Marketplace, Unity Catalog and Serverles Model Endpoints. We encourage you to check out the Day 1 and Day 2 Keynotes to learn more about our product announcements!

--

Try Databricks for free. Get started today.

The post Key Retail & Consumer Goods Takeaways From Data + AI Summit 2022 appeared first on Databricks.

Power to the SQL People: Introducing Python UDFs in Databricks SQL

$
0
0

We were thrilled to announce the preview for Python User-Defined Functions (UDFs) in Databricks SQL (DBSQL) at last month’s Data and AI Summit. This blog post gives an overview of the new capability and walks you through an example showcasing its features and use-cases.

Python UDFs allow users to write Python code and invoke it through a SQL function in an easy secure and fully governed way, bringing the power of Python to Databricks SQL.

Introducing Python UDFs to Databricks SQL

In Databricks and Apache Spark™ in general, UDFs are means to extend Spark: as a user, you can define your business logic as reusable functions that extend the vocabulary of Spark, e.g. for transforming or masking data and reuse it across their applications. With Python UDFs for Databricks SQL, we will expand our current support for SQL UDFs.

Let’s look at a Python UDF example. Below the function redacts email and phone information from a JSON string, and returns the redacted string, e.g., to prevent unauthorized access to sensitive data:

CREATE FUNCTION redact(a STRING)
RETURNS STRING
LANGUAGE PYTHON
AS $$
import json
keys = ["email", "phone"]
obj = json.loads(a)
for k in obj:
  if k in keys:
    obj[k] = "REDACTED"
return json.dumps(obj)
$$;

To define the Python UDF, all you have to do is a CREATE FUNCTION SQL statement. This statement defines a function name, input parameters and types, specifies the language as PYTHON, and provides the function body between $$.

The function body of a Python UDF in Databricks SQL is equivalent to a regular Python function, with the UDF itself returning the computation’s final value. Dependencies from the Python standard library and Databricks Runtime 10.4, such as the json package in the above example, can be imported and used in your code. You can also define nested functions inside your UDF to encapsulate code to build or reuse complex logic.

From that point on, all users with appropriate permissions can call this function as you do for any other built-in function, e.g., in the SELECT, JOIN or WHERE part of a query.

Features of Python UDFs in Databricks SQL

Now that we described how easy it is to define Python UDFs in Databricks SQL, let’s look at how it can be managed and used within Databricks SQL and across the lakehouse.

Manage and govern Python UDFs across all workspaces

Python UDFs are defined and managed as part of Unity Catalog, providing strong and fine-grained management and governance means:

  • Python UDFs permissions can be controlled on a group (recommended) or user level across all workspaces using GRANT and REVOKE statements.
  • To create a Python UDF, users need USAGE and CREATE permission on the schema and USAGE permission on the catalog. To run a UDF, users need EXECUTE on the UDF. For instance, to grant the finance-analysts group permissions to use the above redact Python UDF in their SQL expressions, issue the following statement:
GRANT EXECUTE ON silver.finance_db.redact TO finance-analysts
  • Members of the finance-analyst group can use the redact UDF in their SQL expressions, as shown below, where the contact_info column will contain no phone or email addresses.
SELECT account_nr, redact(contact_info) FROM silver.finance_db.customer_data

Enterprise-grade security and multi-tenancy

With the great power of Python comes great responsibility. To ensure Databricks SQL and Python UDFs meet the strict requirements for enterprise security and scale, we took extra precautions to ensure it meets your needs.

To this end, compute and data are fully protected from the execution of Python code within your Databricks SQL warehouse. Python code is executed in a secure environment preventing:

  • Access to data not provided as parameters to the UDF, including file system or memory outside of the Python execution environment
  • Communication with external services, including the network, disk or inter-process communication

This execution model is built from the ground up to support the concurrent execution of queries from multiple users leveraging additional computation in Python without sacrificing any security requirements.

Do more with less using Python UDFs

Serving as an extensibility mechanism there are plenty of use-cases for implementing custom business logic with Python UDFs.

Python is a great fit for writing complex parsing and data transformation logic which requires customization beyond what’s available in SQL. This can be the case if you are looking at very specific or proprietary ways to protect data. Using Python UDFs, you can implement custom tokenization, data masking, data redaction, or encryption mechanisms.

Python UDFs are also great if you want to extend your data with advanced computations or even ML model predictions. Examples include advanced geo-spatial functionality not available out-of-the-box and numerical or statistical computations, e.g., by building upon NumPy or pandas.

Re-use existing code and powerful libraries

If you have already written Python functions across your data and analytics stack you can now easily bring this code into Databricks SQL with Python UDFs. This allows you to double-dip on your investments and onboard new workloads faster in Databricks SQL.

Similarly, having access to all packages of Python’s standard library and the Databricks Runtime allows you to build your functionality on top of those libraries, supporting high quality of your code while at the same time making more efficient use of your time.

Get started with Python UDFs on Databricks SQL and the Lakehouse

If you already are a Databricks customer, sign up for the private preview today. We’ll provide you with all the necessary information and documentation to get you started as part of the private preview.

If you want to learn more about Unity Catalog, check out this website. If you are not a Databricks customer, sign up for a free trial and start exploring the endless possibilities of Python UDFs, Databricks SQL and the Databricks Lakehouse Platform.

Join the conversation and share your ideas and use-cases for Python UDFs in the Databricks Community where data-obsessed peers are chatting about Data + AI Summit 2022 announcements and updates. Learn. Network. Celebrate.

--

Try Databricks for free. Get started today.

The post Power to the SQL People: Introducing Python UDFs in Databricks SQL appeared first on Databricks.

Viewing all 1874 articles
Browse latest View live