Quantcast
Channel: Databricks
Viewing all 1874 articles
Browse latest View live

Delivering Product Innovation to Maximize Manufacturing’s Return on Capital

$
0
0

Manufacturing is an evolutionary business, grounded upon infrastructure, business processes, and manufacturing operations built over decades in a continuum of successes, insights and learnings. The methods and processes used to approach the development, launch, optimization of products and capital spend are the foundation of the industry’s evolution.

Today’s data and AI-driven businesses are rewarded by leveraging process and product optimization use cases not previously possible, are able to forecast and sense supply chain demand, and, crucially, introduce new forms of revenue based upon service rather than product.

The drivers for this evolution? The emergence of what we refer to as “Intelligent Manufacturing” is enabled by the rise of computational power at the Edge, in the Cloud, new levels of connectivity speed enabled by 5G and fiber optic, and combined with increased use of advanced analytics and machine learning (ML).

Yet even with all the technological advances enabling these new data-driven business, challenges exist. McKinsey’s recent research with the World Economic Forum
estimates the value creation potential of manufacturers and suppliers that implement Industry 4.0 in their operations at USD$37 trillion by 2025. Truly a huge number. But the challenge that most companies still struggle with is the move from piloting point solutions to delivering sustainable impact at scale. Only 30% of companies are capturing value from Industry 4.0 solutions in manufacturing today.

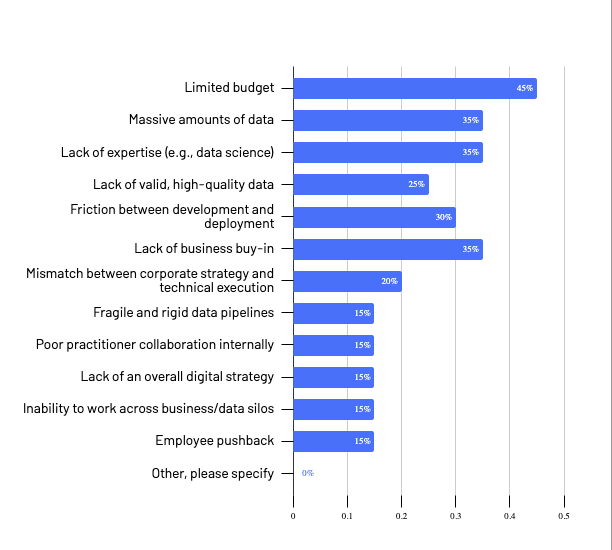
Over the last two years demand imbalances and supply chain swings have added a sense of urgency for manufacturers to digitally transform. But in truth the main challenges facing the industry have existed, and will continue to exist, outside these recent exceptional circumstances. Manufacturers will always strive for greater levels of visibility across their supply chain, always seek to optimize and streamline operations to improve margins. In a recent Omdia/Databricks survey, manufacturers confirmed their continuing quest to improve efficiency, productivity, adaptability, and resilience seeking to deliver increased profitability, increased productivity (throughput) and create new revenue streams.

Current Manufacturing Business Objectives

Keenly conscious that financial value must be delivered to both the CDAO, CIO and Line of Business owners when approaching technology driven data transformation solutions, the following product innovations announced at the recent Data + AI Summit are organized so that each can easily be related to the manufacturing value stream.

Operations Optimization and Creating Agile Supply Chains

Streaming data combined with IT/OT data convergence power today’s Connected Manufacturers by enabling value producing use cases like real-time advanced process control and optimization, supply chain demand forecasting and computer vision enabled quality assurance. The key to unlocking these use cases is the ability to stream data sources and process it in near real time. At the Data + AI Summit, Databricks announced Project Light Speed whose objective is to improve performance achieving higher throughput, lower latency and lower cost. The announcement includes improving ecosystem support for connectors, enhancing functionality for processing data with new operators and APIs, simplifying deployment, operations, monitoring and troubleshooting.

Streaming data is important to companies like Cummins, a multinational corporation that designs, manufactures, and distributes engines, filtration, and power generation products, using streaming to collect telemetry data from engines and analyze it in real-time for maintenance alerts.

If streaming data is a foundational core of Connected Manufacturing,  advanced analytics built on machine learning and AI is the true pinnacle of value.  The challenge that both CIOs and Line of Business Owners have is that if the creation, testing and deployment of these models is not easy, scalable and trusted they will not be used by data scientists or more importantly, the business they serve.

Innovations in MLflow Pipelines was announced that enable Data Scientists to create production-grade ML pipelines that combine modular ML code with software engineering best practices to make model development and deployment fast and scalable.  The new features around model monitoring will be impactful for manufacturing as it’s common for our customers and prospects to have a significant number of models that span operations, supply chains and sales/marketing.  It becomes impossible to do proper model drift monitoring without some automated framework. MLflow Pipelines will help improve model governance frameworks because manufacturers can now apply CI/CD practices around constructing and managing ML model infrastructure setup. This service makes Databricks ML robust for production workloads as customers can monitor their model, diagnose fluctuations in performance and address the underlying issues.

More information on MLflow Pipelines – Blog

Serverless Model Endpoints improve upon existing Databricks-hosted model serving by offering horizontal scaling to thousands of queries per second (QPS) , potential cost savings through auto-scaling, and operational metrics for monitoring runtime performance. Ultimately, this means Databricks-hosted models are suitable for production use at scale.  Across many of our manufacturing customers, a significant number of models are being deployed and companies struggled, until now, with the cost aspect of having to spin up a single cluster for every endpoint. Serverless endpoints allow manufacturers to :

  • Keep model deployments within the Databricks ecosystem
  • Reduce time required to deploy ML models to production
  • Reduce overall architectural complexity – no need to use native services from cloud vendors
  • Accelerate the journey to unified MLOps and model governance across the organization – an important outcome from the perspective of increasing regulatory oversight and scrutiny

Supply chains benefit from innovations in intra and inter company data sharing with the introduction of data clean rooms within Unity Catalog. Data cleanrooms open a broad array of use cases across within manufacturing supply chain and tolling operations allowing for collaboration  across the value chain establishing predictive demand forecasting or providing tollers with anonymized process optimization data

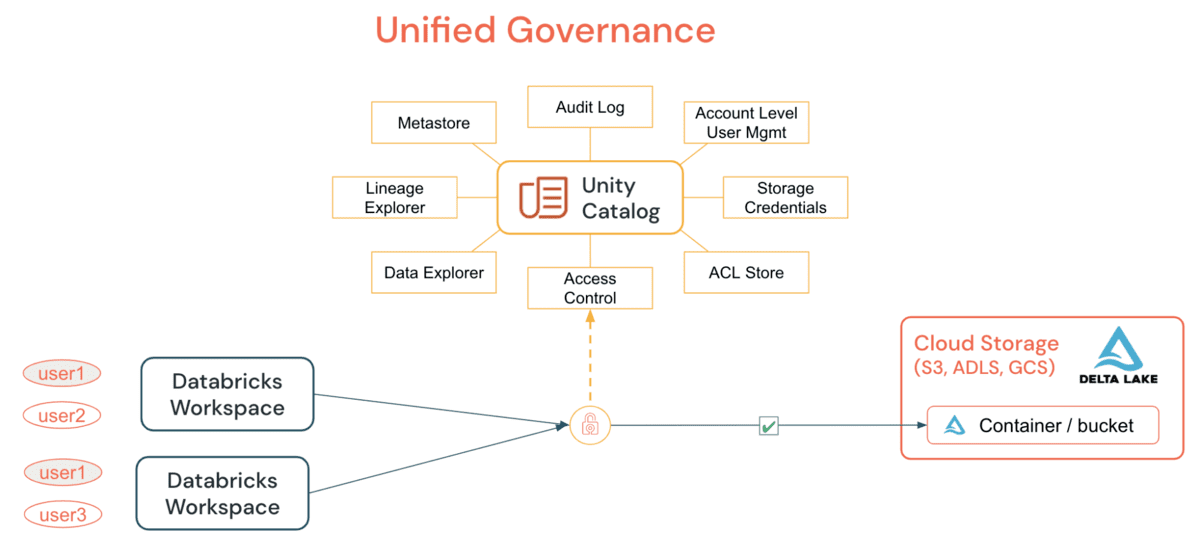
With Unity Catalog, you can enable fine-grained access controls on the data and meet your privacy requirements. Integrated governance allows participants to have full control over queries or jobs that can be executed on their data.

Manufacturing supply chains gain the ability to see three levels deep within a supply chain, without compromising intellectual property when dealing with multiple suppliers/vendors in the supply chain.

Cleanrooms also open new business models by paving the way for building networks of collaboration between Manufacturers and other adjacent industries (e.g. Consumer Goods, and Retailers as examples) to build seamless customer experiences across multiple facets of everyday life.

More information on Unity Catalog  – Blog
More information on Serverless Model Endpoints (Available late Q2, early Q3 in Gated Public Preview) – Blog
More information Delta Sharing – Data Cleanrooms  – Blog

Databricks Marketplace

Organizational Considerations

In the present time of the Great Resignation and now pressures of a potential business slowdown, organizational  stability is on all executives minds.  Databricks sees the power of open source solutions and announced that Delta Lake 2.0 will be completely open source.

What does this mean for your business?

  1. You’ll have a larger pool of skilled recruits to pull from that have broad technical knowledge instead of being beholden to technical expertise in black box solutions
  2. Your data teams will come up to speed quick leveraging a common platform
  3. Leveraging Unity Catalog your data will be accessible to a wider audience while still maintaining governance
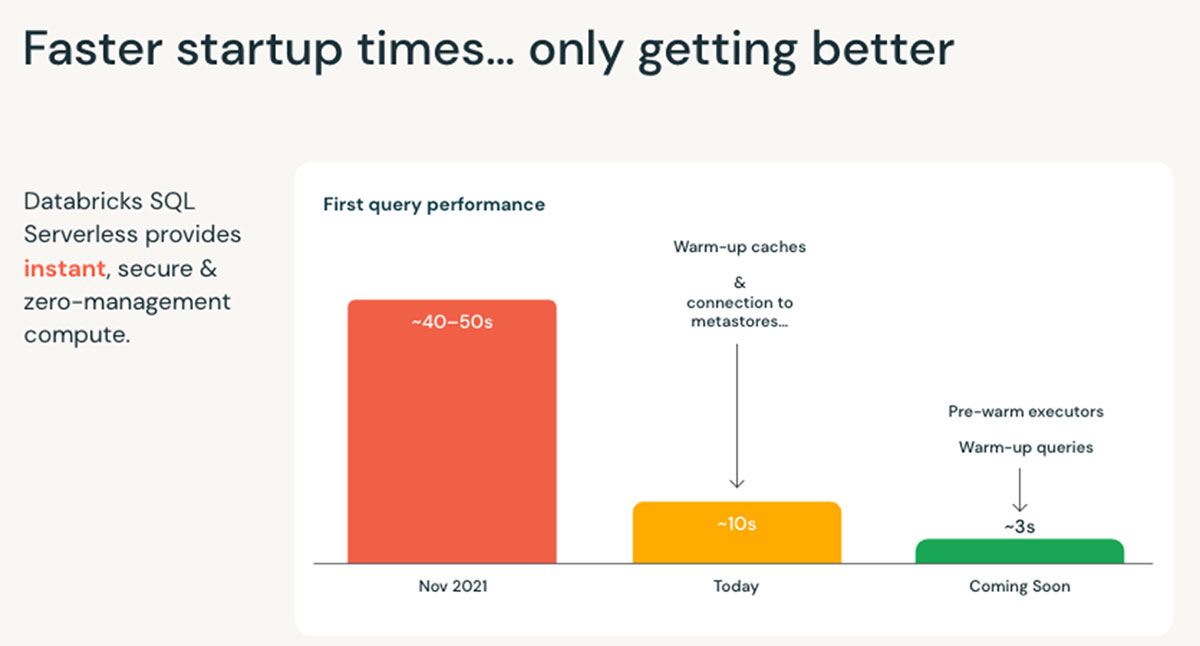
  4. Lower SQL costs with Databricks SQL Serverless means more people will use and your business will democratize data within all groups allowing for for more granular insights driving your business
  5. As an additional organizational benefit, It is important to note that in a recent analysis of our customers market performance,  our top Databricks manufacturing Lakehouse customers outperformed the overall market by over 200% over the last two years.

Shell Oil is a representative example of Lakehouse enabled value produced  as it had large volumes of disjointed data and legacy architectures making scalable ML difficult over 70+ use cases.  The Lakehouse architecture on Delta Lake is unifying data warehousing, BI, and ML enabling new use cases not possible before such as IoT (machinery, smart meters, etc), streaming video, internal reporting (HR/Finance), ETL for exploring SQL analytics and reporting for internal decision making.

More information on Delta Lake – Blog

Faster SQL Queries

Generation of New Revenue Streams

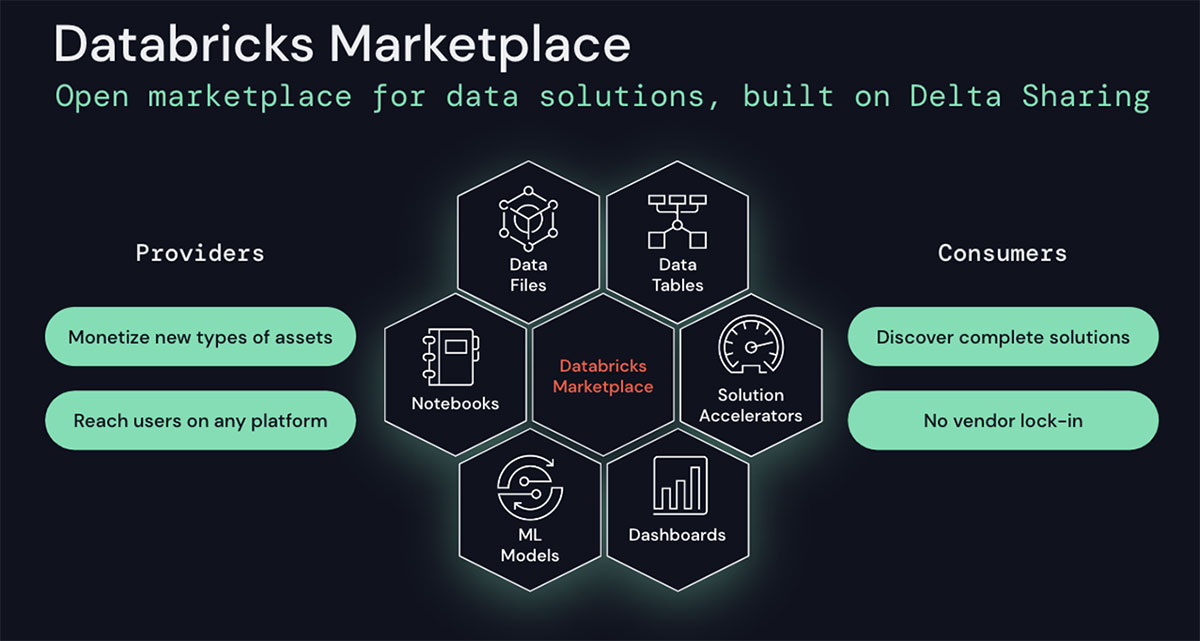
As indicated earlier in the Omdia/Databricks survey,  generation of new revenue streams is the third most important business initiatives.  Databricks is responding to this need by introducing Databrick Marketplace built on Delta Sharing, an open marketplace for exchanging data products such as datasets, notebooks, dashboards, and machine learning models. To accelerate insights, data consumers can discover, evaluate, and access more data products from third-party vendors than ever before.

Databricks Marketplace

Manufacturers can accelerate projects to monetise data and build alternative streams of revenue (e.g. selling anonymized process data or product component data to be used in predictive maintenance insights). The Databricks Marketplace will set the stage for manufacturers to finally start treating data as an asset on the balance sheet.

More information on Databricks Marketplace – Blog

For more information Databricks and these exciting product announcements click here and included are several manufacturing centric Breakout Sessions from the Data + AI Summit you might be interested in:

Breakout Sessions
Why a Data Lakehouse is Critical During the Manufacturing Apocalypse – Corning
Predicting and Preventing Machine Downtime with AI and Expert Alerts – John Deere
How to Implement a Semantic Layer for Your Lakehouse – AtScale
Applied Predictive Maintenance in Aviation: Without Sensor Data – FedEx Express
Smart Manufacturing: Real-time Process Optimization with Databricks – Tredence
The Manufacturing Industry Forum

--

Try Databricks for free. Get started today.

The post Delivering Product Innovation to Maximize Manufacturing’s Return on Capital appeared first on Databricks.
Identity Columns to Generate Surrogate Keys Are Now Available in a Lakehouse Near You!

$
0
0

What is an identity column?

An identity column is a column in a database that automatically generates a unique ID number for each new row of data. This number is not related to the row’s content.

Identity columns are a form of surrogate keys. In data warehouses, it is common to use an additional key, called a surrogate key, to uniquely identify each row and keep track of changes to the data over time. Additionally, it is recommended to use surrogate keys over natural keys. Surrogate keys are systems generated and not reliant on several fields to identify the uniqueness of the row.

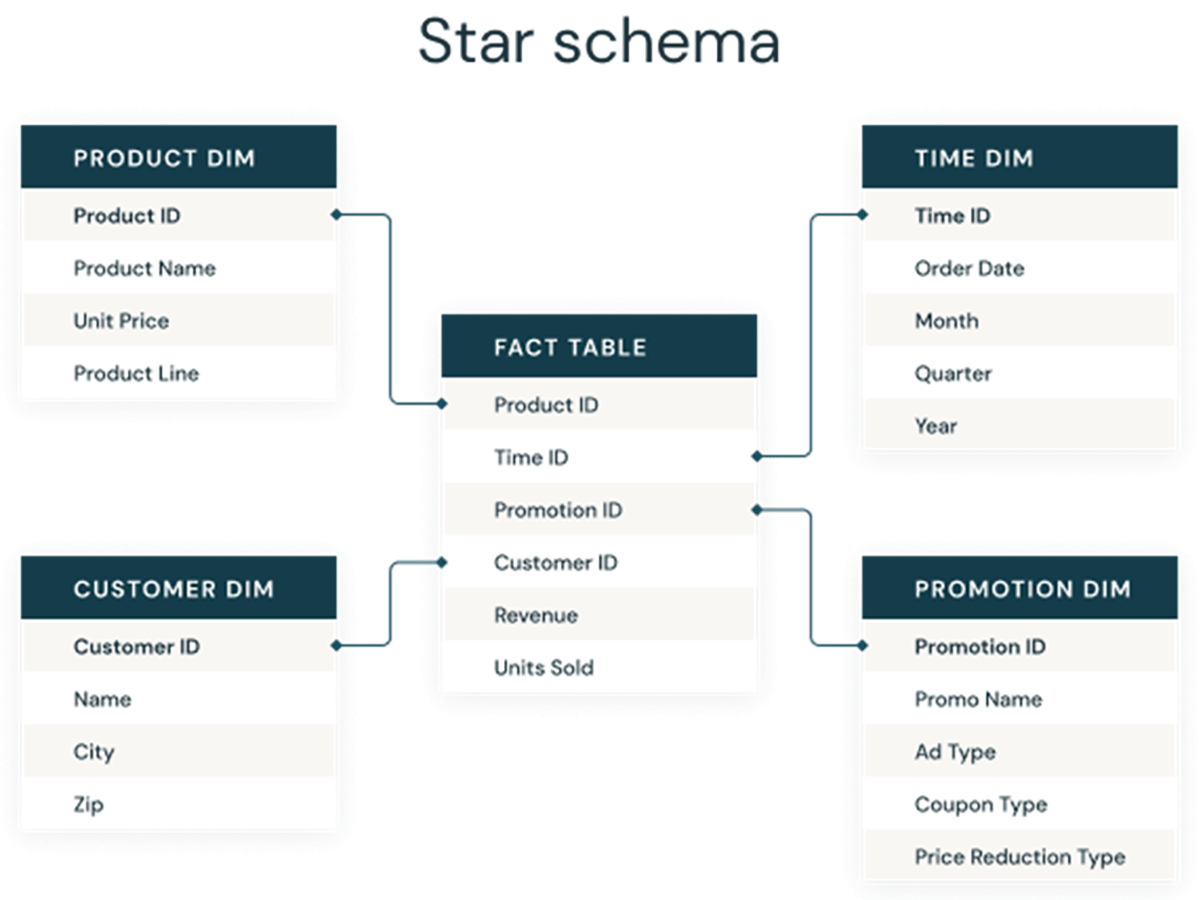
So, identity columns are used to create surrogate keys, which can serve as primary and foreign keys in dimensional models for data warehouses and data marts. As seen below, these keys are the columns that connect different tables to one another in a traditional dimensional model like a star schema.

A Star Schema Example

A Star Schema Example

Traditional approaches to generate surrogate keys on data lakes

Most big data technologies use parallelism, or the ability to divide a task into smaller parts that can be completed at the same time, to improve performance. In the early days of data lakes, there was no easy way to create unique sequences over a group of machines. This led to some data engineers using less reliable methods to generate surrogate keys without a proper feature, such as:

  • monotonically_increasing_id(),
  • row_number(),
  • Rank OVER,
  • ZipWithIndex(),
  • ZipWithUniqueIndex(),
  • Row Hash with hash(), and
  • Row Hash with md5().

While these functions are able to get the job done under certain circumstances, they are often fraught with many warnings and caveats around sparsely populating the sequences, performance issues at scale, and concurrent transaction issues.

Databases have been able to generate sequences since the early days, to generate surrogate keys to uniquely identify a row of data with the assistance of a centralized transaction manager. However, typical implementations require locks and transactional commits, which can be difficult to manage.

Identity columns on Delta Lake make generating surrogate keys easier

Identity columns solve the issues mentioned above and provide a simple, performant solution for generating surrogate keys. Delta Lake is the first data lake protocol to enable identity columns for surrogate key generation.

Delta Lake now supports creating IDENTITY columns that can automatically generate unique, auto-incrementing ID numbers when new rows are loaded. While these ID numbers may not be consecutive, Delta makes the best effort to keep the gap as small as possible. You can use this feature to create surrogate keys for your data warehousing workloads easily.

How to create a surrogate key with an identity column using SQL and Delta Lake

[Recommended] Generate Always As Identity

Creating an identity column in SQL is as simple as creating a Delta Lake table. When declaring your columns, add a column name called id, or whatever you like, with a data type of BIGINT, then enter GENERATED ALWAYS AS IDENTITY.

Now, every time you perform an operation on this table where you insert data, omit this column from the insert, and Delta Lake will automatically generate a unique value for the IDENTITY column for each row inserted into the Delta Lake table.

Here is a simple example of how to use identity columns in Delta Lake:

CREATE OR REPLACE TABLE demo (
  id BIGINT GENERATED ALWAYS AS IDENTITY,
  product_type STRING,
  sales BIGINT
);

Going forward, the identity column titled “id” will auto-increment whenever you insert new records into the table. You can then insert new data like so:

INSERT INTO demo (product_type, sales)
VALUES ("Batteries", 150000);

Notice how the surrogate key column titled “id” is missing from the INSERT part of the statement. Delta Lake will populate the surrogate keys when it writes the table to cloud object storage (e.g. AWS S3, Azure Data Lake Storage, or Google Cloud Storage). Learn more in the documentation.

Generate by DEFAULT

There is also the GENERATED BY DEFAULT AS IDENTITY option, which allows the identity insertion to be overridden, whereas the ALWAYS option cannot be overridden.

There are a few caveats you should keep in mind when adopting this new feature. Identity columns cannot be added to existing tables; the tables will need to be recreated with the new identity column added. To do this, simply create a new table DDL with the identity column, and insert the existing columns into the new table, and surrogate keys will be generated for the new table.

Get started with Identity Columns with Delta Lake on Databricks SQL today

Identity Columns are now GA (Generally Available) in Databricks Runtime 10.4+ and in Databricks SQL 2022.17+. With identity columns, you can now enable all your data warehousing workloads to have all the benefits of a Lakehouse architecture, accelerated by Photon. Try out identity columns on Databricks SQL today.

--

Try Databricks for free. Get started today.

The post Identity Columns to Generate Surrogate Keys Are Now Available in a Lakehouse Near You! appeared first on Databricks.

Near Real-Time Anomaly Detection with Delta Live Tables and Databricks Machine Learning

$
0
0

Why is Anomaly Detection Important?

Whether in retail, finance, cyber security, or any other industry, spotting anomalous behavior as soon as it happens is an absolute priority. The lack of capabilities to do so could mean lost revenue, fines from regulators, and violation of customer privacy and trust due to security breaches in the case of cyber security. Thus, finding that handful of rather unusual credit card transactions, spotting that one user acting suspiciously or identifying strange patterns in request volume to a web service, could be the difference between a great day at work and a complete disaster.

The Challenge in Detecting Anomalies

Anomaly detection poses several challenges. The first is the data science question of what an ‘anomaly’ looks like. Fortunately, machine learning has powerful tools to learn how to distinguish usual from anomalous patterns from data. In the case of anomaly detection, it is impossible to know what all anomalies look like, so it’s impossible to label a data set for training a machine learning model, even if resources for doing so are available. Thus, unsupervised learning has to be used to detect anomalies, where patterns are learned from unlabelled data.

Even with the perfect unsupervised machine learning model for anomaly detection figured out, in many ways, the real problems have only begun. What is the best way to put this model into production such that each observation is ingested, transformed and finally scored with the model, as soon as the data arrives from the source system? That too, in a near real-time manner or at short intervals, e.g. every 5-10 minutes? This involves building a sophisticated extract, load, and transform (ELT) pipeline and integrating it with an unsupervised machine learning model that can correctly identify anomalous records. Also, this end-to-end pipeline has to be production-grade, always running while ensuring data quality from ingestion to model inference, and the underlying infrastructure has to be maintained.

Solving the Challenge with the Databricks Lakehouse Platform

With Databricks, this process is not complicated. One could build a near-real-time anomaly detection pipeline entirely in SQL, with Python solely being used to train the machine learning model. The data ingestion, transformations, and model inference could all be done with SQL.

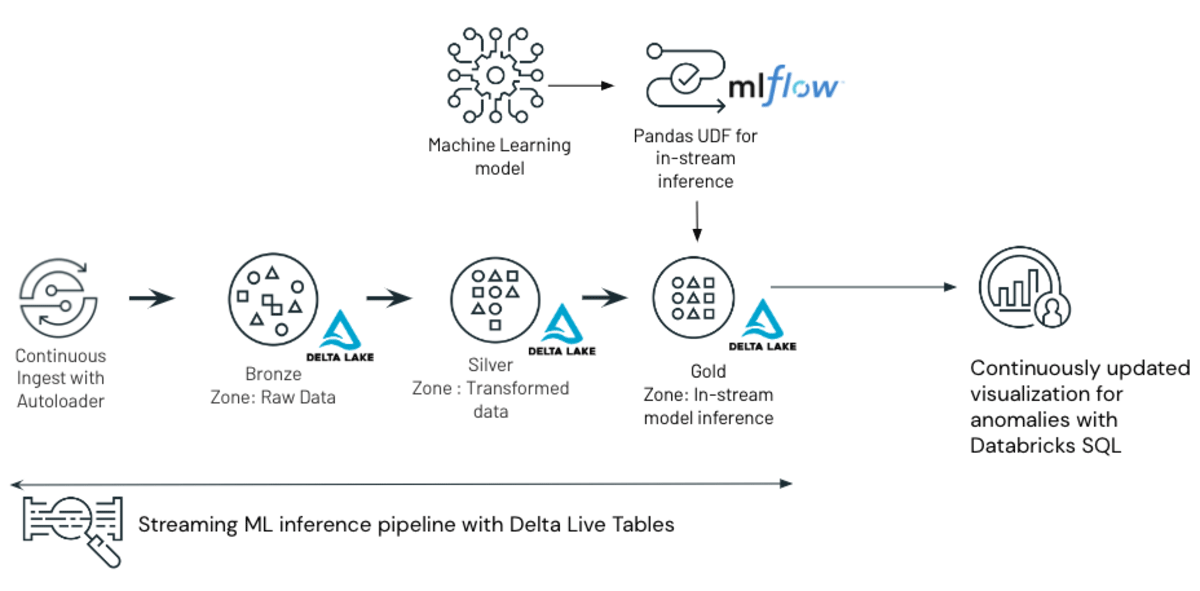
Specifically, this blog outlines training an isolation forest algorithm, which is particularly suited to detecting anomalous records, and integrating the trained model into a streaming data pipeline created using Delta Live Tables (DLT). DLT is an ETL framework that automates the data engineering process. DLT uses a simple declarative approach for creating reliable data pipelines and fully manages the underlying infrastructure at scale for batch and streaming data. The result is a near-real-time anomaly detection system. Specifically, the data used in this blog is a sample of synthetic data generated with the goal of simulating credit card transactions from Kaggle, and the anomalies thus detected are fraudulent transactions.

Architecture of the ML and Delta Live Tables based anomaly detection solution outlined in the blog

Architecture of the ML and Delta Live Tables based anomaly detection solution outlined in the blog

The scikit-learn isolation forest algorithm implementation is available by default in the Databricks Machine Learning runtime and will use the MLflow framework to track and log the anomaly detection model as it is trained. The ETL pipeline will be developed entirely in SQL using Delta Live Tables.

Isolation Forests For Anomaly Detection on Unlabelled Data

Isolation forests are a type of tree-based ensemble algorithms similar to random forests. The algorithm is designed to assume that inliers in a given set of observations are harder to isolate than outliers (anomalous observations). At a high level, a non-anomalous point, that is a regular credit card transaction, would live deeper in a decision tree as they are harder to isolate, and the inverse is true for an anomalous point. This algorithm can be trained on a label-less set of observations and subsequently used to predict anomalous records in previously unseen data.

Isolating an outlier is easier than isolating an inlier

Isolating an outlier is easier than isolating an inlier

How can Databricks Help in model training and tracking?

When doing anything machine learning related on Databricks, using clusters with the Machine Learning (ML) runtime is a must. Many open source libraries commonly used for data science and machine learning related tasks are available by default in the ML runtime. Scikit-learn is among those libraries, and it comes with an excellent implementation of the isolation forest algorithm.

How the model is defined can be seen below.


from sklearn.ensemble import IsolationForest
isolation_forest = IsolationForest(n_jobs=-1, warm_start=True, random_state=42)

This runtime, among other things, enables tight integration of the notebook environment with MLflow for machine learning experiment tracking, model staging, and deployment.

Any model training or hyperparameter optimization done in the notebook environment tied to a ML cluster is automatically logged with MLflow autologging, a functionality enabled by default.

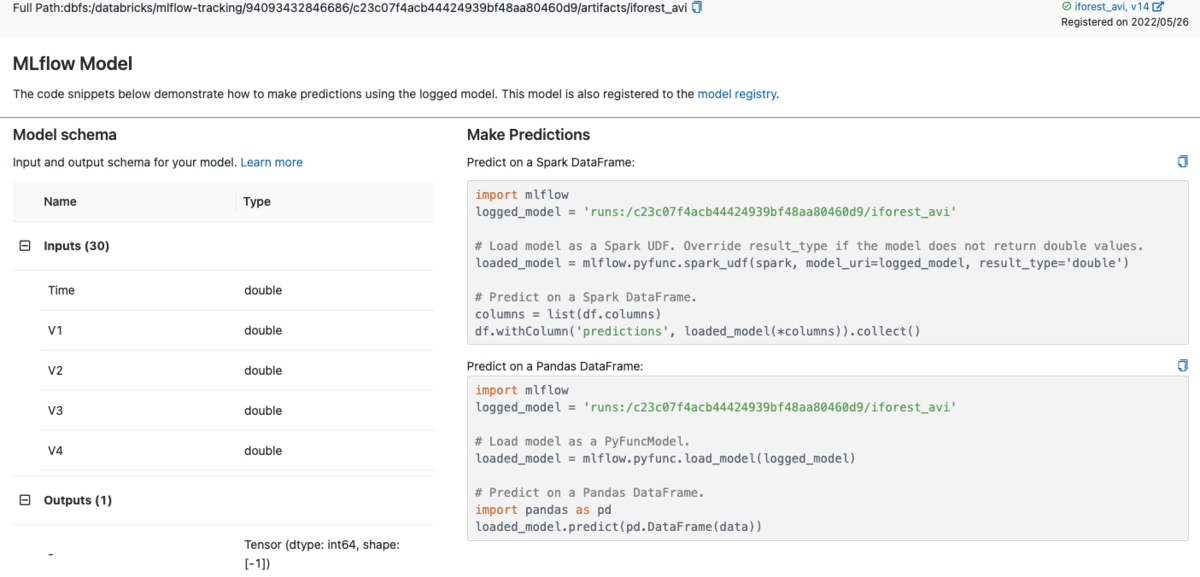
Once the model is logged, it is possible to register and deploy the model within MLflow in a number of ways. In particular, to deploy this model as a vectorized User Defined Function (UDF) for distributed in-stream or batch inference with Apache Spark™, MLflow generates the code for creating and registering the UDF within the user interface (UI) itself, as can be seen in the image below.

MLflow generates code for creating and registering the Apache Spark UDF for model  inference

MLflow generates code for creating and registering the Apache Spark UDF for model inference

In addition to this, the MLflow REST API allows the existing model in production to be archived and the newly trained model to be put into production with a few lines of code that can be neatly packed into a function as follows.


def train_model(mlFlowClient, loaded_model, model_name, run_name)->str:
  """
  Trains, logs, registers and promotes the model to production. Returns the URI of the model in prod
  """
  with mlflow.start_run(run_name=run_name) as run:

    # 0. Fit the model 
    loaded_model.fit(X_train)

    # 1. Get predictions 
    y_train_predict = loaded_model.predict(X_train)

    # 2. Create model signature 
    signature = infer_signature(X_train, y_train_predict)
    runID = run.info.run_id

    # 3. Log the model alongside the model signature 
    mlflow.sklearn.log_model(loaded_model, model_name, signature=signature, registered_model_name= model_name)

    # 4. Get the latest version of the model 
    model_version = mlFlowClient.get_latest_versions(model_name,stages=['None'])[0].version

    # 5. Transition the latest version of the model to production and archive the existing versions
    client.transition_model_version_stage(name= model_name, version = model_version, stage='Production', archive_existing_versions= True)


    return mlFlowClient.get_latest_versions(model_name, stages=["Production"])[0].source

In a production scenario, you would want a single record only to be scored by the model once. In Databricks, you can use the Auto Loader to guarantee this “exactly once” behavior. Auto Loader works with Delta Live Tables, Structured Streaming applications, either using Python or SQL.

Another important factor to consider is that the nature of anomalous occurrences, whether environmental or behavioral, changes with time. Hence, the model needs to be retrained on new data as it arrives.

The notebook with the model training logic can be productionized as a scheduled job in Databricks Workflows, which effectively retrains and puts into production the newest model each time the job is executed.

Achieving near real-time anomaly detection with Delta Live Tables

The machine learning aspect of this only presents a fraction of the challenge. Arguably, what’s more challenging is building a production-grade near real-time data pipeline that combines data ingestion, transformations and model inference. This process could be complex, time-consuming, and error-prone.

Building and maintaining the infrastructure to do this in an always-on capacity and error handling involves more software engineering know-how than data engineering. Also, data quality has to be ensured through the entire pipeline. Depending on the specific application, there could be added dimensions of complexity.

This is where Delta Live Tables (DLT) comes into the picture.

In DLT parlance, a notebook library is essentially a notebook that contains some or all of the code for the DLT pipeline. DLT pipelines may have more than one notebook’s associated with them, and each notebook may use either SQL or Python syntax. The first notebook library will contain the logic implemented in Python to fetch the model from the MLflow Model Registry and register the UDF so that the model inference function can be used once ingested records are featurized downstream in the pipeline. A helpful tip: in DLT Python notebooks, new packages must be installed with the %pip magic command in the first cell.

The second DLT library notebook can be composed of either Python or SQL syntax. To prove the versatility of DLT, we used SQL to perform the data ingestion, transformation and model inference. This notebook contains the actual data transformation logic which constitutes the pipeline.

The ingestion is done with Auto Loader, which can load data streamed into object storage incrementally. This is read into the bronze (raw data) table in the medallion architecture. Also, in the syntax given below, please note that the streaming live table is where data is continuously ingested from object storage. Auto Loader is configured to detect schema as the data is ingested. Auto Loader can also handle evolving schema, which will apply to many real-world anomaly detection scenarios.


CREATE OR REFRESH STREAMING LIVE TABLE transaction_readings_raw
COMMENT "The raw transaction readings, ingested from landing directory"
TBLPROPERTIES ("quality" = "bronze")
AS SELECT * FROM cloud_files("/FileStore/tables/transaction_landing_dir", "json", map("cloudFiles.inferColumnTypes", "true"))

DLT also allows you to define data quality constraints and provides the developer or analyst the ability to remediate any errors. If a given record does not meet a given constraint, DLT can retain the record, drop it or halt the pipeline entirely. In the example below, constraints are defined in one of the transformation steps that drop records if the transaction time or amount is not given.


CREATE OR REFRESH STREAMING LIVE TABLE transaction_readings_cleaned(
  CONSTRAINT valid_transaction_reading EXPECT (AMOUNT IS NOT NULL OR TIME IS NOT NULL) ON VIOLATION DROP ROW
)
TBLPROPERTIES ("quality" = "silver")

COMMENT "Drop all rows with nulls for Time and store these records in a silver delta table"
AS SELECT * FROM STREAM(live.transaction_readings_raw)

Delta Live Tables also supports User Defined Functions (UDFs). UDFs may be used for to enable model inference in a streaming DLT pipeline using SQL. In the below example, we areusing the previously registered Apache Spark™ Vectorized UDF that encapsulates the trained isolation forest model.


CREATE OR REFRESH STREAMING LIVE TABLE predictions
COMMENT "Use the isolation forest vectorized udf registered in the previous step to predict anomalous transaction readings"
TBLPROPERTIES ("quality" = "gold")
AS SELECT cust_id, detect_anomaly() as 
anomalous from STREAM(live.transaction_readings_cleaned)

This is exciting for SQL analysts and Data Engineers who prefer SQL as they can use a machine learning model trained by a data scientist in Python e.g. using scikit-learn, xgboost or any other machine learning library, for inference in an entirely SQL data pipeline!

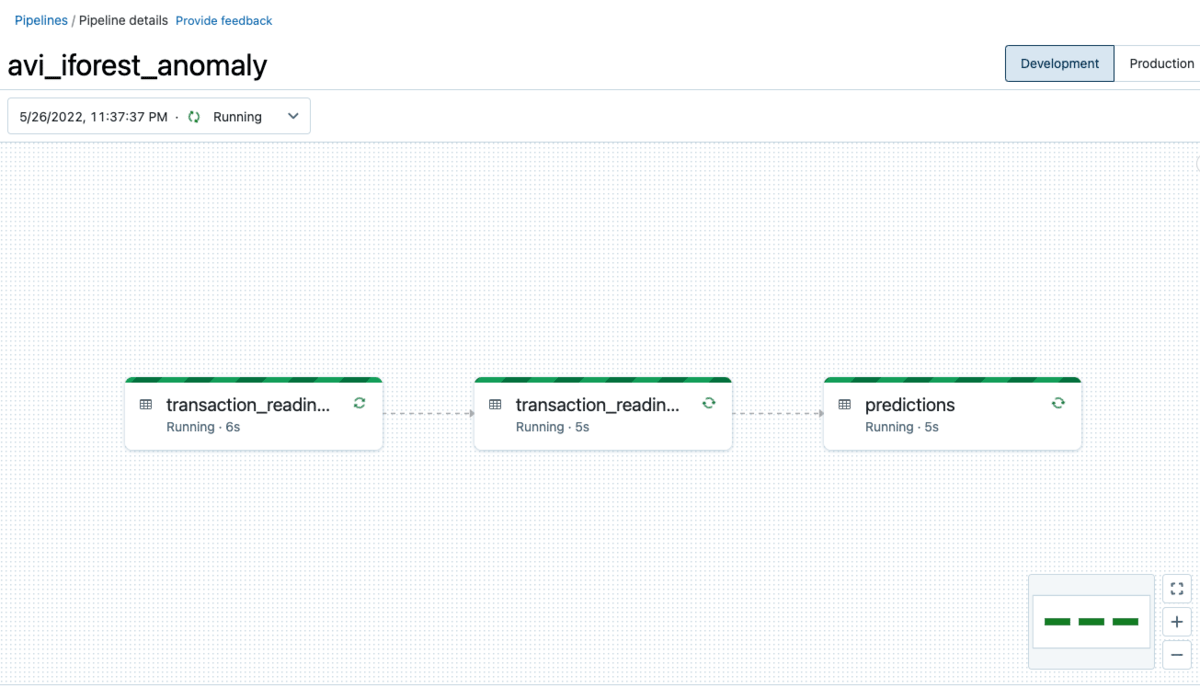
These notebooks are used to create a DLT pipeline (detailed in the Configuration Details section below ). After a brief period of setting up resources, tables and figuring out dependencies (and all the other complex operations DLT abstracts away from the end user), a DLT pipeline will be rendered in the UI, through which data is continuously processed and anomalous records are detected in near real time with a trained machine learning model.

End to End Delta Live Tables pipeline as seen in the DLT User Interface

End to End Delta Live Tables pipeline as seen in the DLT User Interface

While this pipeline is executing, Databricks SQL can be used to visualize the anomalous records thus identified, with continuous updates enabled by the Databricks SQL Dashboard refresh functionality. Such a dashboard built with visualized based on queries executed against the ‘Predictions’ table can be seen below.

Databricks SQL Dashboard built to interactively display predicted anomalous records

Databricks SQL Dashboard built to interactively display predicted anomalous records

In summary, this blog details the capabilities available in the Databricks Machine Learning and Workflows used to train an isolation forest algorithm for anomaly detection and the process of defining a Delta Live Table pipeline which is capable of performing this feat in a near real-time manner. Delta Live Tables abstracts the complexity of the process from the end user and automates it.

This blog only scratched the surface of the full capabilities of Delta Live Tables. Easily digestible documentation is provided on this key Databricks functionality at: https://docs.databricks.com/data-engineering/delta-live-tables/index.html

Best Practices

A Delta Live Tables pipeline can be created using the Databricks Workflows user interface

A Delta Live Tables pipeline can be created using the Databricks Workflows user interface

To perform anomaly detection in a near real time manner, a DLT pipeline has to be executed in Continuous Mode. The process described in the official quickstart (https://docs.databricks.com/data-engineering/delta-live-tables/delta-live-tables-quickstart.html ) can be followed to create, with the previously described Python and SQL notebooks which are available in the repository for this blog. Other configurations can be filled in as desired.

In use cases where intermittent pipeline runs are acceptable, for example, anomaly detection on records collected by a source system in batch, the pipeline can be executed in Triggered mode, with intervals as low as 10 minutes. Then a schedule can be specified for this triggered pipeline to run and in each execution, the data will be processed through the pipeline in an incremental manner.

Subsequently, the pipeline configuration with cluster autoscaling enabled (to handle varying load of records being passed through the pipeline without processing bottlenecks) can be saved and the pipeline started. Alternatively, all these configurations can be neatly described in JSON format and entered in the same input form.

Delta Live Tables figures out cluster configurations, underlying table optimizations and a number of other important details for the end user. For running the pipeline, Development mode can be selected, which is conducive for iterative development or Production mode, which is geared towards production. In the latter, DLT automatically performs retries and cluster restarts.

It is important to emphasize that all that is described above can be done via the Delta Live Tables REST API. This is particularly useful for production scenarios where the DLT pipeline executing in continuous mode can be edited on the fly with no downtime, for example each time the isolation forest is retrained via a scheduled job as mentioned earlier in this blog.

Configurations for the Delta Live Tables pipelines in this example. Enter a target database name to store the Delta tables created

Configurations for the Delta Live Tables pipelines in this example. Enter a target database name to store the Delta tables created

Build your own with Databricks

The notebooks and step by step instructions for recreating this solution are all included in the following repository: https://github.com/sathishgang-db/anomaly_detection_using_databricks.

Please make sure to use clusters with the Databricks Machine Learning runtime for model training tasks. Although the example given here is rather simplistic, the same principles hold for more complicated transformations and Delta Live Tables was built to reduce the complexity inherent in building such pipelines. We welcome you to adapt the ideas in this blog for your use case.

In addition to this:
An excellent demo and walkthrough of DLT functionality can be found here: https://www.youtube.com/watch?v=BIxwoO65ylY&t=1s

A comprehensive end-to-end Machine Learning workflow on Databricks can be found here:
https://www.youtube.com/watch?v=5CpaimNhMzs

--

Try Databricks for free. Get started today.

The post Near Real-Time Anomaly Detection with Delta Live Tables and Databricks Machine Learning appeared first on Databricks.

Low-latency Streaming Data Pipelines with Delta Live Tables and Apache Kafka

$
0
0

Delta Live Tables (DLT) is the first ETL framework that uses a simple declarative approach for creating reliable data pipelines and fully manages the underlying infrastructure at scale for batch and streaming data. Many use cases require actionable insights derived from near real-time data. Delta Live Tables enables low-latency streaming data pipelines to support such use cases with low latencies by directly ingesting data from event buses like Apache Kafka, AWS Kinesis, Confluent Cloud, Amazon MSK, or Azure Event Hubs.

This article will walk through using DLT with Apache Kafka while providing the required Python code to ingest streams. The recommended system architecture will be explained, and related DLT settings worth considering will be explored along the way.

Streaming platforms

Event buses or message buses decouple message producers from consumers. A popular streaming use case is the collection of click-through data from users navigating a website where every user interaction is stored as an event in Apache Kafka. The event stream from Kafka is then used for real-time streaming data analytics. Multiple message consumers can read the same data from Kafka and use the data to learn about audience interests, conversion rates, and bounce reasons. The real-time, streaming event data from the user interactions often also needs to be correlated with actual purchases stored in a billing database.

Apache Kafka

Apache Kafka is a popular open source event bus. Kafka uses the concept of a topic, an append-only distributed log of events where messages are buffered for a certain amount of time. Although messages in Kafka are not deleted once they are consumed, they are also not stored indefinitely. The message retention for Kafka can be configured per topic and defaults to 7 days. Expired messages will be deleted eventually.

This article is centered around Apache Kafka; however, the concepts discussed also apply to many other event busses or messaging systems.

Streaming data pipelines

In a data flow pipeline, Delta Live Tables and their dependencies can be declared with a standard SQL Create Table As Select (CTAS) statement and the DLT keyword “live.”

When developing DLT with Python, the @dlt.table decorator is used to create a Delta Live Table. To ensure the data quality in a pipeline, DLT uses Expectations which are simple SQL constraints clauses that define the pipeline’s behavior with invalid records.

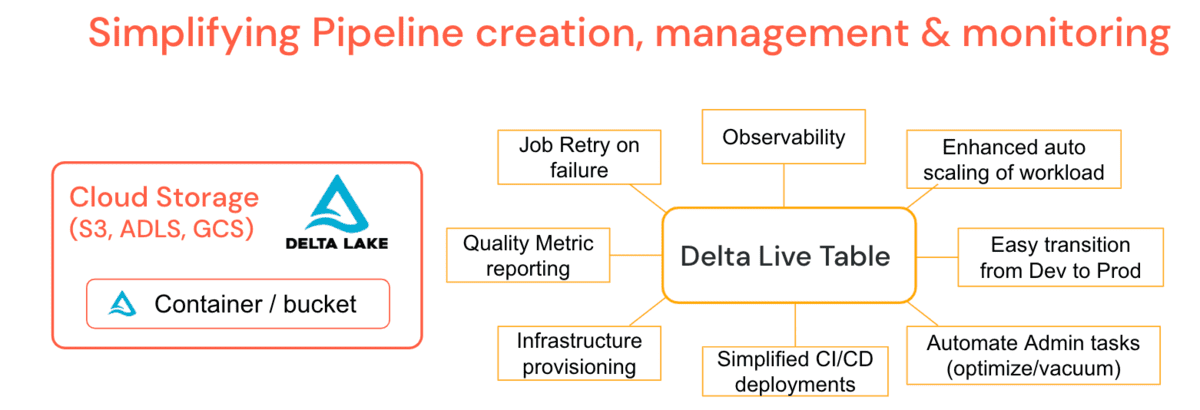
Since streaming workloads often come with unpredictable data volumes, Databricks employs enhanced autoscaling for data flow pipelines to minimize the overall end-to-end latency while reducing cost by shutting down unnecessary infrastructure.

Delta Live Tables are fully recomputed, in the right order, exactly once for each pipeline run.

In contrast, streaming Delta Live Tables are stateful, incrementally computed and only process data that has been added since the last pipeline run. If the query which defines a streaming live tables changes, new data will be processed based on the new query but existing data is not recomputed. Streaming live tables always use a streaming source and only work over append-only streams, such as Kafka, Kinesis, or Auto Loader. Streaming DLTs are based on top of Spark Structured Streaming.

You can chain multiple streaming pipelines, for example, workloads with very large data volume and low latency requirements.

Direct Ingestion from Streaming Engines

Delta Live Tables written in Python can directly ingest data from an event bus like Kafka using Spark Structured Streaming. You can set a short retention period for the Kafka topic to avoid compliance issues, reduce costs and then benefit from the cheap, elastic and governable storage that Delta provides.

As a first step in the pipeline, we recommend ingesting the data as is to a bronze (raw) table and avoid complex transformations that could drop important data. Like any Delta Table the bronze table will retain the history and allow to perform GDPR and other compliance tasks.

Ingest streaming data from Apache Kafka

Ingest streaming data from Apache Kafka

When writing DLT pipelines in Python, you use the @dlt.table annotation to create a DLT table. There is no special attribute to mark streaming DLTs in Python; simply use spark.readStream() to access the stream. Example code for creating a DLT table with the name kafka_bronze that is consuming data from a Kafka topic looks as follows:

import dlt
from pyspark.sql.functions import *
from pyspark.sql.types import *

TOPIC = "tracker-events"
KAFKA_BROKER = spark.conf.get("KAFKA_SERVER")
# subscribe to TOPIC at KAFKA_BROKER
raw_kafka_events = (spark.readStream
    .format("kafka")
    .option("subscribe", TOPIC)
    .option("kafka.bootstrap.servers", KAFKA_BROKER)
    .option("startingOffsets", "earliest")
    .load()
    )

@dlt.table(table_properties={"pipelines.reset.allowed":"false"})
def kafka_bronze():
  return raw_kafka_events

pipelines.reset.allowed

Note that event buses typically expire messages after a certain period of time, whereas Delta is designed for infinite retention.

This might lead to the effect that source data on Kafka has already been deleted when running a full refresh for a DLT pipeline. In this case, not all historic data could be backfilled from the messaging platform, and data would be missing in DLT tables. To prevent dropping data, use the following DLT table property:

pipelines.reset.allowed=false

Setting pipelines.reset.allowed to false prevents refreshes to the table but does not prevent incremental writes to the tables or new data from flowing into the table.

Checkpointing

If you are an experienced Spark Structured Streaming developer, you will notice the absence of checkpointing in the above code. In Spark Structured Streaming checkpointing is required to persist progress information about what data has been successfully processed and upon failure, this metadata is used to restart a failed query exactly where it left off.

Whereas checkpoints are necessary for failure recovery with exactly-once guarantees in Spark Structured Streaming, DLT handles state automatically without any manual configuration or explicit checkpointing required.

Mixing SQL and Python for a DLT Pipeline

A DLT pipeline can consist of multiple notebooks but one DLT notebook is required to be either entirely written in SQL or Python (unlike other Databricks notebooks where you can have cells of different languages in a single notebook).

Now, if your preference is SQL, you can code the data ingestion from Apache Kafka in one notebook in Python and then implement the transformation logic of your data pipelines in another notebook in SQL.

Schema mapping

When reading data from messaging platform, the data stream is opaque and a schema has to be provided.

The Python example below shows the schema definition of events from a fitness tracker, and how the value part of the Kafka message is mapped to that schema.

event_schema = StructType([ \
    StructField("time", TimestampType(),True)      , \
    StructField("version", StringType(),True), \
    StructField("model", StringType(),True)     , \
    StructField("heart_bpm", IntegerType(),True), \
    StructField("kcal", IntegerType(),True)       \
  ])


# temporary table, visible in pipeline but not in data browser, 
# cannot be queried interactively
@dlt.table(comment="real schema for Kakfa payload",
           temporary=True)


def kafka_silver():
  return (
    # kafka streams are (timestamp,value)
    # value contains the kafka payload
        
    dlt.read_stream("kafka_bronze")
    .select(col("timestamp"),from_json(col("value")
    .cast("string"), event_schema).alias("event"))
    .select("timestamp", "event.*")     
  )

Benefits

Reading streaming data in DLT directly from a message broker minimizes the architectural complexity and provides lower end-to-end latency since data is directly streamed from the messaging broker and no intermediary step is involved.

Streaming Ingest with Cloud Object Store Intermediary

For some specific use cases you may want offload data from Apache Kafka, e.g., using a Kafka connector, and store your streaming data in a cloud object intermediary. In a Databricks workspace, the cloud vendor-specific object-store can then be mapped via the Databricks Files System (DBFS) as a cloud-independent folder. Once the data is offloaded, Databricks Auto Loader can ingest the files.

Streaming Ingest with Cloud Object Store Intermediary

Auto Loader can ingest data with with a single line of SQL code. The syntax to ingest JSON files into a DLT table is shown below (it is wrapped across two lines for readability).

-- INGEST with Auto Loader
create or replace streaming live table raw
as select * FROM cloud_files("dbfs:/data/twitter", "json")

Note that Auto Loader itself is a streaming data source and all newly arrived files will be processed exactly once, hence the streaming keyword for the raw table that indicates data is ingested incrementally to that table.

Since offloading streaming data to a cloud object store introduces an additional step in your system architecture it will also increase the end-to-end latency and create additional storage costs. Keep in mind that the Kafka connector writing event data to the cloud object store needs to be managed, increasing operational complexity.

Therefore Databricks recommends as a best practice to directly access event bus data from DLT using Spark Structured Streaming as described above.

Other Event Buses or Messaging Systems

This article is centered around Apache Kafka; however, the concepts discussed also apply to other event buses or messaging systems. DLT supports any data source that Databricks Runtime directly supports.

Amazon Kinesis

In Kinesis, you write messages to a fully managed serverless stream. Same as Kafka, Kinesis does not permanently store messages. The default message retention in Kinesis is one day.

When using Amazon Kinesis, replace format("kafka") with format("kinesis") in the Python code for streaming ingestion above and add Amazon Kinesis-specific settings with option(). For more information, check the section about Kinesis Integration in the Spark Structured Streaming documentation.

Azure Event Hubs

For Azure Event Hubs settings, check the official documentation at Microsoft and the article Delta Live Tables recipes: Consuming from Azure Event Hubs.

Summary

DLT is much more than just the “T” in ETL. With DLT, you can easily ingest from streaming and batch sources, cleanse and transform data on the Databricks Lakehouse Platform on any cloud with guaranteed data quality.

Data from Apache Kafka can be ingested by directly connecting to a Kafka broker from a DLT notebook in Python. Data loss can be prevented for a full pipeline refresh even when the source data in the Kafka streaming layer expired.

Get started

If you are a Databricks customer, simply follow the guide to get started. Read the release notes to learn more about what’s included in this GA release. If you are not an existing Databricks customer, sign up for a free trial, and you can view our detailed DLT Pricing here.

Join the conversation in the Databricks Community where data-obsessed peers are chatting about Data + AI Summit 2022 announcements and updates. Learn. Network.

Last but not least, enjoy the Dive Deeper into Data Engineering session from the summit. In that session, I walk you through the code of another streaming data example with a Twitter live stream, Auto Loader, Delta Live Tables in SQL, and Hugging Face sentiment analysis.

--

Try Databricks for free. Get started today.

The post Low-latency Streaming Data Pipelines with Delta Live Tables and Apache Kafka appeared first on Databricks.

Databricks and Jupyter: Announcing ipywidgets in the Databricks Notebook

$
0
0

Today, we are excited to announce a deeper integration between the Databricks Notebook and the ecosystem established by Project Jupyter, a leader in the scientific computing community that has been responsible for the definition of open standards and software for interactive computing. With the release of Databricks Runtime 11.0 (DBR 11.0), the Databricks Notebook now supports ipywidgets (a.k.a., Jupyter Widgets) and the foundational Python execution engine powering the Jupyter ecosystem, the IPython kernel.

At Databricks, we are committed to making the Lakehouse the ultimate destination for creating and sharing data insights. We want to make it as simple as possible for users of all backgrounds to turn the data in their Lakehouse into business value, and we believe a major part of this is enabling users to easily enrich their analyses and data assets with interactivity. Our integration of ipywidgets represents a big step toward realizing this vision, and we look forward to seeing what our users create with them!

ipywidgets

The ipywidgets package, included in DBR 11.0 as a public preview on AWS and Azure and coming to GCP with DBR 11.1, enables a user to add graphical controls to their notebooks to visualize and interact with data. For example, we can use ipywidgets’ interact function to automatically construct a graphical user interface to explore how different inputs change its output.

ipython widgets

Using the many components that come with ipywidgets (sliders, buttons, checkboxes, dropdowns, tabs, and more), you can build custom user interfaces to modify variables, execute code, and visualize results directly in your notebooks. This is just the beginning, however; the real power of ipywidgets is the framework it provides for building more complex controls and interactions. Now that the Databricks Notebook supports ipywidgets, you can also use more advanced widgets like the plotly charting widget and the ipyleaflet map widget that enable you to immersively visualize and interact with data by visually selecting data points or drawing regions on a map.

Ipyleaflet in the Databricks Notebook

Ipyleaflet in the Databricks Notebook

As an example, here is a notebook that uses ipyleaflet to visualize farmers market locations from a Databricks dataset.

Ipywidgets will become the recommended way to create interactive controls when using Python in the Databricks Notebook. The Databricks Notebook in DBR 11.0 brings to public preview support for the core ipywidget controls and the plotly, ipyleaflet, and ipyslickgrid custom widget packages. Note that when you are passing parameters into a notebook or into jobs, we still recommend using the Databricks widgets syntax.

You can find more examples in the Databricks documentation or the official ipywidgets documentation, and you can find a variety of advanced ipywidgets examples in the official directory of ipywidgets examples. We are excited to add support for more of these advanced widgets in the coming months. One we are especially excited about is bamboolib, and we will have more to say about it and its integration into the Databricks Notebook very soon.

IPython Kernel

As part of DBR 11.0, Databricks also adopts the IPython kernel execution engine for its notebooks, replacing the custom Python execution engine Databricks has used for many years. Using the IPython kernel more closely aligns the Databricks Notebook with the Jupyter standards and ecosystem, in particular powering ipywidgets in the Notebook, and we are excited to contribute improvements to the project.

Databricks supports Project Jupyter

As a company which was built on open source technologies and has established open source projects like mlflow and Delta Lake, Databricks understands the importance of healthy open source communities. This is why we have become a Project Jupyter institutional partner, sponsoring Jupyter (and ipywidgets) development, and it is why Databricks engineers contribute improvements and bugfixes to Jupyter projects. We are excited to grow our involvement in the Jupyter ecosystem and continue bringing its capabilities to users of the Databricks Notebook.

Try it out

To try out ipywidgets in the Databricks Notebook on either AWS or Azure, all you need to do is choose a compute resource running DBR 11.0 or greater and import the ipywidgets package. It will also be accessible on GCP with the release of DBR 11.1 or greater. See our documentation for more information and examples.

If you would like to see further Jupyter ecosystem features and widgets added to Databricks, please let us know!

--

Try Databricks for free. Get started today.

The post Databricks and Jupyter: Announcing ipywidgets in the Databricks Notebook appeared first on Databricks.

Orchestrating Data and ML Workloads at Scale: Create and Manage Up to 10k Jobs Per Workspace

$
0
0

Databricks Workflows is the fully-managed orchestrator for data, analytics, and AI. Today, we are happy to announce several enhancements that make it easier to bring the most demanding data and ML/AI workloads to the cloud.

Workflows offers high reliability across multiple major cloud providers: GCP, AWS, and Azure. Until today, this meant limiting the number of jobs that can be managed in a Databricks workspace to 1000 (number varied based on tier). Customers running more data and ML/AI workloads had to partition jobs across workspaces in order to avoid running into platform limits. Today, we are happy to announce that we are significantly increasing this limit to 10,000. The new platform limit is automatically available in all customer workspaces (except single-tenant).

Thousands of customers rely on the Jobs API to create and manage jobs from their applications, including CI/CD systems. Together with the increased job limit, we have introduced a faster, paginated version of the jobs/list API and added pagination to the jobs page.

List of jobs with pagination

List of jobs with pagination

The higher workspace limit also comes with a streamlined search experience which allows searching by name, tags, and job ID.

Streamlined search by name, tag or job ID.

Streamlined search by name, tag or job ID.

Put together, the new features allow scaling workspaces to a large number of jobs. For rare cases where the changes in behavior above are not desired, it is possible to revert to the old behavior via the Admin Console (only possible for workspaces with up to 3000 jobs). We strongly recommend that all customers switch to the new paginated API to list jobs, especially for workspaces with thousands of saved jobs.

To get started with Databricks Workflows, see the quickstart guide. We’d also love to hear from you about your experience and any other features you’d like to see.

Learn more about:

--

Try Databricks for free. Get started today.

The post Orchestrating Data and ML Workloads at Scale: Create and Manage Up to 10k Jobs Per Workspace appeared first on Databricks.

Announcing Brickbuilder Solutions for Migrations

$
0
0

Today, we’re excited to announce that Databricks has collaborated with key partners globally to launch the first Brickbuilder Solutions for migrations to the Databricks Lakehouse Platform. By combining the migration expertise of our partner ecosystem with the Databricks Lakehouse Platform, our new solutions help businesses migrate to one simple platform to handle all their data, analytics and AI use cases.

Earlier this year, Databricks announced Brickbuilder Solutions, data and AI solutions expertly designed by leading consulting companies to address industry-specific business requirements.* Backed by our partner’s industry experience — and built on the Databricks Lakehouse Platform — Brickbuilder Solutions are designed to fit within any stage of a customers’ journey to reduce costs and accelerate time to value.

Let’s take a further look into our new migration Brickbuilder Solutions.

Migrate to lakehouse to drive innovation and business outcomes

Fig. 1: Reduce the risks associated with data system migrations through migration Brickbuilder Solutions.

Fig. 1: Reduce the risks associated with data system migrations through migration Brickbuilder Solutions.

Migrating from on-premise to a modern cloud data platform can be complex, but ultimately makes it easier to streamline operations and improve productivity. Databricks has partnered with leading consulting partners to help you retire legacy infrastructure and adopt a simple and open lakehouse architecture. Collectively, these partners have completed hundreds of migrations from on-premise to Databricks and are equipped to help you reduce the risks associated with data system migrations. Now, you can scale to meet the changing needs of your business without requiring excess capacity or hardware upgrades.

  1. Azure Databricks is a key enabler for helping organizations scale AI and unlock the value of disparate and complex data. To achieve your AI aspirations and uncover insights that inform better decisions, you can migrate your data to a modern, state-of-the-art data platform and turn it into action and value. If you are looking to accelerate data transformation, the Avanade Legacy System Migration can help you quickly move your data from proprietary and expensive legacy systems to the lakehouse to drive operational efficiencies and speed up innovation.
  2. Capgemini’s Data Migration Methodology (DMM) uses an industrialized data migration factory to help you streamline data migration to the cloud and Databricks. DMM ensures that the cloud architecture and migration patterns are aligned to your cloud ambitions, while industrial methods, tooling and automation drive high-quality and cost-efficient migration. Furthermore, Capgemini helps you offset the costs of the assessment so you can jumpstart your journey through a comprehensive roadmap, which leverages Capgemini’s best-in-class eAPM assessment tool. This provides unparalleled insight into your IT portfolio, addresses gaps in your readiness, and leverages cloud-based services to modernize your landscape so you can save up to 25% once in production.
  3. The ability to migrate and integrate monolithic mainframe-based Cards and Core Banking into modern tech stacks on cloud is critical for retail banks in today’s competitive market. Capgemini’s solution for migrating Legacy Cards and Core Banking Portfolios on Databricks enables rapid conversion from external source systems and provides a fully configurable and industrialized conversion capability. Leveraging Public Cloud services, this solution provides a cost-efficient conversion platform with predictable time to market. Now, you can rapidly complete ingestion, ease development of ETL jobs, and completely reconcile and validate conversion up to 50% faster.
  4. Celebal Technologies offers proven tools and accelerators to help you migrate from from Hadoop or Snowflake and integrate SAP to the Databricks Lakehouse. Their solution for migrating to Databricks from an on-premise/cloud Hadoop environment addresses the key challenges of scalability, performance, and workload diversity to enable comprehensive analytics. By leveraging the capabilities of the Databricks Lakehouse Platform, they also help leading enterprises with a SAP BW or HANA footprint to optimize their data processing with comprehensive analytics solutions. Lastly, they can help you migrate from Snowflake to Databricks to significantly reduce costs and increase performance, including up to 40% in costs and 60% in time due to automatic schema and data migration.
    Fig. 2: Celebal Technologies solution for migrating to Databricks helps businesses move from Hadoop, SAP, or Snowflake to the lakehouse.

    Fig. 2: Celebal Technologies solution for migrating to Databricks helps businesses move from Hadoop, SAP, or Snowflake to the lakehouse.

  5. While SAS has been a dominant player in legacy platforms, the emergence of new technologies has made open-source technologies a desired alternative. The Deloitte SAS Migration Factory provides intelligent code analysis, classification, and conversion tools that take a given set of SAS programs and categorizes and converts them to open source Python, PySpark, or Scala. The Deloitte SAS Migration Factory accelerates migrations to Databricks with improved quality and is made up of three components: Classifier, Reverse Engineer, and Conversion Enabler. This tool, when combined with Deloitte’s migration services, remediates the common challenges faced by clients for legacy SAS code into open source code, resulting in improved business ROI and a much faster time to value.
  6. LeapLogic – an Impetus solution – auto-transforms legacy ETL, data warehouse, analytics and Hadoop workloads to modern data infrastructure on Databricks. Impetus offers engineering services to accelerate, optimize, re-architect, and scale on Databricks. This allows 70-90% of legacy code, scripts and business logic to be automatically transformed into production-ready output. Now, your transformation to Databricks will happen faster and more accurately, thanks to the analysis, automation, and validation of LeapLogic.
    Fig. 3: LeapLogic - an Impetus solution- auto-transforms legacy ETL, data warehouse, analytics and Hadoop workloads to modern data infrastructure on Databricks.

    Fig. 3: LeapLogic – an Impetus solution- auto-transforms legacy ETL, data warehouse, analytics and Hadoop workloads to modern data infrastructure on Databricks.

  7. Infosys Data Wizard is a comprehensive solution with a set of accelerators for seamless data migration. It makes data warehouse and data lake migrations to the Databricks Lakehouse Platform seamless, secure, manageable and quick. Data Wizard offers an intuitive graphical user interface designed to follow execution approaches through different phases of migration — from project initiation to configuration, inventory collection, analysis, migration, validation, all the way to data certification, tracking and management. With Infosys Data Wizard, you can achieve a 50%–60% acceleration in the data migration lifecycle and a 30% reduction in the cost of migrations.
  8. Lovelytics Snowflake-to-Databricks Migration Solution ensures a rapid, sound migration process that leverages Databricks to unlock more value from data and AI. This five-step migration accelerator helps customers confidently move from Snowflake to Databricks to unlock the value of Databricks best-in-class SQL performance, native ML capabilities and ML lifecycle management, including real streaming data use cases. With the Lovelytics migration accelerator, you can realize 2.7x average faster performance and 12x more cost efficiency than Snowflake.
  9. Tensile AI’s SAS Migration Accelerator enables the rapid migration of SAS processes with minimal disruption and risk to internal teams. Using the Migration Accelerator, organizations have the flexibility to simply move critical workloads from SAS to Databricks, or optimize the code and patterns of those workloads to run natively in Databricks. Tensile AI has extensive experience leading large-scale migration and modernization initiatives. Typical improvements include cost reduction of ~35% and process performance gains of ~85%.
  10. FullStride Data Platform by Wipro enables end-to-end automation of the cloud migration and transformation journey (including Hadoop, EDW, ETL and SAS workload migrations) across Azure, AWS and GCP with a suite of low-code/no code and AI/ML infused accelerators. The FullStride Data Platform helps with assessment of the existing landscape, migration planning, automated data movement and validation. With the Wipro FullStride Data Platform, you can achieve up to 20%-30% reduction in total cost of ownership, an average of 50% productivity gains in migration efforts, and savings for large migrations of ~20%-35%.

See more Brickbuilder solutions

At Databricks, we continue to collaborate with our consulting partner ecosystem to enable even more use cases across key industries and migrations. Check out our full set of partner solutions on the Databricks Brickbuilder Solutions page.

Create Brickbuilder solutions for the Databricks Lakehouse Platform

Brickbuilder Solutions is a key component of the Databricks Partner Program and recognizes partners who have demonstrated a unique ability to offer differentiated lakehouse industry and migration solutions in combination with their knowledge and expertise.

Partners who are interested in learning more about how to create a Brickbuilder Solution are encouraged to email us at partners@databricks.com.

*We have collaborated with consulting and system integrator (C&SI) partners to develop industry and migration solutions to address data engineering, data science, machine learning and business analytics use cases.

--

Try Databricks for free. Get started today.

The post Announcing Brickbuilder Solutions for Migrations appeared first on Databricks.

MLOps on Databricks with Vertex AI on Google Cloud

$
0
0

Since the launch of Databricks on Google Cloud in early 2021, Databricks and Google Cloud have been partnering together to further integrate the Databricks platform into the cloud ecosystem and its native services. Databricks is built on or tightly integrated with many Google Cloud native services today, including Cloud Storage, Google Kubernetes Engine, and BigQuery. Databricks and Google Cloud are excited to announce an MLflow and Vertex AI deployment plugin to accelerate the model development lifecycle.

Why is MLOps difficult today?

The standard DevOps practices adopted by software companies that allow for rapid iteration and experimentation often do not translate well to data scientists. Those practices include both human and technological concepts such as workflow management, source control, artifact management, and CICD. Given the added complexity of the nature of machine learning (model tracking and model drift), MLOps is difficult to put into practice today, and a good MLOps process needs the right tooling.

Today’s machine learning (ML) ecosystem includes a diverse set of tools that might specialize and serve a portion of the ML lifecycle, but not many provide a full end to end solution – this is why Databricks teamed up with Google Cloud to build a seamless integration that leverages the best of MLflow and Vertex AI to allow Data Scientists to safely train their models, Machine Learning Engineers to productionalize and serve that model, and Model Consumers to get their predictions for business needs.

MLflow is an open source library developed by Databricks to manage the full ML lifecycle, including experimentation, reproducibility, deployment, and a central model registry. Vertex AI is Google Cloud’s unified artificial intelligence platform that offers an end-to-end ML solution, from model training to model deployment. Data scientists and machine learning engineers will be able to deploy their models into production on Vertex AI for real-time model serving using pre-built Prediction images and ensuring model quality and freshness using model monitoring tools thanks to this new plugin, which allows them to train their models on Databricks’ Managed MLflow while utilizing the power of Apache Spark™ and open source Delta Lake (as well as its packaged ML Runtime, AutoML, and Model Registry).

Note: The plugin also has been tested and works well with open source MLflow.

Technical Demo

Let’s show you how to build an end-to-end MLOps solution using MLflow and Vertex AI. We will train a simple scikit-learn diabetes model with MLflow, save it into the Model Registry, and deploy it into a Vertex AI endpoint.

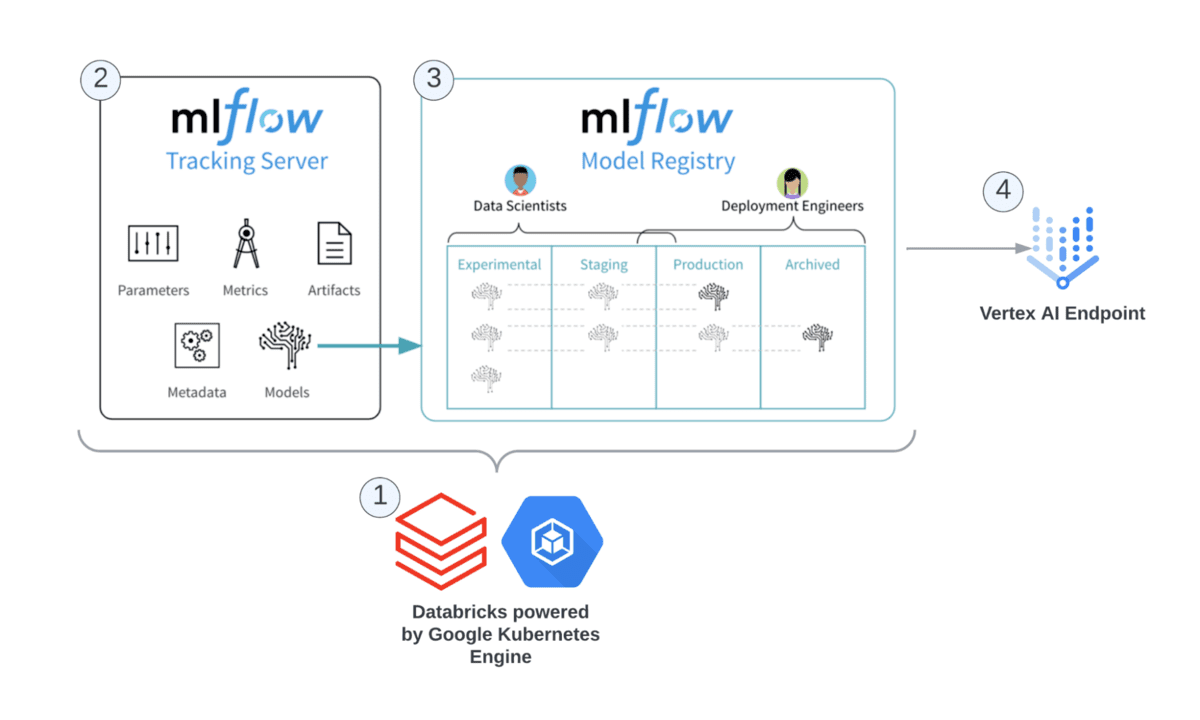
Before we begin, it’s important to understand what goes on behind the scenes when using this integration. Looking at the reference architecture below, you can see the Databricks components and Google Cloud services used for this integration:


End-to-end MLOps solution using MLflow and Vertex AI

Note: The following steps will assume that you have a Databricks Google Cloud workspace deployed with the right permissions to Vertex AI and Cloud Build set up on Google Cloud.

Step 1: Create a Service Account with the right permissions to access Vertex AI resources and attach it to your cluster with MLR 10.x.

Step 2: Download the google-cloud-mlflow plugin from PyPi onto your cluster. You can do this by downloading directly onto your cluster as a library or run the following pip command in a notebook attached to your cluster:

%pip install google-cloud-mlflow

Step 3: In your notebook, import the following packages:

import mlflow
from mlflow.deployments import get_deploy_client
from sklearn.model_selection import train_test_split
from sklearn.datasets import load_diabetes 
from sklearn.ensemble import RandomForestRegressor
import pandas as pd
import numpy as np

Step 3: Train, test, and autolog a scikit-learn experiment, including the hyperparameters used and test results with MLflow.

# load dataset
db = load_diabetes()
X = db.data
y = db.target
X_train, X_test, y_train, y_test = train_test_split(X, y)
 
# mlflow.sklearn.autolog() requires mlflow 1.11.0 or above.
mlflow.sklearn.autolog()
 
# With autolog() enabled, all model parameters, a model score, and the fitted model are automatically logged.  
with mlflow.start_run() as run:  
  # Set the model parameters. 
  n_estimators = 100
  max_depth = 6
  max_features = 3
  # Create and train model.
  rf = RandomForestRegressor(n_estimators = n_estimators, max_depth = max_depth, max_features = max_features)
  rf.fit(X_train, y_train)
  # Use the model to make predictions on the test dataset.
  predictions = rf.predict(X_test)
  
mlflow.end_run()

Step 4: Log the model into the MLflow Registry, which saves model artifacts into Google Cloud Storage.

model_name = "vertex-sklearn-blog-demo"
mlflow.sklearn.log_model(rf, model_name, registered_model_name=model_name)


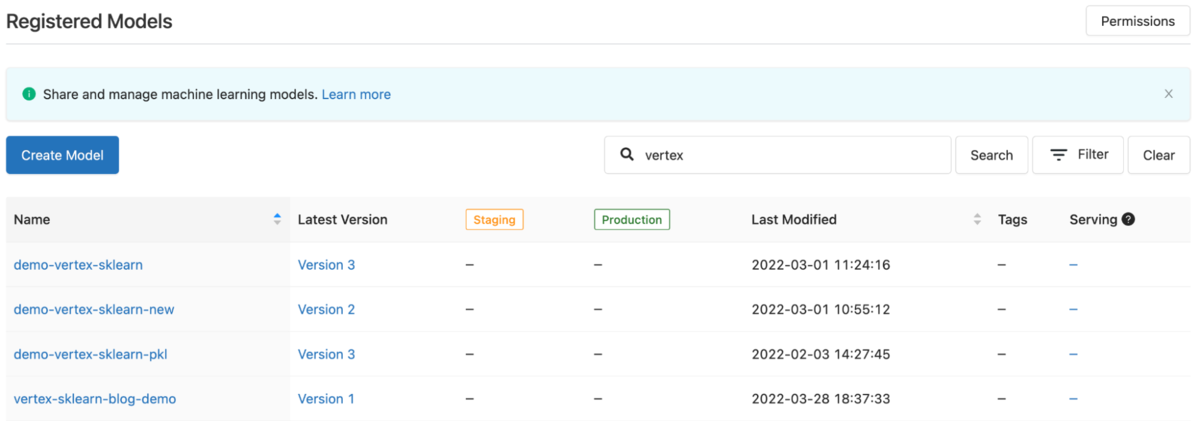
Registered Models in the MLflow Model Registry

Step 5: Programmatically get the latest version of the model using the MLflow Tracking Client. In a real case scenario you will likely transition the model from stage to production in your CICD process once the model has met production standards.

client = mlflow.tracking.MLflowClient()
model_version_infos = client.search_model_versions(f"name = '{model_name}'")
model_version = max([int(model_version_info.version) for model_version_info in model_version_infos])
model_uri=f"models:/{model_name}/{model_version}"

# model_uri should be models:/vertex-sklearn-blog-demo/1

Step 6: Instantiate the Vertex AI client and deploy to an endpoint using just three lines of code.

# Really simple Vertex client instantiation
vtx_client = mlflow.deployments.get_deploy_client("google_cloud")
deploy_name = f"{model_name}-{model_version}"

# Deploy to Vertex AI using three lines of code! Note: If using python > 3.7, this may take up to 20 minutes.
deployment = vtx_client.create_deployment(
    name=deploy_name,
    model_uri=model_uri)

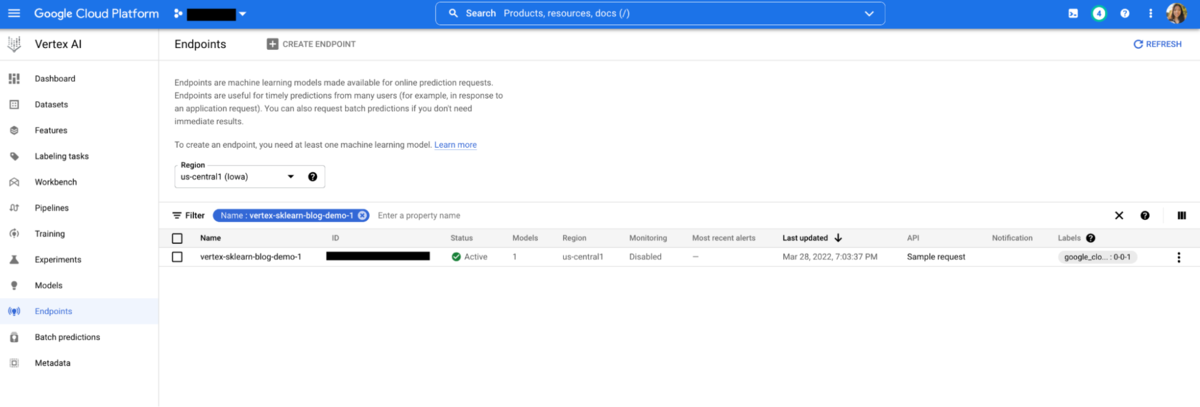
Step 7: Check the UI in Vertex AI and see the published model.


Vertex AI in the Google Cloud Console

Step 8: Invoke the endpoint using the plugin within the notebook for batch inference. In a real-case production scenario, you will likely invoke the endpoint from a web service or application for real time inference.

# Use the .predict() method from the same plugin
predictions = vtx_client.predict(deploy_name, X_test)

Your predictions should return the following Prediction class, which you can proceed to parse into a pandas dataframe and use for your business needs:

Prediction(predictions=[108.8213062661298, 121.8157069007118, 196.7929187443363, 159.9036896543356, 276.4400040206476, 100.4831327904369, 98.03313768162721, 170.2935904379434, 123.854209126032, 200.582723610864, 243.8882952682826, 89.56782205639794, 225.6276360204631, 183.9313416074667, 182.1405547852122, 179.3878755228988, 149.3434367420051, ...

Conclusion

As you can see, MLOps doesn’t have to be difficult. Using the end to end MLflow to Vertex AI solution, data teams can go from development to production in matters of days vs. weeks, months, or sometimes never! For a live demo of the end to end workflow, check out the on-demand session “Accelerating MLOps Using Databricks and Vertex AI on Google Cloud” during DAIS 2022.

To start your ML journey today, import the demo notebook into your workspace today. First-time customers can take advantage of partnership credits and start a free Databricks on Google Cloud trial. For any questions, please reach out to us using this contact form.

--

Try Databricks for free. Get started today.

The post MLOps on Databricks with Vertex AI on Google Cloud appeared first on Databricks.


Treating Data and AI as a Product Delivers Accelerated Return on Capital

$
0
0

The outsized benefits of data and AI to the Manufacturing sector have been thoroughly documented. As a recent McKinsey study reported, the Manufacturing segment is projected to deliver $700B-$1,200b value through data and AI in cost savings, productivity gains, and new revenue sources. As an example, data-led manufacturing use cases, powered by data and AI, reduce stock replenishment forecasting error by 20-50%, increasing total factory productivity by 50% or lowering scrap rates by 30%.

It shouldn’t be a surprise that the largest customers using the Databricks Manufacturing Lakehouse outperformed the overall market by over 200% over the last two years. What drove this success? These digitally-mature Lakehouse practitioners had:

  • more agile supply chains and profitable operations enabled by prescriptive and advanced analytical solutions that foresaw operational issues caused by COVID-19 disrupted supply chains.
  • advanced prescriptive analytics that promote uptime with prescriptive maintenance and supply chain integration.
  • new sources of revenue in this uncertain time.

Data + AI Summit 2022 featured several of these industry winners at the Manufacturing Industry Forum. These experts shared their experiences of how data and AI are transforming their businesses and delivering a stronger return on invested capital (ROIC). We’d like to highlight some of their insights shared during the event.

Manufacturing Industry Forum Keynote

Muthu Sabarethinam, Vice President, Enterprise Analytics & IT at Honeywell, kicked off the session with his keynote: The Future of Digital Transformation in Manufacturing. Part of his talk focused on how to approach a digital transformation project; in his own words: “start first with data contextualization in the digital transformation process,” meaning start by leveraging IT and OT data convergence to bring all relevant data in context to the users.

Citing that only 30% of projects are productionalized and escape POC Purgatory, he explored the use of AI to create data of value and provided insight on the concept that AI has the potential to streamline data cleaning, mapping, and deduping. In his own words: “Use AI to create data, not data to create AI.”

He further explored this point by providing an example of how contextual information was leveraged to “fill in the gaps” in master data during Honeywell’s consolidation of fifty SAP systems to ten, which involved using AI to map, cleanse and dedupe data and led to significant reductions in effort. Using these techniques, Honeywell boosted its digital implementation success ratio to nearly 80%.

Key insights delivered to accelerating AI adoption and monetization:

  • Build your AI engine first, then feed other use cases.
  • Deliver persona-led data to your users.
  • Productize the offering, allowing products to change behavior through application-based services that overcome adoption challenges of immature offerings.

In summary, a key insight was, “don’t wait for the data to be there, use AI to create it”.

Muthu Sabarethinam (Honeywell), Aimee DeGrauwe (John Deere), Peter Conrardy (Collins Aerospace), Shiv Trisal (Databricks)

Manufacturing Industry Panel Discussion

Muthu Sabarethinam, Aimee DeGrauwe, Digital Product Manager of John Deere and Peter Conrardy, Executive Director, Data and Digital Systems of Collins Aerospace formed a panel discussion hosted by Shiv Trisal (a Brickters of only three weeks) that discussed three major topics timely topics in data and AI:

Data & AI investment in a challenging economic backdrop
The panel discussed how businesses are accelerating their use of data and AI  amongst all the supply chain and economic uncertainty. Mr. Conrarday’s perspective: even in uncertain times, access to data is a constant, leading to initiatives that help gain more value from data. Ms. DeGrauwe echoed Peter’s perspective with: “we are seeking now to drive more AI into their connected products and double down on investment in infrastructure and workforce.” Shiv Trisal summarized the conversation with, “speed, move faster, commit to the vision and don’t wait, we have to do this”.

Data & AI driving sustainability outcomes
The panel members all agreed that sustainability is not a fad in manufacturing, but basic principles of operational excellence and energy conservation are just good business tactics. Ms. DeGrauwe commented, “our customers are intrinsically linked to the land” and “the [customer] desire to be environmentally sound has driven technologies like Deere’s See and Spray product, using machine vision as a foundational technology, to selectively identify and apply herbicide to weeds reducing herbicide use by 75%”. “Deere is supporting sustainability by no longer managing operations at the farm level or field level but by moving down to the granular plant level, to do what plants need and no more”.

Mr. Sabarethinam looked at sustainability through a slightly different lens, providing insights into Honeywell’s organization, explaining that “it gives a sense of purpose” to the organization’s employees and that Honeywell’s products enable connected households and businesses, energy reduction, and fugitive emission capture – all of which are core tenets of sustainability.

Mr. Trisal summed the conversion up with his insight that we could miss a larger opportunity if we only thought about sustainability in the context of point solutions and should also consider the effect on the organization and how sustainability percolates value from direct customers to their customers.

Measuring success of data & AI strategies

This topic explored a number of areas, and Mr. Sabarethinam shared that a successful organization elevates the conversation to the senior levels, driving and managing the conversation through measured financial data and analytics-driven measurements on hard document savings. Mr. Conrarday shared that data and analytics projects need to be treated like a product, where the customer and financial outcomes are deeply embedded in the project planning and execution. He pointed out that successful projects typically are funded by a department or business segment, as other business segments do not have “any skin in the game” to ensure success; a successful project is not done for free and has established metrics that are confirmed to ultimately deliver hard financial results to the business. Ms. DeGrauwe got an unexpected laugh when speaking about one of the challenges the John Deere team has when teaching the organization what machine learning is and how it will benefit the business. Ms. DeGrauwe commented that a colleague said, “we’ll know success when they stop saying, “just put it in the ML”, as if ML was a special department, product or mystical black box.

The Future

The panel finished the discussion by filling in this blank, “I could achieve 10x more value if I could solve for ______”. Mr.Conrarday suggested that solving for Edge in an aviation segment would be the place he would concentrate, and humorously suggested to sensor the entire aircraft fleet at zero cost in zero time. Ms. DeGrauwe suggested that it all comes back to the data and the AI it produces. Accessing good clean data at reasonable cost in a repeatable fashion across a variety of legacy disparate systems will drive advanced use cases driving upsized value. Mr. Sabarethinam reinforced his earlier comments about the contextualization of data and its delivery to the right persona at the right time delivers outsized benefits.

Clearly, Ms. DeGrauwe, Mr. Mr.Conrarday and Mr. Sabarethinam have deep industry experience and see a bright future for Manufacturing by leveraging data and AI. Their collective insights should help both those digitally mature and those just starting out in their digital transformation journeys achieve a measurable accelerated return on capital and improve their success ratio of digital projects by preventing them from falling into POC Purgatory. Each company is currently leveraging the Databricks Lakehouse Platform to run business-critical use cases from predictive maintenance embedded in John Deere’s Expert Alerts to seamless passenger journeys to connected operating systems for buildings, plants and energy management.

For more information on Databricks and these exciting product announcements, click here. Below are several manufacturing-centric Breakout Sessions from the Data + AI Summit:

Breakout Sessions
Why a Data Lakehouse is Critical During the Manufacturing Apocalypse – Corning
Predicting and Preventing Machine Downtime with AI and Expert Alerts – John Deere
How to Implement a Semantic Layer for Your Lakehouse – AtScale
Applied Predictive Maintenance in Aviation: Without Sensor Data – FedEx Express
Smart Manufacturing: Real-time Process Optimization with Databricks – Tredence

The Manufacturing Industry Forum

--

Try Databricks for free. Get started today.

The post Treating Data and AI as a Product Delivers Accelerated Return on Capital appeared first on Databricks.
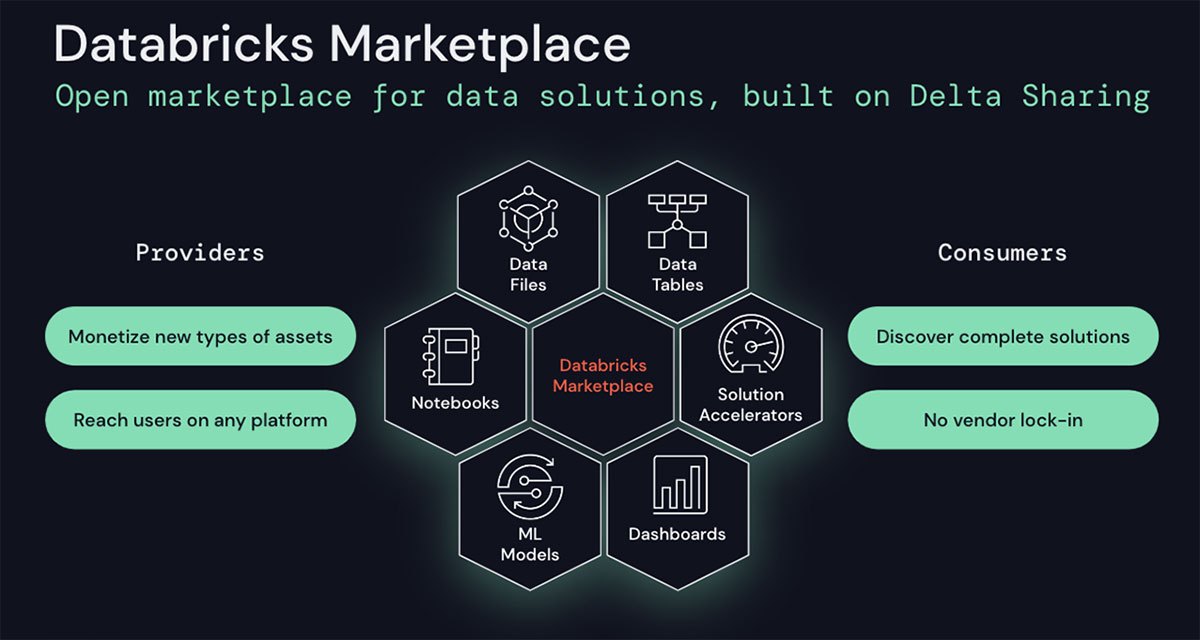
How to Migrate Your Data and AI Workloads to Databricks With the AWS Migration Acceleration Program

$
0
0

In this blog we define the process for earning AWS customer credits when migrating Data and AI workloads to Databricks on Amazon Web Services (AWS) with the AWS Migration Acceleration Program (MAP). We will show you how to use AWS MAP tagging to identify new migrated workloads such as Hadoop and Enterprise Data Warehouses (EDW), in order to ensure workloads qualify for valuable AWS customer credits. This information is helpful for customers, technical professionals at technology and consulting partners, as well as AWS Migration Specialists and Solution Architects.

Databricks overview

Databricks is the data and AI company. More than 7,000 organizations worldwide — including Comcast, Condé Nast, H&M and over 40% of the Fortune 500 — rely on the Databricks Lakehouse Platform to unify their data, analytics and AI. Founded by the original creators of Apache Spark™, Delta Lake and MLflow, Databricks is on a mission to help data teams solve the world’s toughest problems. Databricks is recognized by Gartner as a Leader in both Cloud Database Management Systems and Data Science and Machine Learning Platforms.

The Databricks Lakehouse on AWS unifies the best of data warehouses and data lakes in one simple platform to handle all your data, analytics and AI use cases. It’s built on an open and reliable data foundation that efficiently handles all data types and applies one common security and governance approach across all of your data and cloud platforms.

What is the AWS Migration Acceleration Program (MAP)?

The AWS Migration Acceleration Program (MAP) is a comprehensive and proven cloud migration program based upon AWS’s experience migrating thousands of enterprise customers to the cloud. Enterprise migrations can be complex and time-consuming, but MAP can help you accelerate your cloud migration and modernization journey with an outcome-driven methodology.

MAP provides tools that reduce costs and automate and accelerate execution through tailored training approaches and content, expertise from AWS Professional Services, a global partner network, and AWS investment. MAP also uses a proven three-phased framework (Assess, Mobilize, and Migrate and Modernize) to help you achieve your migration goals. Through MAP, you can build strong AWS cloud foundations, accelerate and reduce risk, and offset the initial cost of migrations. Leverage the performance, security, and reliability of the cloud.

Why do you need to tag resources?

Migrated resources must be identified with a specific map-migrated tag (tag key is case sensitive) to ensure AWS credits are provided to customers as an incentive and to reduce the cost of migrations. The tagging process explained below should be used for Hadoop, Data Warehouse, on-premises, or other cloud workload migrations to AWS.

Steps to Tag Migrated Resources

The following infographic provides an overview of the seven-step process:

7-step process for implementing AWS MAP tagging in Databricks on AWS

Set up an AWS Organization account

Setting up an AWS Organization account for use with Databricks on AWS

Set up a Databricks Workspace

Set up your Databricks workspacevia Cloud Formation or the Databricks account console in less than 15 minutes.

Set up your Databricks workspace via Cloud Formation or the Databricks account console in less than 15 minutes.

Activate AWS MAP Tagging

Provide the Migration Program Engagement ID (MPE ID is received after signing an AWS MAP Agreement with your AWS representatives) on the CloudFormation stack to be used to create the dependent AWS objects. This will create Cost and Usage Reports (CUR) and generate a server ID to be used by the AWS Migration Hub for migrations.

AWS CloudFormation template for generating server IDs and setting up Cost and usage reports

AWS CloudFormation template for generating server IDs and setting up Cost and usage reports

Providing the MPE ID before initiating the AWS CloudFormation Stack for MAP

Providing the MPE ID before initiating the AWS CloudFormation Stack for MAP

After the AWS CloudFormation is run successfully, copy the migration hub server IDs generated from the output and tag them as a value to the map-migrated tag set on the Databricks clusters used as the target clusters for migration. In addition to Databricks clusters, follow the same tagging mechanism across other AWS resources used for the migration, including the Amazon S3 buckets and Amazon Elastic Block Store (EBS) volumes.

Copying the server IDs from the AWS CloudFormation output to be used in MAP tagging

Copying the server IDs from the AWS CloudFormation output to be used in MAP tagging

Databricks clusters being used for migration

Databricks clusters being used for migration

Spin up the Databricks clusters for migration and tag them with map-migrated tags one of three ways: 1. the Databricks console, 2. the AWS console, or 3. the Databricks’ API and its cluster policies.

1. MAP tagging Databricks clusters using the Databricks console (preferred)

MAP tagging Databricks clusters using the Databricks console (preferred)

Amazon EBS volumes are automatically MAP tagged when tagging is done via the Databricks console/h4>


Amazon EBS volumes are automatically MAP tagged when tagging is done via the Databricks console

2. MAP tagging Databricks clusters via the AWS console

MAP tagging Databricks clusters via the AWS console

3. Databricks cluster tagging can be performed via cluster policies

Be sure to tag the associated Amazon S3 buckets

Databricks cluster tagging can be performed via cluster policies

Once all Databricks on AWS resources are tagged appropriately, perform the migration and track the usage via AWS Cost Explorer. Organizations who have signed an AWS MAP Agreement and performed all the required steps will see credits applied to their AWS account. Remember to activate the MAP tags in the Cost Allocation Tags section of the AWS Billing Console. The map-migrated tags may take up to 24 hours to show up in the Cost Allocation Tags section after you have deployed the CloudFormation template.

Once all Databricks on AWS resources are tagged appropriately, perform the migration and track the usage via AWS Cost Explorer.

Activating Cost Allocation Tags

Activating Cost Allocation Tags

Automatically Delivered Cost and Usage Reports

Services > Billing > Cost & Usage Reports.

Automatically Delivered Cost and Usage Reports

Summary

In this blog we explained how to successfully tag migrated workloads to Databricks on AWS using the AWS Migration Acceleration Program (MAP). Using tags to identify migrated workloads will benefit customers through AWS credits. The steps involved include generating server IDs on the AWS Migration Hub, setting up cost allocation tags, using MAP tags to target Databricks clusters, automatically delivering cost and usage reports, and tracking usage via Cost Explorer.

Questions? Email us at aws@databricks.com.

Additional Resources

AWS Migration Acceleration Program (MAP)

Hadoop Migrations

SAS Migrations

Data Warehouse Migrations

--

Try Databricks for free. Get started today.

The post How to Migrate Your Data and AI Workloads to Databricks With the AWS Migration Acceleration Program appeared first on Databricks.
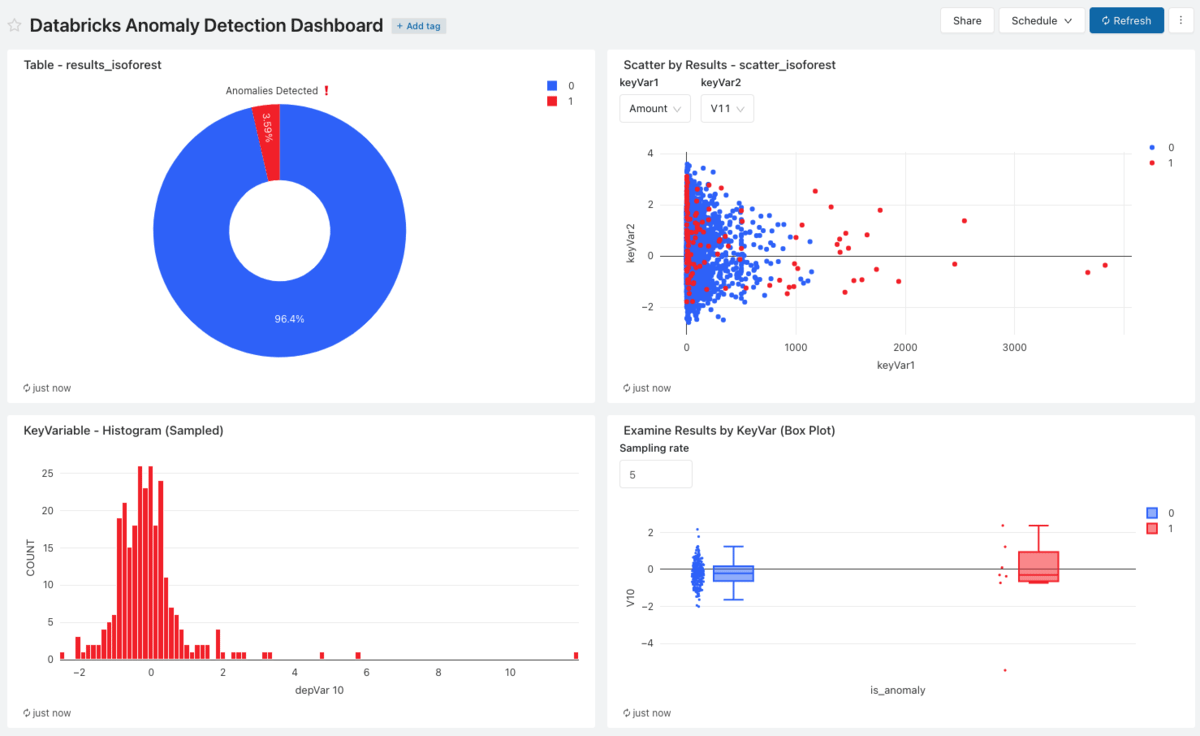
Feature Deep Dive: Watermarking in Apache Spark Structured Streaming

$
0
0

Key Takeaways

  • Watermarks help Spark understand the processing progress based on event time, when to produce windowed aggregates and when to trim the aggregations state
  • When joining streams of data, Spark, by default, uses a single, global watermark that evicts state based on the minimum event time seen across the input streams
  • RocksDB can be leveraged to reduce pressure on cluster memory and GC pauses
  • StreamingQueryProgress and StateOperatorProgress objects contain key information about how watermarks affect your stream

Introduction

When building real-time pipelines, one of the realities that teams have to work with is that distributed data ingestion is inherently unordered. Additionally, in the context of stateful streaming operations, teams need to be able to properly track event time progress in the stream of data they are ingesting for the proper calculation of time-window aggregations and other stateful operations. We can solve for all of this using Structured Streaming.

For example, let’s say we are a team working on building a pipeline to help our company do proactive maintenance on our mining machines that we lease to our customers. These machines always need to be running in top condition so we monitor them in real-time. We will need to perform stateful aggregations on the streaming data to understand and identify problems in the machines.

This is where we need to leverage Structured Streaming and Watermarking to produce the necessary stateful aggregations that will help inform decisions around predictive maintenance and more for these machines.

What Is Watermarking?

Generally speaking, when working with real-time streaming data there will be delays between event time and processing time due to how data is ingested and whether the overall application experiences issues like downtime. Due to these potential variable delays, the engine that you use to process this data needs to have some mechanism to decide when to close the aggregate windows and produce the aggregate result.

While the natural inclination to remedy these issues might be to use a fixed delay based on the wall clock time, we will show in this upcoming example why this is not the best solution.

To explain this visually let’s take a scenario where we are receiving data at various times from around 10:50 AM → 11:20 AM. We are creating 10-minute tumbling windows that calculate the average of the temperature and pressure readings that came in during the windowed period.

In this first picture, we have the tumbling windows trigger at 11:00 AM, 11:10 AM and 11:20 AM leading to the result tables shown at the respective times. When the second batch of data comes around 11:10 AM with data that has an event time of 10:53 AM this gets incorporated into the temperature and pressure averages calculated for the 11:00 AM → 11:10 AM window that closes at 11:10 AM, which does not give the correct result.

Visual representation of a Structured Streaming pipeline ingesting batches of temperature and pressure data

To ensure we get the correct results for the aggregates we want to produce, we need to define a watermark that will allow Spark to understand when to close the aggregate window and produce the correct aggregate result.

In Structured Streaming applications, we can ensure that all relevant data for the aggregations we want to calculate is collected by using a feature called watermarking. In the most basic sense, by defining a watermark Spark Structured Streaming then knows when it has ingested all data up to some time, T, (based a set lateness expectation) so that it can close and produce windowed aggregates up to timestamp T.

This second visual shows the effect of implementing a watermark of 10 minutes and using Append mode in Spark Structured Streaming.

Visual representation of the effect a 10-minute watermark has when applied to the Structured Streaming pipeline.

Unlike the first scenario where Spark will emit the windowed aggregation for the previous ten minutes every ten minutes (i.e. emit the 11:00 AM →11:10 AM window at 11:10 AM), Spark now waits to close and output the windowed aggregation once the max event time seen minus the specified watermark is greater than the upper bound of the window.

In other words, Spark needed to wait until it saw data points where the latest event time seen minus 10 minutes was greater than 11:00 AM to emit the 10:50 AM → 11:00 AM aggregate window. At 11:00 AM, it does not see this, so it only initializes the aggregate calculation in Spark’s internal state store. At 11:10 AM, this condition is still not met, but we have a new data point for 10:53 AM so the internal state gets updated, just not emitted. Then finally by 11:20 AM Spark has seen a data point with an event time of 11:15 AM and since 11:15 AM minus 10 minutes is 11:05 AM which is later than 11:00 AM the 10:50 AM → 11:00 AM window can be emitted to the result table.

This produces the correct result by properly incorporating the data based on the expected lateness defined by the watermark. Once the results are emitted the corresponding state is removed from the state store.

Incorporating Watermarking into Your Pipelines

To understand how to incorporate these watermarks into our Structured Streaming pipelines, we will explore this scenario by walking through an actual code example based on our use case stated in the introduction section of this blog.

Let’s say we are ingesting all our sensor data from a Kafka cluster in the cloud and we want to calculate temperature and pressure averages every ten minutes with an expected time skew of ten minutes. The Structured Streaming pipeline with watermarking would look like this:

PySpark

sensorStreamDF = spark \
  .readStream \
  .format("kafka") \
  .option("kafka.bootstrap.servers", "host1:port1,host2:port2") \
  .option("subscribe", "tempAndPressureReadings") \
  .load()

sensorStreamDF = sensorStreamDF \
.withWatermark("eventTimestamp", "10 minutes") \
.groupBy(window(sensorStreamDF.eventTimestamp, "10 minutes")) \
.avg(sensorStreamDF.temperature,
     sensorStreamDF.pressure)

sensorStreamDF.writeStream
  .format("delta")
  .outputMode("append")
  .option("checkpointLocation", "/delta/events/_checkpoints/temp_pressure_job/")
  .start("/delta/temperatureAndPressureAverages")

Here we simply read from Kafka, apply our transformations and aggregations, then write out to Delta Lake tables which will be visualized and monitored in Databricks SQL. The output written to the table for a particular sample of data would look like this:

Output from the streaming query defined in PySpark code sample above

To incorporate watermarking we first needed to identify two items:

  1. The column that represents the event time of the sensor reading
  2. The estimated expected time skew of the data

Taken from the previous example, we can see the watermark defined by the .withWatermark() method with the eventTimestamp column used as the event time column and 10 minutes to represent the time skew that we expect.

PySpark

sensorStreamDF = sensorStreamDF \
.withWatermark("eventTimestamp", "10 minutes") \
.groupBy(window(sensorStreamDF.eventTimestamp, "10 minutes")) \
.avg(sensorStreamDF.temperature,
     sensorStreamDF.pressure)

Now that we know how to implement watermarks in our Structured Streaming pipeline, it will be important to understand how other items like streaming join operations and managing state are affected by watermarks. Additionally, as we scale our pipelines there will be key metrics our data engineers will need to be aware of and monitor to avoid performance issues. We will explore all of this as we dive deeper into watermarking.

Watermarks in Different Output Modes

Before we dive deeper, it is important to understand how your choice of output mode affects the behavior of the watermarks you set.

Watermarks can only be used when you are running your streaming application in append or update output modes. There is a third output mode, complete mode, in which the entire result table is written to storage. This mode cannot be used because it requires all aggregate data to be preserved, and hence cannot use watermarking to drop intermediate state.

The implication of these output modes in the context of window aggregation and watermarks is that in ‘append’ mode an aggregate can be produced only once and can not be updated. Therefore, once the aggregate is produced, the engine can delete the aggregate’s state and thus keep the overall aggregation state bounded. Late records – the ones for which the approximate watermark heuristic did not apply (they were older than the watermark delay period), therefore have to be dropped by necessity – the aggregate has been produced and the aggregate state deleted.

Inversely, for ‘update’ mode, the aggregate can be produced repeatedly starting from the first record and on each received record, thus a watermark is optional. The watermark is only useful for trimming the state once heuristically the engine knows that no more records for that aggregate can be received. Once the state is deleted, again any late records have to be dropped as the aggregate value has been lost and can’t be updated.

It is important to understand how state, late-arriving records, and the different output modes could lead to different behaviors of your application running on Spark. The main takeaway here is that in both append and update modes, once the watermark indicates that all data is received for an aggregate time window, the engine can trim the window state. In append mode the aggregate is produced only at the closing of the time window plus the watermark delay while in update mode it is produced on every update to the window.

Lastly, by increasing your watermark delay window you will cause the pipeline to wait longer for data and potentially drop less data – higher precision, but also higher latency to produce the aggregates. On the flip side, smaller watermark delay leads to lower precision but also lower latency to produce the aggregates.

Window Delay Length Precision Latency
Longer Delay Window Higher Precision Higher Latency
Shorter Delay Window Lower Precision Lower Latency

Deeper Dive into Watermarking

Joins and Watermarking

There are a couple considerations to be aware of when doing join operations in your streaming applications, specifically when joining two streams. Let’s say for our use case, we want to join the streaming dataset about temperature and pressure readings with additional values captured by other sensors across the machines.

There are three overarching types of stream-stream joins that can be implemented in Structured Streaming: inner, outer, and semi joins. The main problem with doing joins in streaming applications is that you may have an incomplete picture of one side of the join. Giving Spark an understanding of when there are no future matches to expect is similar to the earlier problem with aggregations where Spark needed to understand when there were no new rows to incorporate into the calculation for the aggregation before emitting it.

To allow Spark to handle this, we can leverage a combination of watermarks and event-time constraints within the join condition of the stream-stream join. This combination allows Spark to filter out late records and trim the state for the join operation through a time range condition on the join. We demonstrate this in the example below:

PySpark

sensorStreamDF = spark.readStream.format("delta").table("sensorData")
tempAndPressStreamDF = spark.readStream.format("delta").table("tempPressData")

sensorStreamDF_wtmrk = sensorStreamDF.withWatermark("timestamp", "5 minutes")
tempAndPressStreamDF_wtmrk = tempAndPressStreamDF.withWatermark("timestamp", "5 minutes")

joinedDF = tempAndPressStreamDF_wtmrk.alias("t").join(
 sensorStreamDF_wtmrk.alias("s"),
 expr("""
   s.sensor_id == t.sensor_id AND
   s.timestamp >= t.timestamp AND
   s.timestamp <= t.timestamp + interval 5 minutes
   """),
 joinType="inner"
).withColumn("sensorMeasure", col("Sensor1")+col("Sensor2")) \
.groupBy(window(col("t.timestamp"), "10 minutes")) \
.agg(avg(col("sensorMeasure")).alias("avg_sensor_measure"), avg(col("temperature")).alias("avg_temperature"), avg(col("pressure")).alias("avg_pressure")) \
.select("window", "avg_sensor_measure", "avg_temperature", "avg_pressure")

joinedDF.writeStream.format("delta") \
       .outputMode("append") \
       .option("checkpointLocation", "/checkpoint/files/") \
       .toTable("output_table")

However, unlike the above example, there will be times where each stream may require different time skews for their watermarks. In this scenario, Spark has a policy for handling multiple watermark definitions. Spark maintains one global watermark that is based on the slowest stream to ensure the highest amount of safety when it comes to not missing data.

Developers do have the ability to change this behavior by changing spark.sql.streaming.multipleWatermarkPolicy to max; however, this means that data from the slower stream will be dropped.

To see the full range of join operations that require or could leverage watermarks check out this section of Spark's documentation.

Monitoring and Managing Streams with Watermarks

When managing a streaming query where Spark may need to manage millions of keys and keep state for each of them, the default state store that comes with Databricks clusters may not be effective. You might start to see higher memory utilization, and then longer garbage collection pauses. These will both impede the performance and scalability of your Structured Streaming application.

This is where RocksDB comes in. You can leverage RocksDB natively in Databricks by enabling it like so in the Spark configuration:

spark.conf.set(
  "spark.sql.streaming.stateStore.providerClass",
  "com.databricks.sql.streaming.state.RocksDBStateStoreProvider")

This will allow the cluster running the Structured Streaming application to leverage RocksDB which can more efficiently manage state in the native memory and take advantage of the local disk/SSD instead of keeping all state in memory.

Beyond tracking memory usage and garbage collection metrics, there are other key indicators and metrics that should be collected and tracked when dealing with Watermarking and Structured Streaming. To access these metrics you can look at the StreamingQueryProgress and the StateOperatorProgress objects. Check out our documentation for examples of how to use these here.

In the StreamingQueryProgress object, there is a method called "eventTime" that can be called and that will return the max, min, avg, and watermark timestamps. The first three are the max, min, and average event time seen in that trigger. The last one is the watermark used in the trigger.

Abbreviated Example of a StreamingQueryProgress object

{
  "id" : "f4311acb-15da-4dc3-80b2-acae4a0b6c11",
  . . . .
  "eventTime" : {
    "avg" : "2021-02-14T10:56:06.000Z",
    "max" : "2021-02-14T11:01:06.000Z",
    "min" : "2021-02-14T10:51:06.000Z",
    "watermark" : "2021-02-14T10:41:06.000Z"
  },
  "stateOperators" : [ {
    "operatorName" : "stateStoreSave",
    "numRowsTotal" : 7,
    "numRowsUpdated" : 0,
    "allUpdatesTimeMs" : 205,
    "numRowsRemoved" : 0,
    "allRemovalsTimeMs" : 233,
    "commitTimeMs" : 15182,
    "memoryUsedBytes" : 91504,
    "numRowsDroppedByWatermark" : 0,
    "numShufflePartitions" : 200,
    "numStateStoreInstances" : 200,
    "customMetrics" : {
      "loadedMapCacheHitCount" : 4800,
      "loadedMapCacheMissCount" : 0,
      "stateOnCurrentVersionSizeBytes" : 25680
     }
   }
  . . . .
  }

These pieces of information can be used to reconcile the data in the result tables that your streaming queries are outputting and also be used to verify that the watermark being used is the intended eventTime timestamp. This can become important when you are joining streams of data together.

Within the StateOperatorProgress object there is the numRowsDroppedByWatermark metric. This metric will show how many rows are being considered too late to be included in the stateful aggregation. Note that this metric is measuring rows dropped post-aggregation and not the raw input rows, so the number is not precise but can give an indication that there is late data being dropped. This, in conjunction with the information from the StreamingQueryProgress object, can help developers determine whether the watermarks are correctly configured.

Multiple Aggregations, Streaming, and Watermarks

One remaining limitation of Structured Streaming queries is chaining multiple stateful operators (e.g. aggregations, streaming joins) in a single streaming query. This limitation of a singular global watermark for stateful aggregations is something that we at Databricks are working on a solution for and will be releasing more information about in the coming months. Check out our blog on Project Lightspeed to learn more: Project Lightspeed: Faster and Simpler Stream Processing With Apache Spark (databricks.com).

Conclusion

With Structured Streaming and Watermarking on Databricks, organizations, like the one with the use case described above, can build resilient real-time applications that ensure metrics driven by real-time aggregations are being accurately calculated even if data is not properly ordered or on-time. To learn more about how you can build real-time applications with Databricks, contact your Databricks representative.

--

Try Databricks for free. Get started today.

The post Feature Deep Dive: Watermarking in Apache Spark Structured Streaming appeared first on Databricks.

Databricks Expands Brickbuilder Solutions for Healthcare and Life Sciences

$
0
0

Today, we’re excited to announce that Databricks has collaborated with Avanade, Deloitte, and ZS to expand Brickbuilder Solutions for healthcare and life sciences. These new solutions, in addition to the previously launched Lovelytics solution, help healthcare organizations map data across the entire patient lifecycle and derive insights at speed and scale.

Earlier this year, Databricks announced Lakehouse for Healthcare and Life Sciences, a platform that delivers partner solutions and use case accelerators designed to address the unique requirements for healthcare organizations. To complement the Lakehouse, we also introduced Brickbuilder Solutions – data and AI solutions expertly designed by leading consulting companies to address industry-specific business requirements.* Last week, we announced the expansion of Brickbuilder Solutions to include partner migration solutions. We’ll continue this growth and momentum by launching additional financial services and manufacturing solutions, all to help customers reduce costs and accelerate time to value throughout their data transformation journey.

Let’s take a further look into Databricks’ suite of healthcare and life sciences Brickbuilder Solutions.

Fig. 1: Brickbuilder Solutions are partner-developed industry and migration solutions for the lakehouse.

Fig. 1: Brickbuilder Solutions are partner-developed industry and migration solutions for the lakehouse.

Avanade Intelligent Healthcare on Azure Databricks: end-to-end solution to help providers harness data to strengthen patient outcomes

The healthcare industry has long been challenged by heavy clinician workloads, cost of care, and processes that impact the patient experience. Unfortunately, the pandemic has only intensified these challenges, and created new ones. Many healthcare leaders are investing in digital transformation efforts to strengthen operations and the entire care experience. Powered by the cloud, technologies like machine learning, natural language processing, and cognitive apps can help health organizations address the challenges faced by healthcare professionals.

Avanade’s Intelligent Healthcare on Azure Databricks solution enables providers to improve operational efficiencies and overcome resource constraints. With Intelligent Healthcare, data more seamlessly flows across the patient lifecycle to improve team care collaboration and provide enhanced insights at scale using analytics and AI. Providers can use these insights to improve patient health outcomes, personalize the patient journey, and enhance care team productivity.

Deloitte PrecisionView™: enrich internal collaboration for the finance department in healthcare organizations

For healthcare organizations, finance is at an inflexion point where growing expectations for real-time insights is the norm. Chief Financial Officers and other finance leaders find themselves regularly having to adapt to maintain top-performing FP&A organizations that deliver efficiency and business value. This requires them to challenge the way their organizations use data to unleash the power of advanced forecasting techniques and predictive modeling.

PrecisionView™, Deloitte’s proprietary advanced forecasting solution for healthcare and life sciences, leverages data aggregation technologies with predictive analytics as well as cognitive and machine-learning capabilities to let businesses generate improved forecasting accuracy and predictive modeling. The solution also helps generate high-impact insights that relate to the total enterprise, business units, geographies and products. It’s no secret that traditional forecasting and predictive modeling methods can be excessively manual and prone to unintentional human bias or sandbagging. PrecisionView, plus the right user experience, can help change that.

Fig. 2: Deloitte PrecisionView™ leverages data aggregation with predictive analytics to let healthcare organizations generate improved forecasting accuracy.

Fig. 2: Deloitte PrecisionView™ leverages data aggregation with predictive analytics to let healthcare organizations generate improved forecasting accuracy.

Lovelytics Health Data Interoperability: quick and meaningful analytics for health data

The healthcare industry has a legacy of highly-structured data models and complex analytics pipelines for a variety of use cases, such as clinical trial analytics, therapeutics, operational reporting, and governance and compliance. These data sets have enormous potential to uncover new, life-saving treatments, predict disease before it happens, and fundamentally change the way that care is delivered.

The Lovelytics Health Data Interoperability accelerator helps you establish the right foundation for your analytics roadmap by automating the ingestion of streaming FHIR bundles into the lakehouse for downstream patient analytics at scale. With this accelerator, you are able to democratize technology to prototype health data dashboards quicker as well as simplify the exchange of health data models and reusable data assets for a variety of new use cases.

Fig. 3: Lovelytics Health Data Interoperability accelerator automates the ingestion of streaming FHIR bundles into the lakehouse for downstream patient analytics at scale.

Fig. 3: Lovelytics Health Data Interoperability accelerator automates the ingestion of streaming FHIR bundles into the lakehouse for downstream patient analytics at scale.

ZS Intelligent Data Management for Biomedical Research: transform biomedical research data into insights

The need for digital transformation in life sciences has accelerated, creating a demand for a deeper understanding of customers globally. This means that organizations need high-quality, comprehensive data in order to drive innovation and enable new commercial models, but many of them struggle with the implementation of AI. When an organization can execute complete AI life cycles, explore large datasets, and quickly iterate across data science and data engineering workloads, they can improve engagement, forecasting, and internal collaboration.

Intelligent Data Management for Biomedical Research by ZS is a modular solution leveraged in the end-to-end value chain of setting up and using scientific data as an enterprise asset. It helps customers move closer to the vision of precision medicine at scale and at speed. The solution solves speed and cost issues around ingestion, storage, and querying of petabyte-scale genomic datasets, and provides quality control management for data from disparate sources. With Intelligent Data Management, you are now able to expedite query response times of excessive data sets, reduce infrastructure costs, and increase time-to-value.

See More Brickbuilder Solutions

At Databricks, we continue to collaborate with our consulting partner ecosystem to enable use cases in healthcare and life sciences. Check out our full set of partner solutions on the Databricks Brickbuilder Solutions page.

Create Brickbuilder Solutions for the Databricks Lakehouse Platform

Brickbuilder Solutions is a key component of the Databricks Partner Program and recognizes partners who have demonstrated a unique ability to offer differentiated industry and migration solutions on the Databricks Lakehouse Platform in combination with their knowledge and expertise.

Partners who are interested in learning more about how to create a Brickbuilder Solution are encouraged to email us at partners@databricks.com.

*We have collaborated with consulting and system integrator (C&SI) partners to develop industry and migration solutions to address data engineering, data science, machine learning and business analytics use cases.

--

Try Databricks for free. Get started today.

The post Databricks Expands Brickbuilder Solutions for Healthcare and Life Sciences appeared first on Databricks.
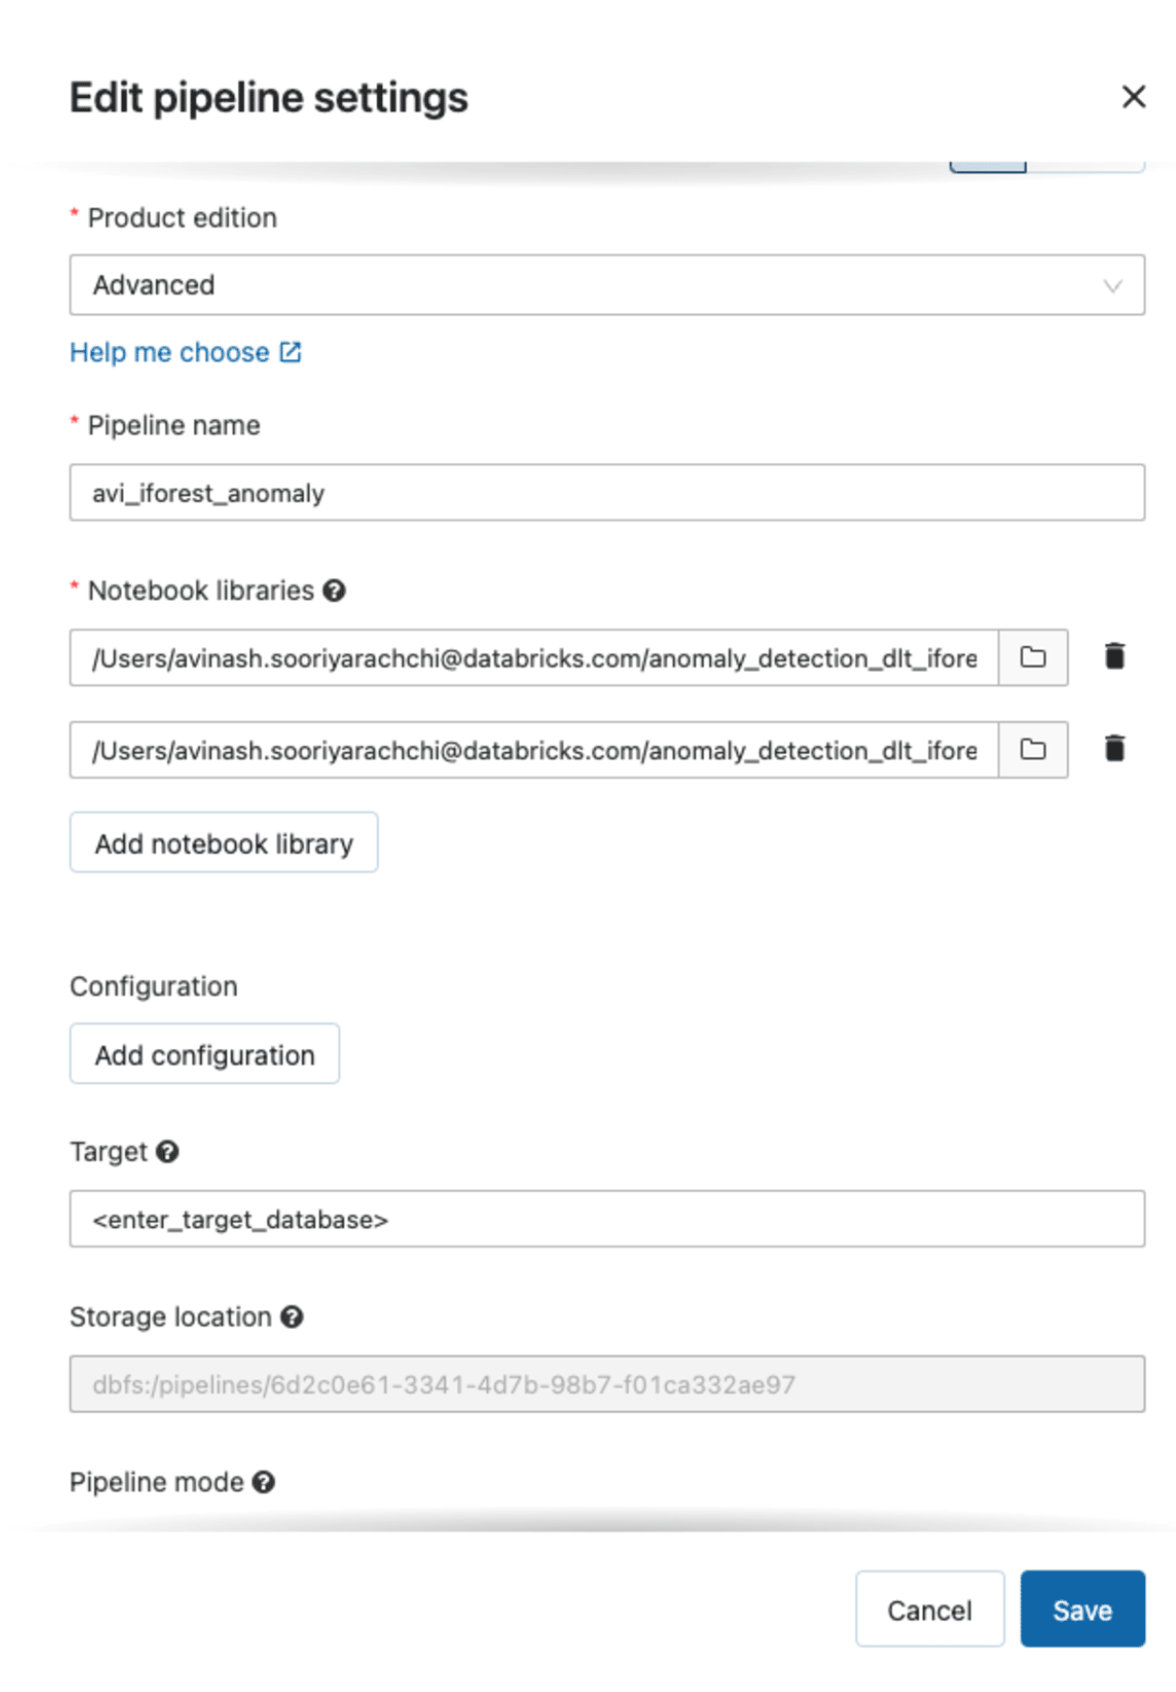
Restricting Libraries in JVM Compute Platforms

$
0
0

Security challenges with Scala and Java libraries

Open source communities have built incredibly useful libraries. They simplify many common development scenarios. Through our open-source projects like Apache Spark, we have learned the challenges of both building projects for everyone and ensuring they work securely. Databricks products benefit from third party libraries and use them to extend existing functionalities. This blog post explores the challenges of using such third party libraries in the Scala and Java languages and proposes solutions to isolate them when needed.

Third-party libraries often provide a wide variety of features. Developers might not be aware of the complexity behind a particular functionality, or know how to disable feature sets easily. In this context, attackers can often leverage unexpected features to gain access to or steal information from a system. For example, a JSON library might use custom tags as a means to inappropriately allow inspecting the contents of local files. Along the same lines, a HTTP library might not think about the risk of local network access or only provide partial restrictions for certain cloud providers.

The security of a third party package goes beyond the code. Open source projects rely on the security of their infrastructure and dependencies. For example, Python and PHP packages were recently compromised to steal AWS keys. Log4j also highlighted the web of dependencies exploited during security vulnerabilities.

Isolation is often a useful tool to mitigate attacks in this area. Note that isolation can help enhance security for defense-in-depth but it is not a replacement for security patching and open-source contributions.

Proposed solution

The Databricks security team aims to make secure development simple and straightforward by default. As part of this effort, the team built an isolation framework and integrated it with multiple third party packages. This section explains how it was designed and shares a small part of the implementation. Interested readers can find code samples in this notebook.

Per-thread Java SecurityManager

The Java SecurityManager allows an application to restrict access to resources or privileges through callbacks in the Java source code. It was originally designed to restrict Java applets in the Java 1.0 version. The open-source community uses it for security monitoring, isolation and diagnostics.

The SecurityManager policies apply globally for the entire application. For third party restrictions, we want security policies to apply only for specific code. Our proposed solution attaches a policy to a specific thread and manages the SecurityManager separately.

/**
 * Main object for restricting code.
 *
 * Please refer to the blog post for more details.
 */
object SecurityRestriction {
  private val lock = new ReentrantLock
  private var curManager: Option[ThreadManager] = None

...

  /**
   * Apply security restrictions for the current thread.
   * Must be followed by [[SecurityRestriction.unrestrict]].
   *
...

   *
   * @param handler SecurityPolicy applied, default to block all.
   */
  def restrict(handler: SecurityPolicy = new SecurityPolicy(Action.Block)): Unit = {
    // Using a null handler here means no restrictions apply,
    // simplifying configuration opt-in / opt-out.
    if (handler == null) {
      return
    }

    lock.lock()
    try {
      // Check or create a thread manager.
      val manager = curManager.getOrElse(new ThreadManager)
      
      // If a security policy already exists, raise an exception.
      val thread = Thread.currentThread
      if (manager.threadMap.contains(thread)) {
        throw new ExistingSecurityManagerException
      }
      
      // Keep the security policy for this thread.
      manager.threadMap.put(thread, new ThreadContext(handler))
      
      // Set the SecurityManager if that's the first entry.
      if (curManager.isEmpty) {
        curManager = Some(manager)
        System.setSecurityManager(manager)
      }
    } finally {
      lock.unlock()
    }

  }

...

}
Figure 1. Per-thread SecurityManager implementation.

Constantly changing the SecurityManager can introduce race conditions. The proposed solution uses reentrant locks to manage setting and removing the SecurityManager. If multiple parts of the code need to change the SecurityManager, it is safer to set the SecurityManager once and never remove it.

The code also respects any pre-installed SecurityManager by forwarding calls that are allowed.

/**
 * Extends the [[java.lang.SecurityManager]] to work only on designated threads.
 *
 * The Java SecurityManager allows defining a security policy for an application.
 * You can prevent access to the network, reading or writing files, executing processes
 * or more. The security policy applies throughout the application.
 *
 * This class attaches security policies to designated threads. Security policies can
 * be crafted for any specific part of the code.
 *
 * If the caller clears the security check, we forward the call to the existing SecurityManager.
 */
class ThreadManager extends SecurityManager {
  // Weak reference to thread and security manager.
  private[security] val threadMap = new WeakHashMap[Thread, ThreadContext]
  private[security] val subManager: SecurityManager = System.getSecurityManager

...

  private def forward[T](fun: (SecurityManager) => T, default: T = ()): T = {
    if (subManager != null) {
      return fun(subManager)
    }
    return default
  }

...

  // Identify the right restriction manager to delegate check and prevent reentrancy.
  // If no restriction applies, default to forwarding.
  private def delegate(fun: (SecurityManager) => Unit) {
    val ctx = threadMap.getOrElse(Thread.currentThread(), null)

    // Discard if no thread context exists or if we are already
    // processing a SecurityManager call.
    if (ctx == null || ctx.entered) {
      return
    }

    ctx.entered = true
    try {
      fun(ctx.restrictions)
    } finally {
      ctx.entered = false
    }

    // Forward to existing SecurityManager if available.
    forward(fun)
  }

...

// SecurityManager calls this function on process execution.
override def checkExec(cmd: String): Unit = delegate(_.checkExec(cmd))

...

}

Figure 2. Forwarding calls to existing SecurityManager.

Security policy and rule system

The security policy engine decides if a specific security access is allowed. To ease usage of the engine, accesses are organized into different types. These types of accesses are called PolicyCheck and look like the following:

/**
 * Generic representation of security checkpoints.
 * Each rule defined as part of the [[SecurityPolicy]] and/or [[PolicyRuleSet]] are attached
 * to a policy check.
 */
object PolicyCheck extends Enumeration {
  type Check = Value

  val AccessThread, ExecuteProcess, LoadLibrary, ReadFile, WriteFile, DeleteFile = Value
}

Figure 3. Policy access types.

For brevity, network access, system properties, and other properties are elided from the example.

The security policy engine allows attaching a ruleset to each access check. Each rule in the set is attached to a possible action. If the rule matches, the action is taken. The code uses three types of rules: Caller, Caller regex and default. Caller rules look at the thread call stack for a known function name. The default configuration always matches. If no rule matches, the security policy engine defaults to a global action.

/**
 * Action taken during a security check.
 * [[Action.Allow]] stops any check and just continues execution.
 * [[Action.Block]] throws an AccessControlException with details on the security check.
 * Log variants help debugging and testing rules.
 */
object Action extends Enumeration {
  type Action = Value

  val Allow, Block, BlockLog, BlockLogCallstack, Log, LogCallstack = Value
}

...

// List of rules applied in order to decide to allow or block a security check.
class PolicyRuleSet {
  private val queue = new Queue[Rule]()

  /**
   * Allow or block if a caller is in the security check call stack.
   *
   * @param action Allow or Block on match.
   * @param caller Fully qualified name for the function.
   */
  def addCaller(action: Action.Value, caller: String): Unit = {
    queue += PolicyRuleCaller(action, caller)
  }

  /**
   * Allow or block if a regex matches in the security check call stack.
   *
   * @param action Allow or Block on match.
   * @param caller Regular expression checked against each entry in the call stack.
   */
  def addCaller(action: Action.Value, caller: Regex): Unit = {
    queue += PolicyRuleCallerRegex(action, caller)
  }

  /**
   * Allow or block if a regex matches in the security check call stack.
   * Java version.
   *
   * @param action Allow or Block on match.
   * @param caller Regular expression checked against each entry in the call stack.

   */
  def addCaller(action: Action.Value, caller: java.util.regex.Pattern): Unit = {
    addCaller(action, caller.pattern().r)
  }

  /**
   * Add an action that always matches.
   *
   * @param action Allow or Block by default.
   */
  def addDefault(action: Action.Value): Unit = {
    queue += PolicyRuleDefault(action)
  }

  private[security] def validate(check: PolicyCheck.Value): Unit = queue.foreach(_.validate(check))

  private[security] def decide(currentStack: Seq[String], context: Any): Option[Action.Value] = {
    queue.foreach { _.decide(currentStack, context).map { x => return Some(x) }}
    None
  }

  private[security] def isEmpty(): Boolean = queue.isEmpty
}

...

/**
 * SecurityPolicy describes the rules for security checks in a restricted context.
 */
class SecurityPolicy(val default: Action.Value) extends SecurityManager {
  val rules = new HashMap[PolicyCheck.Value, PolicyRuleSet]

...

  protected def decide(check: PolicyCheck.Value, details: String, context: Any = null) = {
    var selectedDefault = default
    
    // Fetch any rules attached for this specific check.
    val rulesEntry = rules.getOrElse(check, null)
    if (rulesEntry != null && !rulesEntry.isEmpty) {
      val currentStack = Thread.currentThread.getStackTrace().toSeq.map(
        s => s.getClassName + "." + s.getMethodName
      )
      
      // Delegate to the rule to decide the action to take.
      rulesEntry.decide(currentStack, context) match {
        case Some(action) => selectedDefault = action
        case None =>
      }
    }
    
    // Apply the action decided or the default.
    selectedDefault match {
      case Action.BlockLogCallstack =>
        val callStack = formatCallStack
        logDebug(s"SecurityManager(Block): $details -- callstack: $callStack")
        throw new AccessControlException(details)
      case Action.BlockLog =>
        logDebug(s"SecurityManager(Block): $details")
        throw new AccessControlException(details)
      case Action.Block => throw new AccessControlException(details)
      case Action.Log => logDebug(s"SecurityManager(Log): $details")
      case Action.LogCallstack =>
        val callStack = formatCallStack
        logDebug(s"SecurityManager(Log): $details -- callstack: $callStack")
      case Action.Allow => ()
    }
  }

...

}

Figure 4. Basic for the Policy engine to filter SecurityManager calls.

This engine represents basic building blocks for creating more complicated policies suited to your usage. It supports adding additional rules specific to a new type of access check to filter paths, network IPs or others.

Example of restrictions

This is a simple security policy to block creation of processes and allow anything else.

import scala.sys.process._
import com.databricks.security._

def executeProcess() = {
  "ls /".!!
}

// Can create processes by default.
executeProcess

// Prevent process execution for specific code
val policy = new SecurityPolicy(Action.Allow)
policy.addRule(PolicyCheck.ExecuteProcess, Action.Block)

SecurityRestriction.restrictBlock(policy) {
  println("Blocked process creation:")
  
  // Exception raised on this call
  executeProcess
}

Figure 5. Example to block process creation.

Here we leverage the rule system to block file read access only to a specific function.

import scala.sys.process._
import com.databricks.security._
import scala.io.Source

def readFile(): String = Source.fromFile("/etc/hosts").toSeq.mkString("\n")

// Can read files by default.
readFile

// Blocked specifically for executeProcess function based on regex.
var rules = new PolicyRuleSet
rules.addCaller(Action.Block, raw".*\.readFile".r)

// Prevent process execution for a specific function.
val policy = new SecurityPolicy(Action.Allow)
policy.addRule(PolicyCheck.ReadFile, rules)

SecurityRestriction.restrictBlock(policy) {  
  println("Blocked reading file:")
  readFile
}

Figure 6. Example to block access to a file based on regex.

Here we log the process created by the restricted code.

import scala.sys.process._
import com.databricks.security._

// Only log with call stack
val policy = new SecurityPolicy(Action.Allow)
policy.addRule(PolicyCheck.ExecuteProcess, Action.LogCallstack)

SecurityRestriction.restrictBlock(policy) {
  // Log creation of process with call stack
  println("whoami.!!")
}

Figure 7. Example to log process creation including callstack.

JDK17 to deprecate Java SecurityManager and future alternatives

The Java team decided to deprecate the SecurityManager in JDK17 and eventually consider removing it. This change will affect the proposal in this blog post. The Java team has multiple projects to support previous usage of the SecurityManager but none so far that will allow similar isolation primitives.

The most viable alternative approach is to inject code in Java core functions using a Java agent. The result is similar to the current SecurityManager. The challenge is ensuring accurate coverage for common primitives like file or network access. The first implementation can start with existing SecurityManager callbacks but requires significant testing investments to reduce chances of regression.

Another alternative approach is to use operating system sandboxing primitives for similar results. For example, on Linux we can use namespaces and seccomp-bpf to limit resource access. However, this approach requires significant changes in existing applications and may impact performance.

--

Try Databricks for free. Get started today.

The post Restricting Libraries in JVM Compute Platforms appeared first on Databricks.

Parsing Improperly Formatted JSON Objects in the Databricks Lakehouse

$
0
0

Introduction

When working with files, there may be processes generated by custom APIs or applications that cause more than one JSON object to write to the same file. The following is an example of a file that contains multiple device IDs:

An improperly formatted JSON string

There’s a generated text file that contains multiple device readings from various pieces of equipment in the form of JSON object, but if we were to try to parse this using the json.load() function, the first line record is treated as the top-level definition for the data. Everything after the first device-id record gets disregarded, preventing the other records in the file from being read. A JSON file is invalid if it contains more than one JSON object when using this function.

The most straightforward resolution to this is to fix the formatting at the source, whether that means rewriting the API or application to format correctly. However, it isn’t always possible for an organization to do this due to legacy systems or processes outside its control. Therefore, the problem to solve is to take an invalid text file with valid JSON objects and properly format it for parsing.

Instead of using the PySpark json.load() function, we’ll utilize Pyspark and Autoloader to insert a top-level definition to encapsulate all device IDs and then load the data into a table for parsing.

Databricks Medallion Architecture

The Databricks Medallion Architecture is our design pattern for ingesting and incrementally refining data as it moves through the different layers of the architecture:

The Databricks Medallion

The traditional pattern uses the Bronze layer to land the data from external source systems into the Lakehouse. As ETL patterns are applied to the data, the data from the Bronze layer is matched, filtered, and cleansed just enough to provide an enterprise view of the data. This layer serves as the Silver layer and is the starting point for ad-hoc analysis, advanced analytics, and machine learning (ML). The final layer, known as the Gold layer, applies final data transformations to serve specific business requirements.

This pattern curates data as it moves through the different layers of the Lakehouse and allows for data personas to access the data as they need for various projects. Using this paradigm, we will use pass the text data into a bronze layer, then using

The following walks through the process of parsing JSON objects using the Bronze-Silver-Gold architecture.

Part 1:

Bronze load

Bronze Autoloader stream

Databricks Autoloader allows you to ingest new batch and streaming files into your Delta Lake tables as soon as data lands in your data lake. Using this tool, we can ingest the JSON data through each of the Delta Lake layers and refine the data as we go along the way.

With Autoloader, we could normally use the JSON format to ingest the data if the data was formatted in a proper JSON format. However, because this is improperly formatted, Autoloader will be unable to infer the schema.

Instead, we use the ‘text’ format for Autoloader, which will allow us to ingest the data into our Bronze table and later on apply transformations to parse the data. This Bronze layer will insert a timestamp for each load, and all of the file’s JSON objects contained in another column.

Setting up the Bronze Table Stream

Load the bronze Autoloader stream into the Bronze data table

Querying the bronze table

Bronze table results

In the first part of the notebook, the Bronze Delta stream is created and begins to ingest the raw files that land in that location. After the data is loaded into the Bronze Delta table, it’s ready for loading and parsing into the Silver Table.

Part 2:

Silver load

Now that the data is loaded into the Bronze table, the next part of moving the data through our different layers is to apply transformations to the data. This will involve using User-Defined Functions (UDF) to parse the table with regular expressions. With the improperly formatted data, we’ll use regular expressions to wrap brackets around the appropriate places in each record and add a delimiter to use later for parsing.

Add a slash delimiter

Building a UDF to utilize RegEx to add a slash delimiter

Results:

Each Device ID is now separated by a slash delimiter

Split the records by the delimiter and cast to array

With these results, this column can be used in conjunction with the split function to separate each record by the slash delimiter we’ve added and cast each record to a JSON array. This action will be necessary when using the explode function later:

Cast each record to an array datatype

Individual record arrays

Explode the Dataframe with Apache Spark™

Next, using the explode function will allow the arrays in the column to be parsed out separately in separate rows:

Using the explode function to get the final schema of the records

Parsed Record Results

Grab the final JSON object schema

Finally, we used the parsed row to grab the final schema for loading into the Silver Delta Table:

Using the schema_of_json function to grab the final schema from the Bronze Table

Silver autoloader stream

Using this schema and the from_json spark function, we can build an autoloader stream into the Silver Delta table:

Building a Stream for the Silver Delta Table

Loading the stream into the Silver table, we get a table with individual JSON records:

Creating the Silver Table and Loading the Streaming Data

Select Statement for the Silver Table

Silver Table Results

Part 3:

Gold load

Now that the individual JSON records have been parsed, we can use Spark’s select expression to pull the nested data from the columns. This process will create a column for each of the nested values:

Select Expressions to Parse Nested Values and load into the Gold Table

Gold table load

Using this Dataframe, we can load the data into a gold table to have a final parsed table with individual device readings for each row:

Creating the Gold Table and loading with the parsed data

Select Statement on the Gold Table

Gold Table Results

Business-Level table build

Finally, using the gold table, we’ll aggregate our temperature data to get the average temperate by reading location and load it into a business-level table for analysts.

Aggregating results from the Gold Table and Loading into the

Aggregate table results

Select statement for the aggregate table

Final aggregate table results

Conclusion

Using Databricks Autoloader with Spark functions, we were able to build an Bronze-Silver-Gold medallion architecture to parse individual JSON objects spanning multiple files. Once loaded into gold tables, the data can then be aggregated and loaded into various business-level tables. This process can be customized to an organization’s needs to allow for ease of use for transforming historical data into clean tables.

Try it yourself! Use the attached notebook to build the JSON simulation and use the Bronze-Silver-Gold architecture to parse out the records and build various business-level tables.

--

Try Databricks for free. Get started today.

The post Parsing Improperly Formatted JSON Objects in the Databricks Lakehouse appeared first on Databricks.

Databricks Expands Brickbuilder Solutions for Financial Services

$
0
0

Today, we’re excited to announce that Databricks has collaborated with Capgemini and Datasentics to expand Brickbuilder Solutions for financial services. Capgemini’s Legacy Cards and Core Banking Portfolios migration solution is built specifically for retail banks and credit card companies, while Datasentics, an Atos company, has also created the Persona 360 solution for retail banks as well as insurance companies. These new solutions, as well as the existing Avanade Risk Management Brickbuilder solution, make it easier for financial institutions to migrate into modern tech stacks and gain reliable insights about customers to improve business outcomes.

Earlier this year, Databricks announced Lakehouse for Financial Services, a platform that delivers partner solutions, use-case accelerators, and data monetization capabilities designed to address the unique requirements for financial service institutions. To complement the Lakehouse, we also introduced Brickbuilder Solutions – data and AI solutions expertly designed by leading consulting companies to address industry-specific business requirements.* Earlier this month, we announced the expansion of Brickbuilder Solutions to include partner migration solutions and healthcare and life sciences solutions, and later this month we will be launching additional manufacturing solutions. Backed by our partner’s industry experience — and built on the Databricks Lakehouse Platform — Brickbuilder Solutions are designed to fit within any stage of a customers’ journey to reduce costs and accelerate time to value.

Let’s take a further look into Databricks’ suite of financial services Brickbuilder Solutions.

Fig. 1: Brickbuilder Solutions are partner-developed industry and migration solutions for the lakehouse.

Fig. 1: Brickbuilder Solutions are partner-developed industry and migration solutions for the lakehouse.

Avanade Risk Management: modernize risk modeling in the cloud

Banking is one of the most data-intensive industries. As data volumes grow exponentially, financial institutions face significant data challenges. This includes managing an ever-increasing workload while preparing, cleaning, processing, storing, and curating multiple sources of financial data (e.g. loans, regulatory risk, CRM, AML/KYC, third-party, ESG to name a few). Unfortunately, legacy infrastructure and data platforms cannot keep up. As the data estate becomes more complex, it can be difficult for banks to effectively deploy the machine learning models and data science initiatives needed to stay competitive in this space. On top of that, they must constantly keep up with a changing landscape, from business disruptors to evolving regulatory and compliance demands.

Banks can mitigate these challenges by standardizing and simplifying risk management across business lines. Avanade’s Risk Management solution, built on Azure Databricks, helps banks accelerate their initiatives to deploy machine learning and data science. Its Metadata-Driven Data Management Framework automates and speeds up data ingestion from disparate data sources. Once data has been ingested, banks can leverage modern compute to analyze years of historical data, continuously monitor risk at enterprise scale, and streamline and accelerate model compliance and data transparency. Banking decision-makers can harness the predictive intelligence they need to model risk and correct course with the reliability, governance, and flexibility of a modernized data estate. Read more about the Avanade Risk Management solution.

Fig. 2: The Avanade Risk Management solution enables financial institutions to stay ahead of risks and provides decision-makers with the predictive intelligence they need to correct course.

Fig. 2: The Avanade Risk Management solution enables financial institutions to stay ahead of risks and provides decision-makers with the predictive intelligence they need to correct course.

Capgemini Legacy Cards and Core Banking Portfolios Modernization: reduce migration efforts by 50%

Across the retail and corporate lending segments, banks need to create agile business models in order to meet the challenges of changing customer experience demands and an ever-expanding ecosystem. The ability to migrate and integrate monolithic mainframe systems into modern tech stacks on the cloud is critical for retail banks in today’s competitive market. By transforming their digital future with legacy cards and core banking modernization solutions, banks realize benefits such as a reduction in total cost of ownership, boosts in operational efficiency and flexibility, and confidence that their IT platform is future-proofed.

Capgemini’s solution for migrating Legacy Cards and Core Banking Portfolios on Databricks enables rapid conversion from external source systems and provides a fully configurable and industrialized conversion capability. Leveraging Public Cloud services, this solution provides a cost-efficient conversion platform with predictable time to market. Now, you can rapidly complete ingestion, ease development of ETL jobs, and completely reconcile and validate conversion up to 50% faster.

DataSentics Persona 360: unify, understand and activate your customer data

Financial institutions are in a great position to deliver personalized experiences for their customers and form long-term relationships. Available data sources provide a lot of pieces representing the customer’s situation. To drive real impact, there are three essential elements that must be in place: people, tools and processes. However, these elements can come with challenges. For people, marketing (CRM) specialists and data scientists often work independently. This lack of contact impedes business impact. For tools, to put all data sources together into a compact customer feature store is tedious work that takes multiple years. And finally, for processes, it is difficult to organize a lot of data pipelines and customer attributes without proper tooling.

Persona 360 by DataSentics, an Atos company, is a product built with these challenges in mind. It puts state-of-the-art tools together to support the effective collaboration of data specialists with marketing specialists via a proposed workflow, allowing them to test their ideas quickly. Built on the Databricks Lakehouse Platform, Persona 360 comes with pre-built banking or insurance data model and pre-built 1695+ customer attributes to help you understand the differences between customer segments. It also includes ready-to-use connectors to allow you to leverage insights in marketing platforms (e.g., Facebook, Google, Salesforce) and enhance the personalization of your customer experiences based on AI insights. With Persona 360, grow the engagement of your communication by 37% and conversion rates by 45%.

Fig. 3. DataSentics’ Persona 360 strives to connect the workflow of data specialists and marketing specialists to deliver a real impact on business performance and customer satisfaction.

Fig. 3. DataSentics’ Persona 360 strives to connect the workflow of data specialists and marketing specialists to deliver a real impact on business performance and customer satisfaction.

Get Started with Brickbuilder Solutions

At Databricks, we continue to collaborate with our consulting partner ecosystem to enable use cases in financial services. Check out our full set of partner solutions on the Databricks Brickbuilder Solutions page.

Create Brickbuilder Solutions for the Databricks Lakehouse Platform

Brickbuilder Solutions is a key component of the Databricks Partner Program and recognizes partners who have demonstrated a unique ability to offer differentiated lakehouse industry and migration solutions in combination with their knowledge and expertise.

Partners who are interested in learning more about how to create a Brickbuilder Solution are encouraged to email us at partners@databricks.com.

*We have collaborated with consulting and system integrator (C&SI) partners to develop industry and migration solutions to address data engineering, data science, machine learning and business analytics use cases.

--

Try Databricks for free. Get started today.

The post Databricks Expands Brickbuilder Solutions for Financial Services appeared first on Databricks.


Cohort Analysis on Databricks Using Fivetran, dbt and Tableau

$
0
0

Overview

Cohort Analysis refers to the process of studying the behavior, outcomes and contributions of customers (also known as a “cohort”) over a period of time. It is an important use case in the field of marketing to help shed more light on how customer groups impact overall top-level metrics such as sales revenue and overall company growth.

A cohort is defined as a group of customers who share a common set of characteristics. This can be determined by the first time they ever made a purchase at a retailer, the date at which they signed up on a website, their year of birth, or any other attribute that could be used to group a specific set of individuals. The thinking is that something about a cohort drives specific behaviors over time.

The Databricks Lakehouse, which unifies data warehousing and AI use cases on a single platform, is the ideal place to build a cohort analytics solution: we maintain a single source of truth, support data engineering and modeling workloads, and unlock a myriad of analytics and AI/ML use cases.

In this hands-on blog post, we will demonstrate how to implement a Cohort Analysis use case on top of the Databricks in three steps and showcase how easy it is to integrate the Databricks Lakehouse Platform into your modern data stack to connect all your data tools across data ingestion, ELT, and data visualization.

Use case: analyzing return purchases of customers

An established notion in the field of marketing analytics is that acquiring net new customers can be an expensive endeavor, hence companies would like to ensure that once a customer has been acquired, they would keep making repeat purchases. This blog post is centered around answering the central question:

Here are the steps to developing our solution:

  1. Data Ingestion using Fivetran
  2. Data Transformation using dbt
  3. Data Visualization using Tableau

Step 1. Data ingestion using Fivetran

Setting up the connection between Azure MySQL and Fivetran

Setting up the connection between Azure MySQL and Fivetran

1.1: Connector configuration

In this preliminary step, we will create a new Azure MySQL connection in Fivetran to start ingesting our E-Commerce sales data from an Azure MySQL database table into Delta Lake. As indicated in the screenshot above, the setup is very easy to configure as you simply need to enter your connection parameters. The benefit of using Fivetran for data ingestion is that it automatically replicates and manages the exact schema and tables from your database source to the Delta Lake destination. Once the tables have been created in Delta, we will later use dbt to transform and model the data.

1.2: Source-to-Destination sync

Once this is configured, you then select which data objects to sync to Delta Lake, where each object will be saved as individual tables. Fivetran has an intuitive user interface that allows you to click which tables and columns to synchronize:

Fivetran Schema UI to select data objects to sync to Delta Lake

Fivetran Schema UI to select data objects to sync to Delta Lake

1.3: Verify data object creation in Databricks SQL

After triggering the initial historical sync, you can now head over to the Databricks SQL workspace and verify that the e-commerce sales table is now in Delta Lake:

Data Explorer interface showing the synced table

Data Explorer interface showing the synced table

Step 2. Data transformation using dbt

Now that our ecom_orders table is in Delta Lake, we will use dbt to transform and shape our data for analysis. This tutorial uses Visual Studio Code to create the dbt model scripts, but you may use any text editor that you prefer.

2.1: Project instantiation

Create a new dbt project and enter the Databricks SQL Warehouse configuration parameters when prompted:

  • Enter the number 1 to select Databricks
  • Server hostname of your Databricks SQL Warehouse
  • HTTP path
  • Personal access token
  • Default schema name (this is where your tables and views will be stored in)
  • Enter the number 4 when prompted for the number of threads
Connection parameters when initializing a dbt project

Connection parameters when initializing a dbt project

Once you have configured the profile you can test the connection using:


dbt debug
Indication that dbt has successfully connected to Databricks

Indication that dbt has successfully connected to Databricks

2.2: Data transformation and modeling

We now arrive at one of the most important steps in this tutorial, where we transform and reshape the transactional orders table to visualize cohort purchases over time. Within the project’s model filter, create a file named vw_cohort_analysis.sql using the SQL statement below.

Developing the dbt model scripts inside the IDE

Developing the dbt model scripts inside the IDE

The code block below leverages data engineering best practices of modularity to build out the transformations step-by-step using Common Table Expressions (CTEs) to determine the first and second purchase dates for a particular customer. Advanced SQL techniques such as subqueries are also used in the transformation step below, which the Databricks Lakehouse also supports:


{{
 config(
   materialized = 'view',
   file_format = 'delta'
 )
}}

with t1 as (
       select
           customer_id,
           min(order_date) AS first_purchase_date
       from azure_mysql_mchan_cohort_analysis_db.ecom_orders
       group by 1
),
       t3 as (
       select
           distinct t2.customer_id,
           t2.order_date,
       t1.first_purchase_date
       from azure_mysql_mchan_cohort_analysis_db.ecom_orders t2
       inner join t1 using (customer_id)
),
     t4 as (
       select
           customer_id,
           order_date,
           first_purchase_date,
           case when order_date > first_purchase_date then order_date
                else null end as repeat_purchase
       from t3
),
      t5 as (
      select
        customer_id,
        order_date,
        first_purchase_date,
        (select min(repeat_purchase)
         from t4
         where t4.customer_id = t4_a.customer_id
         ) as second_purchase_date
      from t4 t4_a
)
select *
from t5;

Now that your model is ready, you can deploy it to Databricks using the command below:


dbt run

Navigate to the Databricks SQL Editor to examine the result of script we ran above:

The result set of the dbt table transformation

The result set of the dbt table transformation

Step 3. Data visualization using Tableau

As a final step, it’s time to visualize our data and make it come to life! Databricks can easily integrate with Tableau and other BI tools through its native connector. Enter your corresponding SQL Warehouse connection parameters to start building the Cohort Analysis chart:

Databricks connection window in Tableau Desktop

Databricks connection window in Tableau Desktop

3.1: Building the heat map visualization

Follow the steps below to build out the visualization:

  • Drag [first_purchase_date] to rows, and set to quarter granularity
  • Drag [quarters_to_repeat_purchase] to columns
  • Bring count distinct of [customer_id] to the colors shelf
  • Set the color palette to sequential
Heat map illustrating cohort purchases over multiple quarters

Heat map illustrating cohort purchases over multiple quarters

3.2: Analyzing the result

There are several key insights and takeaways to be derived from the visualization we have just developed:

  • Among customers who first made a purchase in 2016 Q2, 168 customers took two full quarters until they made their second purchase
  • NULL values would indicate lapsed customers – those that did not make a second purchase after the initial one. This is an opportunity to drill down further on these customers and understand their buying behavior
  • Opportunities exist to shorten the gap between a customer’s first and second purchase through proactive marketing programs

Conclusion

Congratulations! After completing the steps above, you have just used Fivetran, dbt, and Tableau alongside the Databricks Lakehouse to build a powerful and practical marketing analytics solution that is seamlessly integrated. I hope you found this hands-on tutorial interesting and useful. Please feel free to message me if you have any questions, and stay on the lookout for more Databricks blog tutorials in the future.

Learn More

--

Try Databricks for free. Get started today.

The post Cohort Analysis on Databricks Using Fivetran, dbt and Tableau appeared first on Databricks.

Announcing General Availability of Delta Sharing

$
0
0

Today we are excited to announce that Delta Sharing is generally available (GA) on AWS and Azure. With the GA release, you can expect the highest level of stability, support, and enterprise readiness from Databricks for mission-critical workloads on the Databricks Lakehouse Platform.

In this blog, we explore how organizations leverage Delta Sharing to maximize the business value of their data, some of the key features available in the GA release, and how to get started with Delta Sharing on the Databricks Lakehouse Platform.

Customers win with the open standard for data sharing from the lakehouse

Data sharing has become important in the digital economy as enterprises look to easily and securely exchange data with their customers, partners, suppliers, and internal lines of business (LOBs) to better collaborate and unlock value from that data. But the lack of a standards-based data sharing protocol has resulted in solutions tied to a single vendor or commercial product, introducing vendor lock-in risks. These customer challenges led us, at Databricks, to build an open data sharing solution, Delta Sharing.

Delta Sharing provides an open solution to securely share live data from your lakehouse to any computing platform. Data recipients don’t have to be on the Databricks Lakehouse Platform or on the same cloud or on any cloud at all. Data providers can share existing large-scale data sets based on the Apache Parquet or Delta Lake formats, without replicating or copying data sets to another system. Data recipients benefit from always having access to the latest version of data with the ability to query, visualize, transform, ingest or enrich shared data with their tools of choice, reducing time-to-value. As governance and security are top concerns for many organizations, Delta Sharing is natively integrated with Unity Catalog, allowing you to manage, govern, audit, and track usage of the shared data on one platform.

Delta Sharing – An open standard for secure sharing of data assets

Since launching Delta Sharing in the private preview last year, hundreds of customers have embraced Delta Sharing, and today, petabytes of data is being shared through Delta Sharing.

Nasdaq: “Delta Sharing helped us streamline our data delivery process for large data sets. This enables our clients to bring their own compute environment to read fresh curated data with little-to-no integration work, and enables us to continue expanding our catalog of unique, high-quality data products” – William Dague, Head of Alternative Data

Shell: “We recognise that openness of data will play a key role in achieving Shell’s Carbon Net Zero ambitions. Delta sharing provides Shell with a standard, controlled, and secure protocol for sharing vast amounts of data easily with our partners to work towards these goals without requiring our partners be on the same data sharing platform” – Bryce Bartmann, Chief Digital Technology Advisor

SafeGraph: “As a data company, giving our customers access to our data sets is critical. The Databricks Lakehouse Platform with Delta Sharing really streamlines that process, allowing us to securely reach a much broader user base regardless of cloud or platform” – Felix Cheung, VP of Engineering

YipitData: “With Delta Sharing, our clients can access curated data sets nearly instantly and integrate them with analytics tools of their choice. The dialogue with our clients shifts from a low-value, technical back-and-forth on ingestion to a high-value analytical discussion where we drive successful client experiences. As our client relationships evolve, we can seamlessly deliver new data sets and refresh existing ones through Delta Sharing to keep clients appraised of key trends in their industries.” – Anup Segu, Data Engineering Tech Lead

Pumpjack Dataworks: “Leveraging the powerful capabilities of Delta Sharing from Databricks enables Pumpjack Dataworks to have a faster onboarding experience, removing the need for exporting, importing and remodeling of data, which brings immediate value to our clients. Faster results yield greater commercial opportunity for our clients and their partners” – Corey Zwart, Chief Technology Officer

What’s new in Delta Sharing with GA?

While Delta Sharing has a slate of amazing features in the GA release, provided below are some of the key features we are shipping with this release:

Seamless Databricks to Databricks Sharing

For Databrick customers, Delta Sharing makes data sharing on the lakehouse extremely simple, efficient and secure. With just a few UI clicks or SQL commands, data providers can easily share their existing data with recipients on Databricks, without replicating the data. For example, a data provider using Databricks on AWS can share existing data with a recipient using Databricks on Azure or vice-versa. You can explore the user guide for full details.

In Databricks to Databricks sharing, the data provider does not need to manage token credentials for recipients who are using Databricks; the sharing connection is established securely through the Databricks platform. All you need is a Databricks account to login and the rest is taken care of by the platform.

In addition to cross-account data sharing, another important use case is internal data sharing. If you have multiple Unity Catalog metastores under the same account in different regions, you can easily share data among those metastores by using Delta Sharing without copying any data.

SQL workflow example from a data provider’s perspective:

-- create a share and add a table to it
CREATE SHARE first_share;
ALTER SHARE first_share ADD TABLE my_table AS default.first_table;

-- create a Databricks recipient using their sharing identifier and grant them access to the share
CREATE RECIPIENT acme USING ID 'aws:us-west-2:3f9b6bf4-...-29bb621ec110';
GRANT SELECT ON SHARE first_share TO RECIPIENT acme;

SQL workflow example from a data recipient’s perspective:

-- list the providers who shared data with me
SHOW PROVIDERS;

-- view the data shared by provider acme_provider
SHOW SHARES IN PROVIDER acme_provider;

-- create a catalog from the share
CREATE CATALOG my_catalog USING SHARE `acme_provider`.`first_share`;

-- query the shared data
SELECT * FROM my_catalog.default.first_table;

Sharing Change Data Feed

Delta Sharing now supports sharing Change Data Feed (CDF). In addition to sharing a table, a data provider can choose to include the table’s CDF, allowing recipients to query changes between specific versions or timestamps of the table. With this feature, recipients can query just the new data or the incremental changes instead of the entire table each time.

A data provider can easily share a table with CDF, and a data recipient can query table changes with a simple syntax:

-- data provider: sharing a table with CDF enabled
ALTER SHARE my_share ADD my_table AS default.cdf_table WITH CHANGE DATA FEED

-- data recipient: query table changes from versions 5 to 10
SELECT * FROM table_changes('`default`.`cdf_table`', 5, 10)

Enhanced security features

In the GA release of Delta Sharing, we have also a set of security features to make sharing even more secure.

One example of those security features is IP Access List. Data providers can now configure an IP access list for each of their recipients using open connectors. It ensures that credential download and data access can only be initiated from the target IP address.

We also added a few more Delta Sharing related permissions (e.g. CREATE SHARE, CREATE RECIPIENT) and introduced owner concept for Delta Sharing objects like Share and Recipient. With those primitives, Delta Sharing on Databricks offers a more flexible access control model, and non-admin users can also perform sharing operations.

Getting Started with Delta Sharing on Databricks

Watch the demo below to learn more about how Delta Sharing can help you seamlessly share live data from your lakehouse to any computing platform.

If you already are a Databricks customer, follow the guide to get started (AWS | Azure). Read the release notes to learn more about what’s included in this GA release. If you are not an existing Databricks customer, sign up for a free trial with a Premium or Enterprise workspace.

--

Try Databricks for free. Get started today.

The post Announcing General Availability of Delta Sharing appeared first on Databricks.
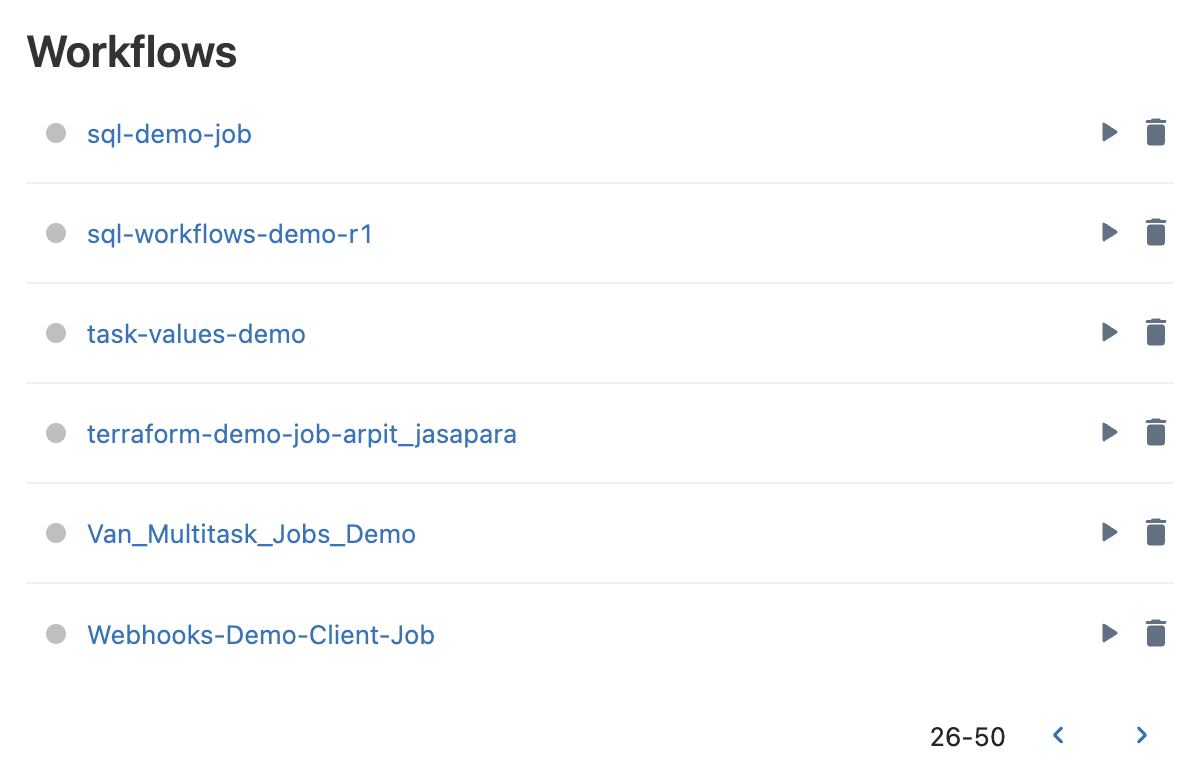
Databricks Workspace Administration – Best Practices for Account, Workspace and Metastore Admins

$
0
0

This blog is part of our Admin Essentials series, where we discuss topics relevant to Databricks administrators. Other blogs include our Workspace Management Best Practices, DR Strategies with Terraform, and many more! Keep an eye out for more content coming soon.

In past admin-focused blogs, we have discussed how to establish and maintain a strong workspace organization through upfront design and automation of aspects such as DR, CI/CD, and system health checks. An equally important aspect of administration is how you organize within your workspaces- especially when it comes to the many different types of admin personas that may exist within a Lakehouse. In this blog we will talk about the administrative considerations of managing a workspace, such as how to:

  • Set up policies and guardrails to future-proof onboarding of new users and use cases
  • Govern usage of resources
  • Ensure permissible data access
  • Optimize compute usage to make the most of your investment

In order to understand the delineation of roles, we first need to understand the distinction between an Account Administrator and a Workspace Administrator, and the specific components that each of these roles manage.

Account Admins Vs Workspace Admins Vs Metastore Admins

Administrative concerns are split across both accounts (a high-level construct that is often mapped 1:1 with your organization) & workspaces (a more granular level of isolation that can be mapped various ways, i.e, by LOB). Let’s take a look at the separation of duties between these three roles.

Figure-1 Account Console

Figure-1 Account Console

To state this in a different way, we can break down the primary responsibilities of an Account Administrator as the following:

  • Provisioning of Principals(Groups/Users/Service) and SSO at the account level. Identity Federation refers to assigning Account Level Identities access to workspaces directly from the account.
  • Configuration of Metastores
  • Setting up Audit Log
  • Monitoring Usage at the Account level (DBU, Billing)
  • Creating workspaces according to the desired organization method
  • Managing other workspace-level objects (storage, credentials, network, etc.)
  • Automating dev workloads using IaaC to remove the human element in prod workloads
  • Turning features on/off at Account level such as serverless workloads, Delta sharing
Figure-2 Account Artifacts

Figure-2 Account Artifacts

On the other hand, the primary concerns of a Workspace Administrator are:

  • Assigning appropriate Roles (User/Admin) at the workspace level to Principals
  • Assigning appropriate Entitlements (ACLs) at the workspace level to Principals
  • Optionally setting SSO at the workspace level
  • Defining Cluster Policies to entitle Principals to enable them to
    • Define compute resource (Clusters/Warehouses/Pools)
    • Define Orchestration (Jobs/Pipelines/Workflows)
  • Turning features on/off at Workspace level
  • Assigning entitlements to Principals
    • Data Access (when using internal/external hive metastore)
    • Manage Principals’ access to compute resources
  • Managing external URLs for features such as Repos (including allow-listing)
  • Controlling security & data protection
    • Turn off / restrict DBFS to prevent accidental data exposure across teams
    • Prevent downloading result data (from notebooks/DBSQL) to prevent data exfiltration
    • Enable Access Control (Workspace Objects, Clusters, Pools, Jobs, Tables etc)
  • Defining log delivery at the cluster level (i.e., setting up storage for cluster logs, ideally through Cluster Policies)
Figure-3 Workspace Artifacts

Figure-3 Workspace Artifacts

To summarize the differences between the account and workspace admin, the table below captures the separation between these two personas for a few key dimensions:

  Account Admin Metastore Admin Workspace Admin
Workspace Management – Create, Update, Delete workspaces
– Can add other admins
Not Applicable – Only Manages assets within a workspace
User Management – Create users, groups and service principals or use SCIM to sync data from IDPs.
– Entitle Principals to Workspaces with the Permission Assignment API
Not Applicable – We recommend use of the UC for central governance of all your data assets(securables). Identity Federation will be On for any workspace linked to a Unity Catalog (UC) Metastore.

– For workspaces enabled on Identity Federation, setup SCIM at the Account Level for all Principals and stop SCIM at the Workspace Level.
– For non-UC Workspaces, you can SCIM at the workspace level (but these users will also be promoted to account level identities).
– Groups created at workspace level will be considered “local” workspace-level groups and will not have access to Unity Catalog
Data Access and Management – Create Metastore(s)
– Link Workspace(s) to Metatore
– Transfer ownership of metastore to Metastore Admin/group
With Unity Catalog:
-Manage privileges on all the securables (catalog, schema, tables, views) of the metastore
– GRANT (Delegate) Access to Catalog, Schema(Database), Table, View, External Locations and Storage Credentials to Data Stewards/Owners
– Today with Hive-metastore(s), customers use a variety of constructs to protect data access, such as Instance Profiles on AWS, Service Principals in Azure, Table ACLs, Credential Passthrough, among others.
-With Unity Catalog, this is defined at the account level and ANSI GRANTS will be used to ACL all securables
Cluster Management Not Applicable Not Applicable – Create clusters for various personas/sizes for DE/ML/SQL personas for S/M/L workloads
– Remove allow-cluster-create entitlement from default users group.
– Create Cluster Policies, grant access to policies to appropriate groups
– Give Can_Use entitlement to groups for SQL Warehouses
Workflow Management Not Applicable Not Applicable – Ensure job/DLT/all-purpose cluster policies exist and groups have access to them
– Pre-create app-purpose clusters that users can restart
Budget Management – Set up budgets per workspace/sku/cluster tags
– Monitor Usage by tags in the Accounts Console (roadmap)
– Billable usage system table to query via DBSQL (roadmap)
Not Applicable Not Applicable
Optimize / Tune Not Applicable Not Applicable – Maximize Compute; Use latest DBR; Use Photon
– Work alongside Line Of Business/Center Of Excellence teams to follow best practices and optimizations to make the most of the infrastructure investment
Figure-4 Databricks Admin Persona Responsibilities

Figure-4 Databricks Admin Persona Responsibilities

Sizing a workspace to meet peak compute needs

The max number of cluster nodes (indirectly the largest job or the max number of concurrent jobs) is determined by the max number of IPs available in the VPC and hence sizing the VPC correctly is an important design consideration. Each node takes up 2 IPs (in Azure, AWS). Here are the relevant details for the cloud of your choice: AWS, Azure, GCP.

We’ll use an example from Databricks on AWS to illustrate this. Use this to map CIDR to IP. The VPC CIDR range allowed for an E2 workspace is /25 – /16. At least 2 private subnets in 2 different availability zones must be configured. The subnet masks should be between /16-/17. VPCs are logical isolation units and as long as 2 VPCs do not need to talk, i.e. peer to each other, they can have the same range. However, if they do, then care has to be taken to avoid IP overlap. Let us take an example of a VPC with CIDR rage /16:

VPC CIDR /16 Max # IPs for this VPC: 65,536 Single/multi-node clusters are spun up in a subnet
2 AZs If each AZ is /17 :
=> 32,768 * 2 = 65,536 IPs
no other subnet is possible
32,768 IPs => max of 16,384 nodes in each subnet
  If each AZ is /23 instead:
=> 512 * 2 = 1,024 IPs
65,536 – 1,024 = 64, 512 IPs left
512 IPs => max of 256 nodes in each subnet
4 AZs If each AZ is /18:
16,384 * 4 = 65,536 IPs
no other subnet is possible
16,384 IPs => max of 8192 nodes in each subnet

Balancing control & agility for workspace admins

Compute is the most expensive component of any cloud infrastructure investment. Data democratization leads to innovation and facilitating self-service is the first step towards enabling a data driven culture. However, in a multi-tenant environment, an inexperienced user or an inadvertent human error could lead to runaway costs or inadvertent exposure. If controls are too stringent, it will create access bottlenecks and stifle innovation. So, admins need to set guard-rails to allow self-service without the inherent risks. Further, they should be able to monitor the adherence of these controls.

This is where Cluster Policies come in handy, where the rules are defined and entitlements mapped so the user operates within permissible perimeters and their decision-making process is greatly simplified. It should be noted that policies should be backed by process to be truly effective so that one off exceptions can be managed by process to avoid unnecessary chaos. One critical step of this process is to remove the allow-cluster-create entitlement from the default users group in a workspace so that users can only utilize compute governed by Cluster Policies. The following are top recommendations of Cluster Policy Best Practices and can be summarized as below:

  • Use T-shirt sizes to provide standard cluster templates
    • By workload size (small, medium, large)
    • By persona (DE/ ML/ BI)
    • By proficiency (citizen/ advanced)
  • Manage Governance by enforcing use of
    • Tags : attribution by team, user, use case
      • naming should be standardized
      • making some attributes mandatory helps for consistent reporting
  • Control Consumption by limiting

Compute considerations

Unlike fixed on-prem compute infrastructure, cloud gives us elasticity as well as flexibility to match the right compute to the workload and SLA under consideration. The diagram below shows the various options. The inputs are parameters such as type of workload or environment and the output is the type and size of compute that is a best-fit.

Figure-5 Deciding the right compute

Figure-5 Deciding the right compute

For example, a production DE workload should always be on automated job clusters preferably with the latest DBR, with autoscaling and using the photon engine. The table below captures some common scenarios.

Workflow considerations

Now that the compute requirements have been formalized, we need to look at

  • How Workflows will be defined and triggered
  • How Tasks can reuse compute amongst themselves
  • How Task dependencies will be managed
  • How failed tasks can be retried
  • How version upgrades (spark, library) and patches are applied

These are Date Engineering and DevOps considerations that are centered around the use case and is typically a direct concern of an administrator. There are some hygiene tasks that can be monitored such as

  • A workspace has a max limit on the total number of configured jobs. But a lot of these jobs may not be invoked and need to be cleaned up to make space for genuine ones. An administrator can run checks to determine the valid eviction list of defunct jobs.
  • All production jobs should be run as a service principal and user access to a production environment should be highly restricted. Review the Jobs permissions.
  • Jobs can fail, so every job should be set for failure alerts and optionally for retries. Review email_notifications, max_retries and other properties here
  • Every job should be associated with cluster policies and tagged properly for attribution.

DLT: Example of an ideal framework for reliable pipelines at scale

Working with thousands of clients big and small across different industry verticals, common data challenges for development and operationalization became apparent, which is why Databricks created Delta Live Tables (DLT). It is a managed platform offering to simplify ETL workload development and maintenance by allowing creation of declarative pipelines where you specify the ‘what’ & not the ‘how’. This simplifies the tasks of a data engineer, leading to fewer support scenarios for administrators.

Figure-6 DLT simplifies the Admin's role of managing pipelines

Figure-6 DLT simplifies the Admin’s role of managing pipelines

DLT incorporates common admin functionality such as periodic optimize & vacuum jobs right into the pipeline definition with a maintenance job that ensures that they run without additional babysitting. DLT offers deep observability into pipelines for simplified operations such as lineage, monitoring and data quality checks. For example, if the cluster terminates, the platform auto-retries (in Production mode) instead of relying on the data engineer to have provisioned it explicitly. Enhanced Auto-Scaling can handle sudden data bursts that require cluster upsizing and downscale gracefully. In other words, automated cluster scaling & pipeline fault tolerance is a platform feature. Turntable latencies enable you to run pipelines in batch or streaming and move dev pipelines to prod with relative ease by managing configuration instead of code. You can control the cost of your Pipelines by utilizing DLT-specific Cluster Policies. DLT also auto-upgrades your runtime engine, thus removing the responsibility from Admins or Data Engineers, and allowing you to focus only on generating business value.

UC: Example of an ideal Data Governance framework

Unity Catalog (UC) enables organizations to adopt a common security model for tables and files for all workspaces under a single account, which was not possible before through simple GRANT statements. By granting and auditing all access to data, tables/or files, from a DE/DS cluster or SQL Warehouse, organizations can simplify their audit and monitoring strategy without relying on per-cloud primitives.
The primary capabilities that UC provides include:

Figure-7 UC simplifies the Admin's role of managing data governance

Figure-7 UC simplifies the Admin’s role of managing data governance

UC simplifies the job of an administrator (both at the account and workspace level) by centralizing the definitions, monitoring and discoverability of data across the metastore, and making it easy to securely share data irrespective of the number of workspaces that are attached to it.. Utilizing the Define Once, Secure Everywhere model, this has the added advantage of avoiding accidental data exposure in the scenario of a user’s privileges inadvertently misrepresented in one workspace which may give them a backdoor to get to data that was not intended for their consumption. All of this can be accomplished easily by utilizing Account Level Identities and Data Permissions. UC Audit Logging allows full visibility into all actions by all users at all levels on all objects, and if you configure verbose audit logging, then each command executed, from a notebook or Databricks SQL, is captured.

Access to securables can be granted by either a metastore admin, the owner of an object, or the owner of the catalog or schema that contains the object. It is recommended that the account-level admin delegate the metastore role by nominating a group to be the metastore admins whose sole purpose is granting the right access privileges.

Recommendations and best practices

  • Roles and responsibilities of Account admins, Metastore admins and Workspace admins are well-defined and complementary. Workflows such as automation, change requests, escalations, etc. should flow to the appropriate owners, whether the workspaces are set up by LOB or managed by a central Center of Excellence.
  • Account Level Identities should be enabled as this allows for centralized principal management for all workspaces, thereby simplifying administration. We recommend setting up features like SSO, SCIM and Audit Logs at the account level. Workspace-level SSO is still required, until the SSO Federation feature is available.
  • Cluster Policies are a powerful lever that provides guardrails for effective self-service and greatly simplifies the role of a workspace administrator. We provide some sample policies here. The account admin should provide simple default policies based on primary persona/t-shirt size, ideally through automation such as Terraform. Workspace admins can add to that list for more fine-grained controls. Combined with an adequate process, all exception scenarios can be accommodated gracefully.
  • Tracking the on-going consumption for all workload types across all workspaces is visible to account admins via the accounts console. We recommend setting up billable usage log delivery so that it all goes to your central cloud storage for chargeback and analysis. Budget API (In Preview) should be configured at the account level, which allows account administrators to create thresholds at the workspaces, SKU, and cluster tags level and receive alerts on consumption so that timely action can be taken to remain within allotted budgets. Use a tool such as Overwatch to track usage at an even more granular level to help identify areas of improvement when it comes to utilization of compute resources.
  • The Databricks platform continues to innovate and simplify the job of the various data personas by abstracting common admin functionalities into the platform. Our recommendation is to use Delta Live Tables for new pipelines and Unity Catalog for all your user management and data access control.

Finally, it’s important to note that for most of these best practices, and in fact, most of the things we mention in this blog, coordination, and teamwork are tantamount to success. Although it’s theoretically possible for Account and Workspace admins to exist in a silo, this not only goes against the general Lakehouse principles but makes life harder for everyone involved. Perhaps the most important suggestion to take away from this article is to connect Account / Workspace Admins + Project / Data Leads + Users within your own organization. Mechanisms such as Teams/Slack channel, an email alias, and/or a weekly meetup have been proven successful. The most effective organizations we see here at Databricks are those that embrace openness not just in their technology, but in their operations.

Keep an eye out for more admin-focused blogs coming soon, from logging and exfiltration recommendations to exciting roundups of our platform features focused on management.

--

Try Databricks for free. Get started today.

The post Databricks Workspace Administration – Best Practices for Account, Workspace and Metastore Admins appeared first on Databricks.

Databricks Expands Brickbuilder Solutions for Manufacturing

$
0
0

The combination of scalable, cloud-based advanced analytics with Edge compute is rapidly changing real-time decision-making for Industry 4.0 or Intelligent Manufacturing use cases. When implemented correctly, this combination lowers analytics costs, eliminates data transfer latency and enables higher business impact across the manufacturing value chain.

Today, we’re excited to announce that Databricks has collaborated with Avanade and Tredence to expand Brickbuilder Solutions to include manufacturing solutions. This builds off other recent expansions to our Brickbuilder program, including new migration, healthcare and life sciences, and financial services solutions.

We know that implementing operational and supply chain improvements can be a daunting task, especially if you consider the need for real-time data ingest and the volume and velocity of data generated by industrial Internet of Things (IoT). If not done correctly, it can lead to loss of uptime, throughput or quality. The new Brickbuilder manufacturing solutions help manufacturers achieve full value from their digital transformation, increasing operational efficiencies and boosting product innovation.

Let’s take a further look into Databricks’ suite of manufacturing Brickbuilder Solutions.

Fig. 1: Brickbuilder Solutions are partner-developed industry and migration solutions for the lakehouse.

Fig. 1: Brickbuilder Solutions are partner-developed industry and migration solutions for the lakehouse.

Avanade Intelligent Manufacturing: improve outcomes across production and customer insights

Every year, businesses lose millions of dollars due to equipment failure, unscheduled downtime and lack of control in maintenance scheduling. Avanade’s Intelligent Manufacturing solution supports connected production facilities and assets, workers, products and consumers to create value through enhanced insights and improved outcomes. Manufacturers can harness data to drive interoperability and enhanced insights at scale using analytics and AI. Outcomes include improvements across production (e.g., uptime, quantity and yield), better experiences for workers, and greater insight into what customers want.

Fig. 2: Avanade's Intelligent Manufacturing solution supports connected production facilities to create value through enhanced insights and improved outcomes.

Fig. 2: Avanade’s Intelligent Manufacturing solution supports connected production facilities to create value through enhanced insights and improved outcomes.

Tredence Edge-AI: seamless Edge implementation of AI at operational sites

As manufacturers look to leverage AI-driven solutions at their operational sites, they need to take three things into account: limited IT infrastructure, low latency requirements, and collaboration between data science and operational teams. The Tredence Edge-AI solution solves for these challenges by acting as an Edge to Cloud bridge, enabling low data and insights latency, while also enabling the scalability of deployments required across many manufacturing use cases. It leverages the tools, flexibility, and lower cost of cloud model development and reduces the insights latency that previously restricted the potential of real-time use cases such as process optimization, energy optimization, predictive maintenance and quality assurance leveraging computer vision.

Today, a world leader in metal products manufacturing and recycling is using Edge-AI to quickly build AI models on the cloud and deploy them on Edge devices. This has helped them mitigate cycle time losses and manage quality variance in near real-time. Additionally, Edge-AI was used to orchestrate model triggering and monitor model insights performance and adoption by users, delivering closed-loop feedback to the data science teams for further action. As a result, Edge-AI is set to deliver reduced unscheduled stoppages by up to 50% and wastage and scrap of ~25%.

Fig. 3. Tredence's Edge-AI solution accelerates deployment of ML models built on the Databricks Lakehouse Platform to Edge devices located in the plant.

Fig. 3. Tredence’s Edge-AI solution accelerates deployment of ML models built on the Databricks Lakehouse Platform to Edge devices located in the plant.

See More Brickbuilder Solutions

At Databricks, we continue to collaborate with our consulting partner ecosystem to enable use cases in manufacturing. Check out our full set of partner solutions on the Databricks Brickbuilder Solutions page.

Create Brickbuilder Solutions for the Databricks Lakehouse Platform

Brickbuilder Solutions is a key component of the Databricks Partner Program and recognizes consulting and solution integrator partners who have demonstrated a unique ability to offer differentiated industry and migration solutions on the Databricks Lakehouse Platform in combination with their knowledge and expertise.

Partners who are interested in learning more about how to create a Brickbuilder Solution are encouraged to email us at partners@databricks.com.

*We have collaborated with consulting and system integrator (C&SI) partners to develop industry and migration solutions to address data engineering, data science, machine learning and business analytics use cases.

--

Try Databricks for free. Get started today.

The post Databricks Expands Brickbuilder Solutions for Manufacturing appeared first on Databricks.

Python Arbitrary Stateful Processing in Structured Streaming

$
0
0
More and more customers are using Databricks for their real-time analytics and machine learning workloads to meet the ever increasing demand of their...
Viewing all 1874 articles
Browse latest View live